Tunable-filter imaging of quasar fields at . I. A cluster around MRC B0450–221
Abstract
Using a combination of multicolour broad- and narrow-band imaging techniques and follow-up spectroscopy, we have detected an overdensity of galaxies in the field of quasar MRC B0450221, whose properties are consistent with a cluster at the quasar redshift . An excess of red galaxies (, ) is evident within of the quasar, with the colours expected for galaxies at that have evolved passively for 3 Gyr or more. A number of line-emitting galaxies (nine candidates with equivalent widths Å) are also detected in the field using the TAURUS Tunable Filter (TTF). Three have been confirmed spectroscopically to indeed lie at . The TTF candidates with the strongest [O ii] line emission cluster in a group which lies 200–700 kpc away from the quasar and the red galaxy excess, and therefore most likely on the outskirts of the cluster. These observations are the first in a series probing quasar environments at with TTF.
Subject headings:
Galaxies: active — galaxies: clusters: general — quasars: individual (MRC B0450221)1. Introduction
Clusters and groups of galaxies are notoriously difficult to find at redshifts and beyond. The two conventional methods — X-ray and blind optical surveys — are difficult and highly incomplete beyond about . Optical surveys are hampered by the lack of contrast between the distant cluster and foreground galaxies, and X-ray surveys are biased towards detecting the most massive (and/or merging) clusters at high redshift. An efficient way to initiate a search for distant galaxy clusters is to use markers already known to be at high redshift, such as active galactic nuclei (AGN). Radio-loud AGN are favoured as pointers to high- structures because they can be seen out to the highest redshifts and previous studies have found they tend to inhabit environments of above average galaxy density at least out to (Yee & Green 1987). In addition, selection of radio sources avoids the inadvertent omission of objects which are highly obscured by dust. AGN environments may also play a key rôle in the luminosity evolution of AGN — at moderate redshifts high-luminosity AGN are found in rich clusters, whereas at only low-luminosity AGN reside in the richest clusters (Ellingson, Yee & Green 1991; Hill & Lilly 1991).
Most galaxy clusters detected around AGN have been identified on the basis of statistical overdensities of objects found within some radius of the AGN (e.g. Yee & Green 1987; Hutchings 1995; Hall, Green & Cohen 1998). However, a better strategy to overcome foreground dilution is to identify individual high-redshift galaxies by, for example, their characteristic colours or emission lines. Perhaps easiest to distinguish are the very red galaxies characteristic of passively evolving ellipticals found in cluster cores (Smail et al. 1998). However, these red galaxies may be few in number as the fraction of blue galaxies in clusters is known to increase substantially at (Butcher & Oemler 1984; Dressler & Gunn 1992), possibly reaching proportions as high as 80% of the cluster population at (Rakos & Schombert 1995). Therefore, the search for blue, star-forming galaxies must form a crucial part of any survey for distant clusters. However, there have been very few observations of emission-line galaxies around AGN, mainly as a result of poor sensitivity due to the relatively wide pass-bands and low efficiency of monolithic narrow-band filters in the optical and infrared. In addition, there have been no systematic surveys of complete samples of AGN, as this would require obtaining a large set of filters to cover a range of redshifted pass-bands. Nevertheless, groups of emission-line galaxies have indeed been noted in a number of quasar fields at –2 (Hutchings, Crampton & Persram 1993; Hutchings 1995).
From a broader perspective, both field and cluster samples (Ellis et al. 1996; Cowie et al. 1996, 1997; Hammer et al. 1997; Balogh et al. 1997, 1998) indicate that more star-formation is occurring on average at –1 than in the nearby universe (e.g. Butcher & Oemler 1984; Lilly et al. 1996; Madau et al. 1996; Connolly et al. 1997; Madau, Pozzetti & Dickinson 1998 but see Cowie, Songaila & Barger 1999). In addition, star-formation is apparently reduced in the centres of massive clusters (Balogh et al. 1997, 1998), suggesting star-formation is affected by environment, although the processes causing this are unclear. Both spectroscopic field and cluster samples, however, become incomplete at about . At this redshift and beyond, narrow-band imaging techniques are the most efficient in detecting emission-line galaxies. In fact galaxies out to the highest redshifts have been found in this way by their strong Ly emission (Hu, Cowie & McMahon 1998; Hu, McMahon & Cowie 1999). Narrow-band imaging has the obvious advantage that galaxy selection is made directly on the basis of high star-formation rate, so the most active systems are found most easily.
Another reason for pursuing emission-line galaxies in distant clusters and quasar environments is that blue galaxies tend to dominate the outer regions of rich clusters, where they are sensitive probes of cluster sub-structure. The study of sub-structure is very important at high redshifts, where the aggregation of clusters from smaller groups is expected if clusters formed hierarchically (e.g. Jenkins et al. 1998).
A powerful way, therefore, of searching for galaxies around high-redshift AGN is the combination of multicolour imaging (to detect the red population) and narrow-band imaging (to detect emission-line galaxies; ELGs). Using both these methods, we have set out to target systematically the fields of a representative sample of radio-loud quasars (drawn from the Molonglo Quasar Sample; see Kapahi et al. 1998). Full results for the survey will be published elsewhere; preliminary results are given in Bremer & Baker (1998) and Bremer, Baker & Lehnert (2000). This study benefits in particular from deep narrow-band imaging carried out using the TAURUS Tunable Filter (TTF) — a Fabry-Perot-based imaging system developed at the Anglo-Australian Telescope (AAT). TTF enables sensitive narrow-band imaging with spectral resolution –1000, tunable over the window 3700–10000 Å (Bland-Hawthorn & Jones 1997, 1998). With the high throughput and narrow bands attainable with TTF we achieve high sensitivities (e.g. erg cm-2s-1arcsec-2 () in 12 minutes of integration), which are sufficient to probe [O ii] emission in galaxies with star-formation rates greater than a few M⊙yr-1 at . TTF data for the full sample will be presented in a future paper.
In this paper, we report the detection of a cluster in the first field studied, MRC B0450–221, a quasar at . This is inferred from an excess of red galaxies near the quasar detected in broad-band images, and also an excess of emission-line galaxies detected in the field. The observations (TTF, broad-band imaging and follow-up spectroscopy) and analysis are described in detail in Section 2, and results presented in Sections 3 and 4. These include the detection, and confirmation with multi-object spectroscopy, of [O ii]-emitting galaxies at in the field of MRC B0450–221 with TTF. Cosmological parameters of km s-1 Mpc-1, and are taken throughout.
2. Observations
2.1. Broad-band optical and infrared imaging
Broad-band optical imaging of the field of MRC B0450–221 was carried out using EFOSC-I at the ESO 3.6m telescope at La Silla on 1997 March 12. Deep images in (1800s) and Gunn (3600s) filters were obtained in average seeing of 12. The field of the pixel Tektronix CCD covered 52 52 with 061 pixels. Photometric standard stars and twilight-sky flat fields were observed in all filters. The data were bias-subtracted, flat-fielded and photometrically analysed using standard methods in IRAF and FOCAS (Valdes 1993). Limiting magnitudes ( in a three-pixel radius aperture) are and . The -band photometry was carried out within the standard Bessell/Cousins system (colour term corrections from using the Gunn filter are less than 0.1 mag and so have been neglected). Galactic extinction corrections have not been applied as the extinction is low along this sightline (, ; Schlegel et al. 1998).
Infrared images were obtained on 1996 February 8–9 with the ESO 2.2m telescope using the IRAC-2B camera equipped with a HgCdTe array (0506 per pixel). A field of diameter 25 centred on the quasar was observed in the and bands for a total of 1 hour each. The total integration time was subdivided into many short-exposure frames (30 in , 60 in ) which were dithered in a non-repeating pattern on the sky. The images were dark-subtracted, flat-fielded and the sky was removed in a standard fashion using specially written IDL routines. Photometric calibration was achieved by observing UKIRT faint standard stars FS11, FS14 and FS27.
Infrared object detection and photometry were carried out using FOCAS (Valdes 1993) over a region around the quasar, where the noise in the mosaic image was lowest. The infrared and images are shown in Figure 1 together with the optical and images for the same area. In order to detect all objects visible by eye in the infrared fields, the detection threshhold was set to 1.5 times the background noise level of the combined frame for objects comprising 4 contiguous pixels or more. Magnitudes (measured within 30-diameter circular apertures) were determined for all 44 objects in the field, of which 33 were fainter than and detected in both the and frames. Limiting magnitudes () are and for the mosaic images. Photometry for these 33 objects is listed in Table 1. Of these faint objects, ten were at or below the detection limit in , and two were detected neither in nor in the optical images (to approximate limits =25, =23.5). The colours of the two reddest objects, , and 2.1 and , are consistent with very red galaxies seen in other fields, including so-called extremely red objects (EROs; Elston, Rieke & Rieke 1988; Thompson et al. 1999).
2.2. Tunable filter imaging: observations
The quasar MRC B0450221 was observed with TTF on the TAURUS-2 Fabry-Perot Imager at f/8 on the AAT on 1997 February 3. The Tek 1024 pixel CCD detector was used, with a resulting pixel scale of 060 over a -diameter circular field. TTF was tuned at the field centre to give an observed bandpass of 8.7Å FWHM centred on the wavelength of [O ii] 3727 at the quasar redshift, . The efficiency of the narrow observing band is high, being dictated only by the high throughput of the wider 7070/260Å order-sorting filter (about 90% peak response) and the instrumental throughput of TTF (again about %). The transmission profiles of the order-blocking filter and the the individual scans are shown in Figure 2.

A wavelength scale for the TTF observations (mapping instrumental units, , to wavelength, , for different etalon spacings) was calibrated at the field centre (and also at the eastern edge of the field) to within 1Å by scanning through lines in a CuAr comparison lamp spectrum. Example settings and parameters for a typical TTF setup used are given in Table 2. Because the transmitted wavelength varies due to the differing angles of incidence of light rays entering the Fabry-Perot etalon, there is a radial dependence of transmitted wavelength away from the position of the optical axis. Thus arc or night-sky OH lines appear as rings or arcs. To ease removal of cosmic rays and ghost images, the etalon was tilted so that the optic axis lay 280 pixels to the south of the field centre. To illustrate the off-centre geometry and show the amount of variation in transmitted wavelength across the field, Figure 3 shows the TTF image with wavelength contours superimposed at intervals of 7 Å. Thus, for a single etalon spacing, there is a north-south gradient in transmitted wavelength of about 35Å in , and approximately 14Å difference between the centre and the east/west edges of the field.
TTF scanned the quasar field in seven consecutive steps of 7Å (frames F1 to F7) either side of and centred on [O ii] at the quasar redshift. At this redshift, the steps correspond to velocity intervals of 300 km s-1. Total exposure times were 1000s in each band, and the seeing typically 15 FWHM. Multiple exposures were taken, dithered by about on the sky, to allow the unambiguous rejection of cosmic rays and ghost images. A spectrophotometric standard star (LTT 2415) was observed at the central TTF wavelength setting of the scan. The TTF photometry is expressed thoughout in AB magnitudes (denoted here). Dome flats were also taken through TTF at each wavelength setting.
2.3. Tunable filter imaging: data reduction
The raw TTF images were bias-subtracted and flat-fielded using standard procedures in iraf. Emission from night-sky lines, visible as rings in the Fabry-Perot images, was removed using median frames to within two percent of the background level. This reduction produced a set of seven images, one for each of the narrow bands. Limiting magnitudes were in each individual frame and for a summed image of all 7 frames ( in a 3-pixel radius circular aperture).
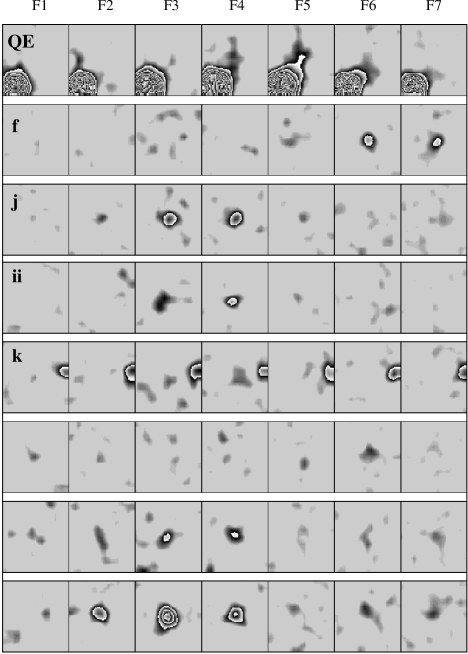
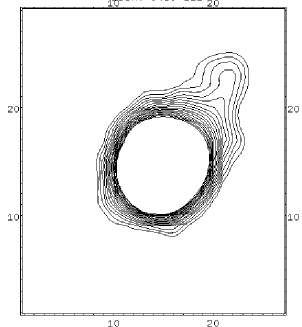
Objects in the field which brightened in one or two bands were clearly visible by eye in the TTF images — examples are shown in Figure 4, including the quasar itself (bright object offset from centre in the top panel). Extended emission is clearly visible to one side of the quasar peaking about 300 km s-1 redward of the published redshift (sampled in F4), and clearly visible over the range 0–1000 km s-1. Figure 5 shows a contour image of the extended emission-line region. The close alignment of this emission with the radio jet axis (Kapahi et al. 1998; Figure 6) suggests it is physically associated with the quasar outflow, but we note the possibility that it may be instead a separate galaxy projected nearby. If the extended emission is associated with the quasar, then its slightly higher redshift may indicate that the true systemic redshift of the quasar is closer to rather than . Extended narrow-line emission is generally taken to be a better indicator of the systemic redshift than the broad emission lines, which may show systematic velocity shifts relative to the narrow lines of order several hundred km s-1 (Gaskell 1982; Tytler & Fan 1992). However, the published redshift, , was based essentially on broad Mg ii (Hunstead, Murdoch & Shobbrook 1978) which is rarely shifted far from the systemic redshift on average (Tytler & Fan 1992). For consistency we will continue to use the published redshift () as a reference point throughout this paper111A recent spectrum of quasar MRC B0450–221, taken after this paper was submitted, indeed shows a more accurate redshift of (de Silva et al., in preparation)..
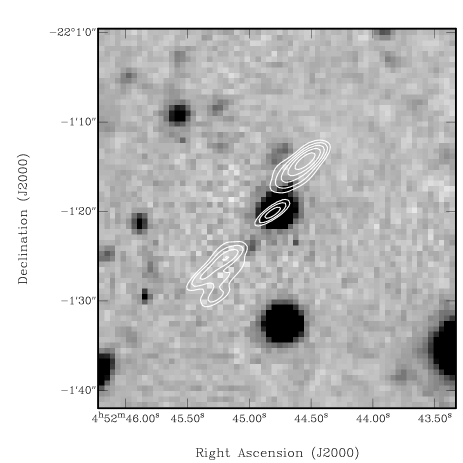
As shown in Figure 6 and described by Kapahi et al. (1998), the radio morphology of MRC B0450–221 is that of a classic triple FR II source. It is lobe-dominated, with a steep spectrum and radio core-to-lobe luminosity ratio (at 10 GHz, restframe) . The source has a total projected extent of oriented in position angle PA=135∘. Given the limited dynamic range and resolution of the radio image, there are no obvious indications of strong interactions between the radio plasma and any intracluster medium (e.g. tails, bent structure). However, the source does follow the correlation of closer (northern) radio lobe falling on the same side as the extended optical emission (McCarthy, van Breugel & Kapahi 1991), which might indicate higher ambient density on this side. Further study of the radio-optical alignment is deferred until better quality radio data are available.
2.4. TTF photometry and object detection
Object detection and aperture photometry were carried out on the TTF frames using FOCAS (Valdes 1993). To avoid edge effects, the circular TTF images were first trimmed down to the central square. The images were summed to form a deep image for object detection purposes. Objects were identified in the co-added image using a three-pixel aperture radius (18) and detection threshhold, to optimise sensitivity to objects near the detection limit. Aperture photometry was then carried out using the same aperture template for each TTF frame — fixed apertures (rather than isophotes) were preferred in order that the noise uncertainties be well defined. Because small apertures were used, a constant 0.4 mag offset was applied to each object (at the end of the analysis described in Section 3.1) to correct for missing flux. This offset was measured by comparing magnitudes measured with the three-pixel apertures and larger apertures (e.g. five and seven-pixel radii) for both stars and galaxies over the whole field. The offset was constant over the whole magnitude range within the photometric uncertainties. By matching the catalogues generated in this way, a preliminary database was created containing a set of magnitudes in each TTF frame for each object in the field. As shown in Figure 7, object detection by this process was essentially complete to .

2.5. Multi-object spectroscopy
Follow-up multi-slit spectroscopy was carried out on 14 objects in the field of MRC B0450–221 using EFOSC-2 on the ESO 3.6-m telescope at La Silla on 1998 September 28. A 300-line/mm grating was used with the Loral CCD detector (with two-pixel binning in both the spatial and spectral directions) to attain 10Å spectral resolution over the approximate wavelength range 5500–10000Å. Thirteen slitlets, oriented east-west, were used to target simultaneously two bright stars and 12 faint galaxies (typically –22) near the quasar. The targets included five convincing ELG candidates detected in the TTF analysis (described in Section 3.1), a red galaxy, and other targets chosen simply in order to fit as many candidates as possible near to the quasar in the slit mask (see Section 3.5 for specific targets and results). The field was observed for a total of four hours, split into 30-min exposures. Due to time constraints (mainly due to weather) we were only able to observe with a single slit mask. Seeing was variable , and conditions were not photometric.
The individual images were first bias-subtracted and flat-fielded using standard procedures in IRAF. Then the images were co-added and cosmic rays removed. For each slit, the background emission from the night sky was interpolated and subtracted, and the final spectrum extracted. Wavelength calibrations were carried out using observations of a CuAr comparison lamp taken through the slit mask.
3. Identification of ELGs in TTF data
3.1. Line identification method
In order to distinguish emission-line galaxies peaking in any one of the seven TTF frames, an automated method was adopted. First, photometric zeropoint offsets between frames were corrected by comparing the averages of the measured magnitudes of bright unsaturated stellar objects (–17) in the field. The final corrections were less than 0.2 mag in all the frames, and were made relative to the central-wavelength frame (F4) — this effectively removed systematic offsets between frames to within 0.02 magnitudes. Next, for each object in the field, the frame in which the raw counts for that object were a maximum, i.e. the peak flux, was determined. The significance of this peak was calculated relative to the average counts measured in the other frames, after excluding the one in which the peak occurred and the (one or) two frames adjacent to it. The neighbouring frames were excluded because the emission lines typically spread flux over two or more frames. Objects where the difference between peak (‘line’) and average off-peak (‘continuum’) counts exceeded 2.5 times the rms sky noise in that bin () were considered to be preliminary emission-line candidates. This level (rather than a more conservative ) was adopted as a first cut in order to include as many real detections as possible, given the relatively short integration times for these preliminary observations and that line flux may be spread over two or more bands. A wavelength for the peak was assigned to each object according to the spatial dependence of wavelength discussed in Section 2.2.
To exclude faint M-stars — which have a strong TiO strong absorption feature at 7050Å and which might otherwise contaminate the data over our small wavelength window — we only considered candidates whose peak fluxes fall at wavelengths longer than 7050Å. According to Martini & Osmer (1998) in a comparable deep multicolour survey, we would expect of order 35 M-stars in a field of down to , which is of order the number excluded by this cutoff criterion (i.e. 53 objects, which includes some whose signal is primarily noise and so excluded at random).
The difference between the ‘continuum’ and peak magnitudes is plotted in Figure 8 as a function of continuum magnitude for all objects detected in the field (and peaking longer than 7050Å). Curves are shown corresponding to 1, 2, 3 and 5 times the rms noise errors (). The lower envelope on Figure 8 is close to the curve as expected; in seven bins, essentially all objects should show at least a peak due to noise statistics alone. Clearly, more faint objects are detected with peaks above than expected due to noise alone; for objects fainter than , 17/68 have peak fluxes falling above the level, of which five lie above in Figure 8. The quasar itself lies well above the noise curves.
We now consider ELG candidates with the following properties: (i) excess emission greater than 2.5 times the rms sky noise in at least one band, and (ii) average continuum magnitude fainter than . As mentioned above, 17 candidates fulfill these criteria. This magnitude cutoff was chosen to select the most massive ellipticals at and fainter galaxies. The brightest member of a typical cluster at is expected to have –21 (Hoessel, Gunn & Thuan 1980), so several tens of cluster galaxies would be expected to be seen down to . This is also consistent with the magnitude- relation for 3CR radio galaxy hosts, which are typically at (Eales 1985; Snellen et al. 1996) and may be progenitors of central cluster galaxies (Best, Longair & Röttgering 1998). We note that a brighter limit, , would only have introduced two extra candidates. Later, we will consider only ELG candidates with high equivalent widths as the strongest candidates.

3.2. Velocity distribution of ELG candidates
To examine the distribution of ELG candidates as a function of wavelength, the space density of ELG candidates has been calculated separately for seven consecutive 7Å ( km s-1) wavelength slices (Figure 9), under the gross assumption that all the candidates are real. An important point (see Section 2.2) is that the total wavelength range covered at any given pixel is different at different locations in the field, and so certain parts of the field are not sampled at some wavelengths. Simply because of the geometry of the optical setup used, more of the field is sampled to the blue than to the red of the quasar redshift. Figure 10 shows the spatial limits of the areas sampled in each of the seven wavelength slices discussed above. Obviously, therefore, the total volume sampled per bin varies with wavelength.
With allowances for volume sampling, Figure 9 shows that the typical space density of TTF ELG candidates found around MRC B0450–221 is of order 0.03–0.05 Mpc-3. There is a hint of an excess of objects within km s-1 of the quasar, but because of the small number of objects in each bin, this trend is not formally significant.

3.3. [O ii] equivalent widths and star-formation rates
Equivalent widths and line luminosities have been calculated from the TTF data as part of the analysis, assuming that enhanced emission in the narrow TTF bands is indeed due to [O ii] at . Line luminosities above the continuum magnitude (as estimated above) were calculated simply by adding the excess flux in the three bins centred on the line peak. This process may underestimate line flux if the peak does not occur in the central bin or if the lines are broad. For objects where the continuum was not detected at all in the TTF data by FOCAS, an upper limit of (equivalent to the detection threshold) was assumed. The objects with the highest equivalent widths necessarily had faint continua (at or below the detection limits) and so are subject to large uncertainties — uncertainties of one or two magnitudes in the continuum level of objects with –23 will lead to uncertainties in equivalent widths of factors of 2–6.
For the 17 candidates () fainter than , equivalent widths in the range 14–275 Å are measured (see Figure 11), or 7–145 Å in the restframe if the galaxies lie at . Three objects have lower limits within the range Å, and two more have limits and Å.


The corresponding line luminosities, assuming the objects lie at , all exceed erg s-1. Using the conversion of Gallagher, Bushouse & Hunter (1989) from [O ii] line luminosity ( in erg s-1) to star-formation rate (SFR in M⊙yr-1) — SFR — equivalent star formation rates of 1–40 M⊙yr-1 are implied (see Figure 12). As well as uncertainties arising from redshift assumptions and measurement, the empirical conversion from to star-formation rate is itself uncertain by a factor of a few due to intrinsic scatter in the samples used to calibrate the relationship against other more direct star-formation indicators (such as UV luminosity and hydrogen recombination lines). We note that these indicators are all highly model dependent and include gross assumptions about metallicity, IMF and their redshift evolution as well as uncertainties in basic properties of gas, dust, ionisation and extinction in star-forming galaxies at (see Gallagher et al. 1989; Kennicutt 1992; Hammer et al. 1997 and the review by Kennicutt 1998).

3.4. High equivalent-width ELG candidates
We now consider only the strongest ELG candidates, nine objects selected to have measured equivalent widths greater than 70 Å, and satisfying the other criteria of , and peak flux exceeding the level at wavelength longward of 7050Å). In other words, this cutoff selects objects having more than 60% of their total counts recorded in only one to three adjacent TTF frames, i.e. those faint objects most likely to possess the strongest emission lines. The counts measured in each TTF frame for these objects are shown in Figure 13. The emission-line strengths implied for these nine objects translate to star-formation rates of typically 10M⊙yr-1 and higher, peaking in the wavelength range 7061–7087 Å.
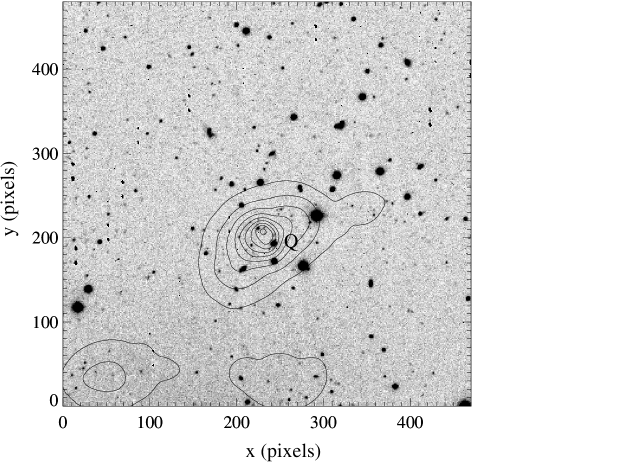
Figure 14 shows the location of the strongest TTF emission-line candidates (circled) superimposed on the coadded TTF image. Most lie in a group about 200–700 kpc to the west of the quasar. Three additional objects with equivalent widths Å lie nearby, and are also marked in Figure 14 (squares). The group of strong TTF candidates is also identified on the broad -band image (note the smaller field of view) in Figure 15. With the exception of the quasar extended line emission, all candidates in this region are clearly identified with galaxies visible on the -band image.
The tightest grouping of 5 ELG candidates contains objects peaking slightly blueward but close to the quasar redshift, in the 7063–7073Å range. Figure 10 clearly shows that these wavelengths are well sampled across the field, and so the clustering of objects is likely to be real rather than merely an artifact of the wavelength coverage. The wavelength gradient across the field will, however, restrict the sampling of objects to the red of the quasar in the northern third of the field only, although only one such object was found in the southern part of the field.
3.5. Spectroscopy of selected objects
In a weather-affected observing run, we managed to obtain spectra for 12 galaxies within of the quasar, including five TTF ELG candidates from the list above with estimated Å. Figure 16 identifies the spectroscopic targets (labelled to ; bright star lies to the south of the region shown; two objects were observed in slit , and are denoted by and ). The results are summarised in Table 3. Spectra of five objects, including those with emission lines at and a lower redshift example, are shown in Figure 17.
Of the five ELG candidates targetted, [O ii] at was detected clearly in three (objects in Figure 16). The spectrum of object is consistent with weak [O ii] emission at , but noise makes the line identification uncertain. The fifth candidate yielded a lower redshift identification (object showed strong [O iii] and H at outside the TTF window), and hence its detection by TTF was spurious. In the three spectra with clear [O ii] detections, continuum emission is present blueward of 4000Å (rest), consistent with star-formation as the source of the [O ii] emission (and ruling out Ly emission at higher redshift, where a continuum break due to absorption blueward of the line would have been expected). The [O ii] equivalent widths estimated from the TTF magnitudes agree well with those measured in two cases where the continuum magnitude is well determined: for objects and TTF estimates Å and 160Å and the spectra give Å and Å respectively (in the observed frame). For the fainter object, , the spectroscopic equivalent width, Å, is smaller than the estimation based on TTF magnitudes, Å (which assumed the continuum lies at the magnitude limit ). However, this is still within the expected photometric uncertainties in the TTF data (factors of 2–6 at –23). As object was essentially observed serendipitously, falling right on the edge of mini-slit , it is almost certainly affected by slit losses. These losses could affect the line-to-continuum ratio in an extended object if the star-formation is patchy and/or highly nucleated. For all three identified [O ii]-emitters the spectroscopic and TTF peak wavelengths agree to within 3–13Å (i.e. one to two TTF bins), as expected.
Of the remaining multi-object spectroscopic targets (chosen more-or-less at random), galaxies and showed strong emission lines at lower redshifts (outside the TTF window), and the remaining objects () lacked identifiable emission or absorption features in their noisy spectra. Object is one of the reddest objects in the field () and so is a candidate for a passively-evolving elliptical galaxy at . However, its spectrum was too noisy to confirm a redshift and further observations are being sought.
For the quasar itself, the equivalent width of the [O ii] emission estimated by TTF was 19Å (observed frame, in 36 diameter circular aperture). This compares with =Å measured in a recent longslit spectroscopic observation using a 15 wide slit (de Silva et al., in preparation). Because of the presence of strong extended line emission close to the quasar nucleus (Å), it is not surprising that the equivalent width measured in the larger TTF aperture is somewhat higher.

4. Clustering of red galaxies
4.1. Optical
Because the and filters were chosen to straddle the redshifted 4000 Å spectral break at , we expect objects with the reddest colours to include passively-evolving galaxies at . To illustrate this, Figure 18 shows the filter transmission curves with a typical spectrum of an elliptical galaxy which has evolved passively for about 3 Gyrs overplotted. An overdensity of these red galaxies might signify a cluster, as passive evolution is characteristic of ellipticals in dense cluster cores. Indeed, Figures 15 and 19 show an overdensity of galaxies with in the field, centred near the quasar. Figure 20 shows the surface density of faint, red galaxies ( and ) as a function of distance from the quasar. The red galaxies peak strongly close to the quasar, enhanced relative to the surrounding density by a factor of order five within an arcminute radius of the quasar.
Also shown in Figure 20 is the surface density of faint galaxies with average colours (namely , and ) as a function of radial distance from the quasar. The distribution of colours for all galaxies in the field of MRC B0450–221 is shown in Figure 21. The broad range of colours is comparable with that found in other field surveys (e.g. Hammer et al. 1997). In contrast to the distribution for red galaxies, the surface density of blue galaxies remains approximately constant across the field, apart from a slight excess from the quasar and a deficit of blue galaxies within of the quasar itself. Within this typical colour range, the strongest TTF candidates (Å, shaded in Figure 21) span a fairly small range, –1.1, about two magnitudes bluer than the red galaxy excess described above.
The colours of the red galaxies are consistent with those predicted by spectral synthesis models (such as the PEGASE models of Fioc & Rocca-Volmerange 1997) for elliptical galaxies at , namely, those which have been evolving passively (SFR M⊙yr-1) for Gyr or more, following a 1-Gyr duration burst of star formation, and including a modest amount of reddening (). We note that the magnitude is very sensitive to any ongoing star formation, and so some spread of would be expected even for coeval galaxies. Spectroscopy with 8-m class telescopes will ultimately be needed to probe the star-formation histories of individual galaxies in more detail.


4.2. Infrared
The near infrared images probe the region of the red galaxy excess near the quasar, and many of the reddest objects are detected in the infrared (see Figure 1). Figure 22 shows a plot of radial surface density of the 28 infrared objects with as a function of distance from the quasar. There is an obvious excess of objects within about of the quasar (17/28 objects, or 12 arcmin-2), which is consistent with a moderate richness cluster even though small number statistics limit its formal significance. For the same magnitude range, the -band counts of McCracken et al. (2000) imply that the expected number density of objects in a random field is only about 4 arcmin-2. This number assumes 50% completeness in the range , which is where the counts per unit magnitude in the MRC B0450 field start to turn over (if no correction was made the field density would increase to only 5 arcmin-2). The scale, , of this excess of infrared galaxies in our single field is the same as that found on average by Hall & Green (1998) in their combined data for many quasar fields at –2.
Figure 23 shows the distribution of colours for the galaxies in the MRC B0450–221 infrared frame with . As excess of objects is obvious, notably a spike of objects with . As shown in Figure 6 of McCracken et al. (2000), the colours of non-evolving galaxies are fairly insensitive to any ongoing starformation and increase smoothly with redshift out to . At they would indeed be expected to have colours of . For models including some recent star-formation, colours as blue as would be expected for galaxies at , and this overall range of colours agrees well with the colours of the galaxy excess in Figure 23. The equivalent distribution expected for randomly-selected field galaxies has been approximated in Figure 23 by a Gaussian (Thompson et al. 1999), with mean (assuming on average, Liu et al. 2000) and FWHM 2.4 mags. The Gaussian distribution was scaled using the -band counts of McCracken et al. (2000), whose distribution, incidentally, is also consistent with this parameterisation. Looking now at the density of objects with the most extreme red colours, we see 4 objects with in Figure 23, three of which have . For comparison, field surveys (McCracken et al. 2000) find about objects arcmin-2 with and , whereas we see arcmin-2 around MRC B0450–221.
Similarly, a histogram of colours is presented in Figure 24. The Gaussian comparison distribution of colours for an infrared-selected field sample with –19.5 was taken from Saracco et al. (1999), and has mean and FWHM 0.9 mags. Again, an excess of galaxies is indicated, including very red ones with –2.4 and a spike at . This spike is only seen for objects with , where 9/16 objects have , and is not obvious for objects with . These colours are again typical of passively-evolving ellipticals at (Pozzetti & Mannucci 2000).


5. Discussion
The optical and infrared imaging data themselves provide strong evidence that the quasar MRC B0450–221 lies in a cluster at , as marked by an excess of red galaxies within an arcminute of the quasar with colours (, , ) expected for cluster ellipticals at . At this redshift, the red galaxy overdensity has dimensions of a few hundred kpc in diameter, which is typical of a cluster core. Similar arguments for excesses of red galaxies have been used to identify a number of clusters now at high redshift, including some around AGN (Stanford et al. 1997; Hall & Green 1998).
The TTF observations provide another insight into the star-formation properties of this high-redshift system. With TTF, we effectively surveyed a volume of 420 Mpc3 around MRC B0450–221 for emission-line objects, finding initially nine candidates with inferred star-formation rates exceeding about 10 M⊙yr-1. We note that despite their high star-formation rates, these detections include objects with extremely faint continuum levels, and , which would have been missed by all but the deepest broad-band and spectroscopic surveys. At least three have been confirmed unequivocally by follow-up spectroscopy to be line-emitting galaxies at .


To establish whether the number of detections is as expected, we must address the completeness of the TTF survey. To do this we consider (i) statistical incompleteness in the detection of faint objects (4/9 candidates have average magnitudes below the completeness limit of , suggesting that others were missed), (ii) contamination from low-redshift interlopers and (iii) spurious detections. The following arguments illustrate the relative importance of these factors, although ultimately they are subject to large uncertainties being based on data for a single field.
In Figure 7, some 36 objects lie in the range –21.5 (the bin just brighter than the completeness limit for the co-added TTF dataset), whereas only nine lie in the next bin –22.0. The slope of the cumulative counts per half-magnitude bin is approximately 1.25 up to the completeness limit, , so it follows that of order 44 objects would have been expected in the magnitude range –22.0. Therefore, we estimate that as many as 80% of objects may remain unidentified in this range. Of the ELG candidates themselves, 4/9 were below the completeness limit, suggesting that (if the same ratio holds) similar line emitters might have been missed by the detection algorithm. Therefore, including the brighter ones, our total number of nine ELG candidates may be incomplete by 50–70% due to missing faint candidates. Deeper observations should pick these up in future.
In the wavelength window targetted by TTF, emission lines from lower-redshift galaxies, such as [O iii] and H , are also expected to be picked up. The strongest expected line is H which would be detectable at ; the TTF survey samples a volume of only 37 Mpc3 at . At , a line with the same flux as a 10 M⊙yr-1 [O ii]-emitter at would have a luminosity of about 100 times less, and the H line is also typically 2–5 times stronger than [O ii] in starforming galaxies (Kennicutt 1992). Therefore, we would need to integrate contributions from H -emitters down to M⊙yr-1 at to compare with the strongest [O ii]-emitters (M⊙yr-1) at . As the typical space density of galaxies with 0.1–5 M⊙yr-1 is approximately constant per logarithmic interval of 0.3 in star-formation rate, at about Mpc-3 (Cowie et al. 1997) and falls off sharply above 5 M⊙yr-1, the contribution from H -emitters to our data is expected to be small, a rate of only –1 object on average in the volume sampled. The number of expected [O iii] emitters is harder to estimate because [O iii] strength is only poorly correlated with star-formation rate. However, assuming [O iii]5007 is similar to [O ii] in strength, –2 objects are expected in the 240 Mpc3 volume sampled at . Similarly, another 0.5–1 [O iii]4959-emitters and 0.5–1 H -emitters might be detected at . Contamination by low-redshift objects on the basis of lines much weaker than [O ii] is negligible, as only the strongest star-forming galaxies (M⊙yr-1) could contribute and their space densities are insignificant at (according to the data of Cowie et al. 1997). Therefore, in total, only about 3–5 low-redshift field interlopers would be expected in a field of this area, although these estimates are very sensitive to the assumed line strengths relative to [O ii] and large uncertainties (at least a factor of two) in the Cowie et al. data. The number of expected interlopers in the TTF dataset, however, will be lower than this because of the restricted magnitude range of our detections, , and incompleteness. So, reducing the number by a conservative factor of two, we realistically expect only of order one or two objects (or less) to be low-redshift detections based on lines other than [O ii].
Regarding spurious detections, the multi-slit spectroscopy shows that at least one candidate is spurious (maybe two if we include object ) and therefore, by extrapolation, we can estimate that roughly 20–40% of the TTF detections may also be spurious.
Cowie et al. (1997) find an average space density of galaxies with star-formation rates greater than 10 M⊙yr-1 of Mpc-3 at (based on 27 galaxies, so an uncertainty of about 20%). This translates to an expected number of 0.3 line-emitting field galaxies in the TTF field, which is again probably an overestimate at as there are essentially no objects with lines this strong in the bins. Already, the three spectroscopically confirmed [O ii]-emitters themselves suggest that we are seeing ELGs in numbers greater than expected in the average field, and the significance of this excess will only increase as other candidates are confirmed. We note that the methods of selection () and estimation of SFR (luminosity at 2500Å) used in the Cowie et al. redshift survey differ from our study. Although, Cowie et al. claim their continuum-based SFRs are consistent with measured [O ii] strengths.
As shown in Figure 14, the ELGs with the largest equivalent widths (including spectroscopically-confirmed galaxies and possible detection ) cluster spatially, most lying in a group which is offset to the west of the quasar by 200–700 kpc. This distance is similar to the characteristic radius in low-redshift clusters where the blue star-forming galaxy population begins to dominate the outer regions (Balogh et al. 1997; Morris et al. 1998). The line strengths and equivalent widths (restframe equivalent widths from a few Å to 140Å and inferred star formation rates of 1–40 M⊙yr-1) of the ELGs are consistent with other observations of field galaxies at redshift (Cowie et al. 1997; Hammer et al. 1997).
Altogether, the environment of MRC B0450–221 is consistent with a moderately-rich cluster at , plus a peripheral group of gas-rich galaxies being accreted from the surrounding overdense field. The characteristics of the system are reminiscent of other examples of merging clusters, including the red galaxy distribution being somewhat elongated (similar to the ROSAT-detected cluster RX J1716.6+6708; Henry et al. 1997; Clowe et al. 1998), and the presence of an offset group of strongly star-forming galaxies (e.g. also a feature of the low-redshift cluster containing the powerful radio source Cyg A; Owen et al. 1997). It is interesting to note that the system as a whole appears to be elongated in roughly the same direction as the quasar radio axis; observations of more fields will allow us to test whether this is coincidental or a feature of quasar environments. With few spectroscopic redshifts available, the velocity dispersion of the MRC B0450–221 system is not constrained by the current data; velocity dispersions of km s-1 are seen typically in comparable systems such as low-redshift Abell Class O-I clusters (Dressler & Shectman 1988; Zabludoff et al. 1993; Bower et al. 1997) and clusters around some other AGN (e.g. Deltorn et al. 1997; Thimm et al. 1994).
Clusters around AGN such as MRC B0450–221 add to the growing number of distant clusters known, and offer the same opportunities for follow-up study. In this case, further spectroscopic observations are clearly needed to confirm the redshifts of other potential cluster members (including the red galaxies) and probe the velocity dispersion of the system, perhaps yielding further evidence for merging. Diffuse X-ray emission should be detectable from hot intracluster gas — quasar MRC B0450–221 was detected in the ROSAT All Sky Survey (Brinkmann, Seibert & Boller 1994; Baker, Hunstead & Brinkmann 1995) but deeper X-ray observations are required to disentangle the pointlike AGN and diffuse cluster components. More detailed radio mapping of MRC B0450–221 may yield further evidence for interactions of the radio plasma with the cluster environment. By targetting the environments of a large sample of AGN, we will be able to study in detail a range of cluster environments at .
6. Conclusions
We have carried out a detailed study of the field of the quasar MRC B0450221 using narrow- and broad-band imaging and spectroscopy. The main conclusions are:
(i) The quasar clearly lies at the centre of an overdensity of red galaxies, with colours consistent with passively-evolving galaxies at .
(ii) Tunable filter imaging finds a number of ELG candidates with and equivalent widths exceeding 70Å. Three have been confirmed spectroscopically to lie at .
(iii) The number of emission-line objects associated with the quasar is considerably greater than expected from the average space density of star-forming field galaxies at .
(iv) The line-emitting galaxies have equivalent widths and inferred star-formation rates comparable with those of field galaxies at .
(v) The strongest line emitting galaxies, including those confirmed spectroscopically, are located primarily in a small group several hundred kpc to the west of the quasar.
(vi) Together, these data suggest the quasar resides near the centre of a cluster which is accreting gas-rich galaxies from its environs.
Observations of more quasar fields are underway to identify and study the properties of high-redshift clusters and investigate their relationship with quasar activity.
References
- (1) Baker J.C., Hunstead R.W., Brinkmann, W., 1995, MNRAS, 277, 553
- (2) Balogh M.L., Morris S.L., Yee H.K.C., Carlberg R.G., Ellingson E., 1997, ApJ, 488, L75
- (3) Balogh M.L., Schade D., Morris S.L., Yee H.K.C., Carlberg R.G., Ellingson E., 1998, ApJ, 504, L75
- (4) Best P.N., Longair M.S., Röttgering H.J.A., 1998, MNRAS, 295, 549
- (5) Bland-Hawthorn J., Jones D.H., 1997, PASA, 15, 44
- (6) Bland-Hawthorn J., Jones D.H., 1998, In Optical Astronomical Instrumentation, Kona, Hawaii, Proc. SPIE, Vol. 3355, p855
- (7) Bower R.G., Castander F.J., Couch W.J., Ellis R.S., Böhringer H., 1997, MNRAS, 291, 353
- (8) Bremer M.N., Baker J.C., 1999, in ‘The Most Distant Radio Galaxies’, eds H.J.A. Röttgering, P.N. Best, M.D. Lehnert, p425
- (9) Bremer M.N., Baker J.C., Lehnert M., 2001, in preparation
- (10) Brinkmann W., Seibert J., Boller Th, 1994, A&A, 281, 355
- (11) Butcher H., Oemler A.Jr, 1984, ApJ, 285, 426
- (12) Clowe D., Luppino G.A., Kaiser N., Gioia I.M., 1998, ApJ, 497, L61
- (13) Connolly A.J., Szalay A.S., Dickinson M., Subbarao M.U., Brunner R.J., 1997, ApJL, 486, L11
- (14) Cowie L.L., Hu E., Songaila A., Egami E., 1997, ApJ, 481, L9
- (15) Cowie L.L., Songaila A., Barger A., 1999, AJ, 118, 603
- (16) Cowie L.L., Songaila A., Hu E.M., Cohen J.G., 1996, AJ, 112, 839
- (17) Deltorn J.-M., Le Fevre O., Crampton D., Dickinson M., 1997, ApJ, 483, 21
- (18) Dressler A., Shectman S.A., 1988, AJ, 95, 985
- (19) Dressler A., Gunn J.E., 1992, ApJS, 78, 1
- (20) Eales S.A., 1985, MNRAS, 213, 899
- (21) Ellingson E., Yee H.K.C., Green R.F., 1991, ApJ, 371, 49
- (22) Ellis R.S., Colless M., Broadhurst T., Heyl J., Glazebrook K., 1996, MNRAS, 280, 235
- (23) Elston R., Rieke G.H., Rieke M., 1988, ApJ, 331, L77
- (24) Fioc M., Rocca-Volmerange B., 1997, A&A, 326, 950
- (25) Gallagher J.S., Bushouse H., Hunter D.A., 1989, AJ, 97, 700
- (26) Gaskell C.M., 1982, ApJ, 263, 79
- (27) Hall P.B., Green R.F., 1998, ApJ, 507, 558
- (28) Hall P.B., Green R.F., Cohen M., 1998, ApJS, 119, 1
- (29) Hammer F. Flores H., Lilly S.J., Crampton D., Le Fevre O., Rola C., Mallen-Ornelas G., Schade D., Tresse L., 1997, ApJ, 491, 477
- (30) Henry J.P. et al., 1997, AJ, 114, 1293
- (31) Hill G.J., Lilly S.J., 1991, ApJ, 367, 1
- (32) Hoessel J.G., Gunn J.E., Thuan T.X., 1980, ApJ 241, 486
- (33) Hu E., Cowie L., McMahon R., 1998, ApJL, 502, L99
- (34) Hu E., McMahon R., Cowie L., 1999, ApJL, 522, L9
- (35) Hunstead R.W., Murdoch H.S., Shobbrook R.R., 1978, MNRAS, 185, 149
- (36) Hutchings J.B., 1995, AJ, 109, 928
- (37) Hutchings J.B., Crampton D., Persram D., 1993, AJ, 106, 1324
- (38) Jenkins A. et al., 1998, ApJ, 499, 20
- (39) Kapahi V.K., Athreya R.M., Subrahmanya C.R., Baker J.C., Hunstead R.W., McCarthy P.J., van Breugel W., 1998, ApJS, 118, 327
- (40) Kennicutt R.C., 1992, ApJ, 388, 310
- (41) Kennicutt R.C., 1998, ARAA, 36, 189
- (42) Lilly S.J., Le Fevre O., Hammer F., Crampton D., 1996, ApJL, 460, L1
- (43) Liu M.C., Dey A., Graham J.R., Bundy K.A., Steidel C.C., Adelberger K., Dickinson M.E., 2000, AJ, 119, 2556
- (44) Madau P., Ferguson H.C., Dickinson M.E., Giavalisco M., Steidel C.C., Fruchter A., 1996, MNRAS, 283, 1388
- (45) Madau P., Pozzetti L., Dickinson M.E., 1998, ApJ, 498, 106
- (46) Martini P., Osmer P.S., 1998, AJ, 116, 2513
- (47) McCarthy P.J., Persson S.E., West S.C., 1992, ApJ, 386, 52
- (48) McCarthy P.J., van Breugel W.., Kapahi V.K., 1991, ApJ, 371, 478
- (49) McCracken H.J., Metcalfe N., Shanks T., Campos A., Gardner J.P., Fong R., 2000, MNRAS, 311, 707
- (50) Morris S.L., Hutchings J.B., Carlberg R.G., Yee H.K.C., Ellingson E., Balogh M.L., Abraham R.G., Smecker-Hane T., 1998, ApJ, 507, 84
- (51) Owen F.N., Ledlow M.J., Morrison G.E., Hill J.M., 1997, ApJ, 488, L15
- (52) Pozzetti L., Mannucci F., 2000, MNRAS, 317, L17
- (53) Rakos K.D., Schombert J.M., 1995, ApJ, 439, 47
- (54) Saracco P., D’Odorico S., Moorwood A., Buzzoni A., Cuby J.-G., Lidman C., 1999, A&A, 349, 751
- (55) Schlegel D.J., Finkbeiner D.P., Davis M., 1998, ApJ, 500, 525
- (56) Smail I., Edge A.C., Ellis R.S., Blandford R.D., 1998, MNRAS, 293, 144
- (57) Snellen I.A.G., Bremer M.N., Schilizzi R.T., Miley G.K., van Ojik R., 1996, MNRAS, 279, 1294
- (58) Stanford S.A., Elston R., Eisenhardt P.R., Spinrad H., Stern D., Dey A., 1997, AJ, 114, 2232
- (59) Thimm G.J., Röser H.-J., Hippelein H., Meisenheimer K., 1994, A&A, 285, 785
- (60) Thompson et al., 1999, AJ, 523, 100
- (61) Tytler D., Fan X.-M., 1992, ApJS, 79, 1
- (62) Valdes F., 1993, FOCAS User’s Guide, NOAO
- (63) Yee H.K.C, Green R.F, 1987, ApJ, 319, 28
- (64) Zabludoff A.I., Geller M.J., Huchra J.P., Vogeley M.S., 1993, AJ, 106, 1273
| 67 | 11 | 21.8 | 20.6 | 19.5 | 18.3 | 1.2 | 2.3 |
|---|---|---|---|---|---|---|---|
| 58 | 9 | 23.9 | 22.0 | 20.6 | 18.7 | 1.9 | 3.3 |
| 55 | -10 | 21.1 | 19.6 | 18.4 | 17.7 | 1.5 | 1.9 |
| 50 | 44 | 23.0 | 21.9 | 21.4 | 19.3 | 1.1 | 2.6 |
| 47 | 9 | (24.8) | 22.8 | 21.0 | 18.7 | (2.0) | 4.1 |
| 45 | -25 | 24.6 | 21.9 | 19.7 | 18.3 | 2.7 | 3.6 |
| 45 | 53 | 22.5 | 21.4 | 20.5 | 18.8 | 1.1 | 2.6 |
| 41 | -11 | 24.6 | 22.8 | 20.6 | 19.1 | 1.8 | 3.7 |
| 35 | -53 | 24.2 | 21.5 | 20.0 | 19.2 | 2.7 | 2.3 |
| 31 | -40 | 22.4 | 20.8 | 19.8 | 18.0 | 1.6 | 2.8 |
| 30 | -42 | (24.8) | 23.2 | 21.1 | 19.3 | (1.6) | 3.9 |
| 28 | 4 | 24.4 | 22.0 | 19.9 | 18.2 | 2.4 | 3.8 |
| 27 | -16 | (24.8) | (23.5) | 21.4 | 18.6 | 1.3 | 4.9 |
| 25 | 44 | 23.1 | 21.6 | 20.1 | 18.4 | 2.1 | 3.2 |
| 24 | -7 | (24.8) | 22.9 | 21.1 | 19.0 | 1.9 | 3.9 |
| 19 | -2 | 23.2 | 21.7 | 20.4 | 18.7 | 1.5 | 3.0 |
| 8 | -59 | 23.5 | 22.0 | 21.2 | 20.5 | 1.5 | 1.5 |
| 8 | 12 | (24.8) | 22.4 | 21.1 | 19.6 | 2.4 | 2.8 |
| 8 | 9 | (24.8) | 23.1 | 21.2 | 18.9 | 1.7 | 4.2 |
| 4 | -5 | 24.7 | 22.7 | 20.4 | 18.9 | 2.0 | 3.8 |
| 0 | 7 | (24.8) | 22.2 | 20.6 | 19.3 | 2.6 | 2.9 |
| -3 | 24 | (24.8) | 22.9 | 20.7 | 19.0 | 1.9 | 3.9 |
| -5 | 28 | 24.0 | 22.0 | 21.3 | 20.1 | 2.0 | 1.9 |
| -8 | 39 | (24.8) | (23.5) | 21.6 | 19.5 | 1.3 | (4.0) |
| -14 | 23 | 23.9 | 22.4 | 21.6 | 19.4 | 1.5 | 3.0 |
| -17 | -38 | 22.4 | 21.3 | 20.2 | 18.7 | 1.1 | 2.6 |
| -21 | 44 | 21.0 | 19.7 | 18.9 | 18.8 | 1.3 | 0.9 |
| -26 | 30 | (24.8) | 22.7 | 20.8 | 21.5 | 2.1 | 1.2 |
| -28 | -22 | … | 21.8 | 19.0 | 17.9 | … | 3.9 |
| -29 | 12 | … | 22.3 | 21.6 | 19.2 | … | 3.1 |
| -29 | 18 | … | … | 19.3 | 17.7 | … | … |
| -30 | 5 | 24.5 | 23.1 | 21.6 | 19.2 | 1.4 | 3.9 |
| -35 | 1 | 23.9 | 21.8 | 20.2 | 18.4 | 2.1 | 3.4 |
Columns—
(RA), (Dec):
position relative to quasar (arcseconds).
magnitudes:
objects below detection threshhold (limits)
appear in parentheses; three objects
close to bright star
could not be measured in some bands.
| Order-blocking filter | 7067/260 Å |
|---|---|
| Observed wavelength () | 7075 Å |
| Etalon plate spacing () | 9.6 m |
| Order of interference () | 27 |
| Free Spectral Range () | 373.8 units |
| Bandpass () | 12.5 units |
| Conversion factor (d/d) | 1.43 |
| Free Spectral Range () | 261.5 Å |
| Bandpass () | 8.7 Å |
| Effective bandpass () | 13.7 Å |
| Resolving power () | 809 |
| Effective finesse () | 30 |
Note — parameters are given in terms of either wavelength (Å) or arbitrary instrumental units () for the Fabry-Perot etalon settings. Standard definitions are used, as summarised for TTF by Jones & Bland-Hawthorn 1997, 1998 and also Jones, Shopbell & Bland-Hawthorn, in preparation.
| object | TTF | TTF | TTF | TTF | TTF | spec | spec | spec | Comments | |
| cont | line | sigma | line | EW | line | EW | ||||
| mag | mag | mag | (Å) | (Å) | (Å) | (Å) | ||||
| (1) | (2) | (3) | (4) | (5) | (6) | (7) | (8) | (9) | (10) | |
| 21.02 | 20.57 | 1.2 | 3 | … | … | … | … | 0.143 | H , [N ii], [S ii] | |
| 21.43 | 20.59 | 1.0 | 3 | … | … | … | … | 0.449 | [O iii], H | |
| 21.42 | 20.56 | 1.6 | 3 | … | … | … | … | ? | ||
| 21.44 | 20.83 | 3.0 | 3 | … | … | … | … | ? | red galaxy | |
| 20.46 | 19.97 | 1.9 | 3 | … | … | … | … | 0.663 | [O iii], H | |
| 21.92 | 20.53 | 1.1 | 3 | 7084 | 128 | 7076 | 0.899 | [O ii] | ||
| 21.15 | 20.52 | 0.9 | 3 | … | … | … | … | ? | ||
| 22.00 | 20.42 | 0.8 | 4 | 7077 | 110 | … | … | 0.351 | [O iii], H | |
| (22.40) | 20.12 | 0.7 | 5 | 7070 | (162) | 7066 | 0.896 | [O ii] | ||
| 21.78 | 20.18 | 1.1 | 5 | 7073 | 163 | 7086 | 0.901 | [O ii] | ||
| (22.40) | 20.54 | 0.9 | 3 | 7069 | (116) | 7057 | 0.894 | [O ii]? | ||
| 21.71 | 20.89 | 1.8 | 3 | … | … | … | … | ? |
Columns— (2) & (3) Estimated magnitudes from TTF data for continuum level and line peak (objects near mag limits are shown in parentheses); (4) broad-band colour; (5) significance of TTF peak detection above rms noise; (6) & (7) central wavelength and observed equivalent width of TTF line detection (uncertainties 7Å and about 50% respectively; parentheses indicate uncertain continuum mag); (8) & (9) measured wavelength and equivalent width of line from spectroscopy; (10) spectroscopic redshift.