Optical/Infrared Survey of Galaxy Clusters
*
Abstract
In this contribution the ongoing effort to build a statistical sample of clusters of galaxies over a wide range of redshifts to study the evolution of clusters and member galaxies is reviewed. The starting point for this project has been the list of candidate clusters identified from the -band EIS-WIDE survey data. Since the completion of this survey, new optical/infrared observations have become available and have been used to confirm some of these candidates using the photometric data alone or in combination with the results of follow-up spectroscopic observations. Our preliminary results show that the yield of real physical associations from the original catalog is conservatively and that a large sample of clusters in the southern hemisphere, extending to high-redshifts, is within reach.
1 Introduction
Clusters of galaxies have always been objects of great interest for studies of the origin and evolution of structures. They represent the most massive virialized systems, being formed at the tail of the mass distribution function. Their abundance is critically dependent on the cosmological parameters and they offer a unique opportunity to study the evolution of galaxies and the role of environmental effects. Furthermore, there is currently unambiguous evidence for the existence of massive clusters at much larger redshifts than originally anticipated, thus providing a large time baseline for evolutionary studies.
Unfortunately, current samples at high-redshifts (), consisting primarily of X-ray selected systems, are still small and are predominantly located in the northern hemisphere and thus inaccessible to VLT. The primary goals of the present effort are to: define a statistical sample of clusters of galaxies over a broad range of redshifts in the southern hemisphere; study their dynamics and measure their mass; and to study the properties of the member galaxies. Carrying out such a study as a function of the look-back time should provide both constraints on cosmological parameters and greater insight into the formation and evolution of structures in the universe.
The present work is based on a list of over 300 optically-selected cluster candidates identified by applying the matched-filter algorithm to the -band data of the EIS-WIDE survey, covering 17 square degrees of the southern sky [1],[2],[3]. While the deficiencies of an optically-selected sample are well-known, there are also a number of potential advantages. First, such samples are an important complement to X-ray selected samples which are likely to select preferentially massive, virialized systems. Second, comparison between X-ray and optical/infrared selected samples is of great interest as it may provide information on the evolution of the intra-cluster gas. Third, the sample of candidate clusters can grow in size at a modest cost.
Though a necessary first step, having a sample of cluster candidates identified in a single passband falls short of what is required for an efficient follow-up spectroscopic program. For that it is necessary to have both an understanding of the survey yield, requiring the confirmation of a significant number of candidates, and additional data to enable the selection of candidate cluster galaxies. For this purpose, we have for the past two years gathered multi-color data to obtain supporting evidence for the reality of the cluster candidates, measure the yield of real systems as well as to prune the sample of false positives and identify candidate cluster members, based on color or photometric redshifts, to serve as targets for spectroscopic observations.
In this paper we present some preliminary results that have been obtained from ongoing follow-up imaging (Section 2) and spectroscopic observations (Section 3). Our future plans are summarized in Section 4.
2 Multi-color and Deep Imaging Data
To provide additional leverage to the confirmation of the cluster candidates extracted from the -band survey, data taken in different passbands have been combined. These data have been compiled from publicly available EIS data or from pointed observations conducted by our group. An important data set is that provided by the Pilot Survey conducted by the EIS project using the wide-field imager (WFI) on the MPG/ESO 2.2m telescope. This survey was conducted in and passbands and covers over 14 square degrees of the region originally surveyed by the NTT -band survey. In addition, observations have been conducted in the -band using the Danish 1.5m telescope at La Silla and in the infrared and passbands using SOFI at the NTT. Currently, the available data for the candidate EIS clusters consists of: 310 cluster candidates drawn from the -band survey; 163 candidates with ; 75 candidates with ; and over 35 candidates with . Different combination of these data have been used to identify early-type red-sequences, to estimate photometric redshifts, and to select targets for spectroscopic observations of cluster candidates at different redshifts.
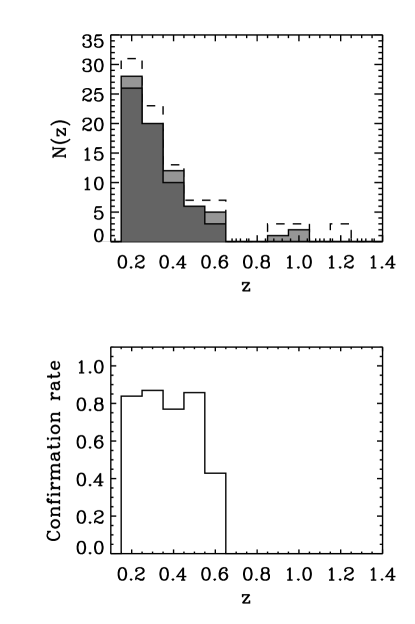
The matched-filter algorithm has been applied to a sub-sample of the Pilot Survey -band data and the identified clusters have been compared to the -band detections [4]. By considering the number of successful matches between these two samples we estimate the fraction of real systems to be 60% out to , increasing to 80% at lower redshifts. Another way of confirming the cluster candidates is to combine the data to explore the color properties of the galaxies. For instance, low-redshift candidates exhibit a well-defined red-sequence in the color-magnitude diagram, a clear indication of a concentration of red-objects. For more distant clusters, however, the detection of a red-sequence requires a search for significant concentrations in the projected distribution of galaxies split in color bins. These results are summarized in Figure 1 which shows the redshift distribution of candidates identified by the matched-filter technique, those identified in both the and catalogs, and those identified by the detection of a red-sequence. Note that both methods yield consistent results. The usefulness of data is limited to systems with . For high-redshift candidates a similar approach has been used for candidates having data. Out of 11 candidates analyzed so far, nine are consistent with them being at when compared with the colors of early-type galaxies in clusters spectroscopically confirmed at high-redshifts.
For low-redshift clusters () the matched-filter method has been complemented by an independent search technique based on the color information. We use the available data to classify early-type galaxies in different redshift intervals. This was done by adopting a model for galaxy evolution and by selecting galaxies in the region of the color space likely to be occupied by early-type galaxies in a given redshift interval. The projected distribution of the resulting sample of early-type galaxies was then used to identify significant concentrations. The main advantages of the method are that it uses the color properties of galaxies, minimizes the effects of foreground/background contamination and candidate cluster members can be identified. While largely independent of the matched-filter, since no assumptions are made about the cluster profile and luminosity function, the majority of the candidate clusters are in common with those identified by the matched-filter.
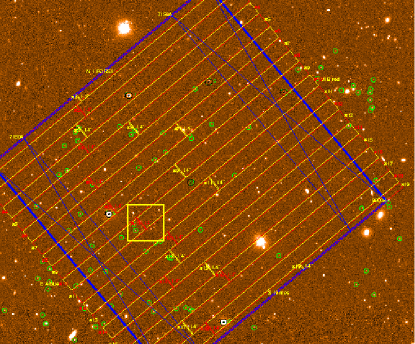
Finally, for candidates with more than four passbands ( and ) photometric redshifts have been estimated. The galaxy sample was then split into photometric redshift bins and a search was conducted to confirm the existence of a concentration at the expected location of the cluster. Galaxies in the redshift interval of the candidate cluster were selected and have been used as targets in follow-up spectroscopic observations of the high-redshift clusters, as discussed below. This is essential in order to increase the efficiency of the spectroscopic observations, especially in the case of spectrographs such as FORS1 with a large field of view compared to the size of the core of the cluster. Figure 2 shows one of the masks utilized in the observation of a distant cluster. The main galaxy concentration is indicated by the square shown in the figure. As can be seen, for distant clusters many different masks must be used to properly sampled the cluster core. Furthermore, in order to sample the outskirts of the cluster it must be possible to select galaxies with different SEDs with redshifts comparable to that estimated for the candidate cluster in order to minimize foreground/background contamination.
Recently we have also used FORS to obtain a deep -band image of one high-redshift candidate cluster under excellent seeing conditions. A preliminary analysis of the data suggests a significant weak lensing signal nearly coincident with the concentration of galaxies associated with the matched-filter detection. If confirmed, this would be the first detection of weak lensing from an optically-selected cluster and a strong evidence that at least some of the EIS candidate clusters are indeed associated with mass concentrations.
3 Spectroscopy
In addition to photometric observations there are several ongoing programs, targeting different redshift intervals, to confirm the EIS clusters spectroscopically. For systems with , the first attempt, carried out using the 2dF spectrograph [5], provided encouraging results. Despite poor sampling, poor constraints in the selection of the individual targets, and the fact that the observations were conducted under less than ideal conditions, some 22 clusters were tentatively confirmed, representing a yield of . We believe that by using the multi-color data now available it will be possible to greatly improve the sampling of galaxies in clusters leading, perhaps, to enough measurements to allow estimates of the velocity dispersion to be made.
Observations of clusters selected with matched-filter estimated redshifts in the range 0.5-0.7 have also been conducted using the 3.6m telescope at La Silla. Preliminary results have been reported elsewhere [6]. At the time of writing a total of 15 clusters have been observed and eight, out of the 10 reduced, have been assigned redshifts in the range 0.44-0.67. While there are enough measurements per cluster to allow their detection in redshift space, the number of galaxies with measured redshifts is still too small to estimate the velocity dispersion of these systems.
Recently, spectroscopic observations have also been carried out using FORS1 at the VLT. A total of seven candidate systems have already been observed. Preliminary results are encouraging with the four candidates partially analyzed showing a large number of coincident redshifts in good agreement with those estimated by the matched-filter and photometric redshift analyses. However, Figure 2 shows that while FORS is adequate for studying the outer parts and the environment of a confirmed cluster, confirmation and measurement of the cluster velocity dispersion for a large number of distant clusters cannot be efficiently done with it. This will only be possible using the integral field unit (IFU) of the VIMOS spectrograph. Figure 3 shows the core of a cluster at compared to the height of a FORS slit. In the central 1 arcmin2, of the galaxies brighter than (filled circles) have been found to be potential cluster members using the photometric redshift technique. Typical galaxy densities in the core of a cluster candidate are: 25 galaxies arcmin-2 at and 45 galaxies arcmin-2 at . Therefore, using the IFU, with a field of view of , it will be possible to observe over 30 galaxies in a single pointing, thereby enabling us to: 1) densely sample the candidate cluster core, minimizing the effects of interlopers; 2) probe sub-L∗ galaxies; and 3) have a complete spectroscopic sample down to . The IFU thus provide a considerable improvement for measurements of the velocity dispersion and for estimating the virial mass of high-z clusters.

4 Summary
Using multi-color data and preliminary results from ongoing spectroscopic observations we find that a significant number of EIS cluster candidates are real physical associations as determined indirectly from the presence of a concentration of early-type galaxies or directly from measured redshifts. Though based on an admittedly small sample in some redshift ranges, the yield from the original cluster catalog is better than 60%. Some 80 clusters with and 7 with have already been confirmed. This number should rapidly increase as new data are reduced.
Using the above estimate for the yield we expect that it will be possible to construct a sample of confirmed clusters consisting of some 150 clusters with and some 80 with . The upper limit in the cluster redshift for the sample is still poorly determined and must await new spectroscopic observations with the integral field unit of VIMOS. These observations are also essential in order to efficiently study the dynamics of high-redshift clusters.
References
- [1] Olsen, L.F. et al. 1999, A&A, 345, 681
- [2] Olsen, L.F. et al. 1999, A&A, 345, 363
- [3] Scodeggio, M. et al. 1999, A&A Supp., 137, 83
- [4] Olsen, L. F., 2000, PhD Thesis, University of Copenhagen
- [5] Colless, M. & Saglia, R., 1999, private communication
- [6] Ramella et al., 2000, A&A, 360, 861