In search of the oldest star forming regions in Holmberg II
Abstract
We present an X-ray study of the irregular dwarf galaxy Holmberg II based on deep ROSAT PSPC observations. Holmberg II is one of the most famous examples of an irregular dwarf galaxy with a disrupted interstellar medium (ISM): expanding Hi holes are present across the entire face of the galaxy. Huge Hi cavities of kpc extent are found even outside current starforming regions. We search for faint X-ray sources (stellar end points as well as hot gas), touching the limits of the ROSAT PSPC detector and link the newly detected X-ray sources to features detected in other wavelengths. Using an X-ray hardness ratio color-color diagram we show that it is possible to differentiate between thermal plasma and power-law X-ray spectra, which helps to track down the physical nature of the individual sources.
At the X-ray flux limit of the analyzed ROSAT PSPC data, the giant Hi holes appear as devoid of coronal gas. This can be used as a measure for the minimum age of the Hi holes to about – years. Far outside the stellar body and positionally coincident with some Hi holes we find faint, point like X-ray sources which may be associated with low mass X-ray binaries (LMXBs). This old stellar population is undetectable in the optical regime because they are too faint. However, in the X-ray regime they are prominent X-ray sources, well known from Population I objects located within the bulge of the Milky Way and globular clusters. The search for LMXBs might be the key for identifying the earliest stellar population in distant galaxies. In case of Holmberg II their presence indicates that star formation took place across the entire gaseous disk in the past.
Radioastronomisches Institut der Universität Bonn, Auf dem Hügel 71, D-53121 Bonn, Germany
California Institute of Technology, Astronomy Department 105-24, Pasadena, CA 91125, U.S.A.
1. Introduction
Holmberg II (hereafter referred to as Ho II) is one of the most famous examples of a dwarf galaxy with a disrupted neutral ISM as traced by observations of neutral hydrogen (HI, Puche et al. 1992). The distribution its ISM is characterized by Hi holes which are present across the entire face of the galaxy. Huge Hi cavities of kpc extent are found even outside Ho II’s stellar population. Puche et al. (1992) compiled a catalog of individual HI holes: their diameters range between 100 – 2000 pc, the radial velocities indicate that the holes are still expanding. This provides a rough estimate of the ages of the Hi holes of about to years. Since the work done by Puche et al. (1992), Ho II has been studied in many wavelength ranges by a number of authors (radio continuum: Tongue & Westpfahl, 1995; optical: Rhode et al., 1999; FUV: Stewart et al., 2000).
The presence of the Hi cavities is usually linked to the stellar activity within their centers (the “standard picture”): Strong winds of young O– and B–stars create individual bubbles of a few pc size while subsequent supernova events can create cavities of few tens to hundreds of pc extent (e.g., Weaver et al. 1977). Hi observations indicate that in dwarf galaxies the expanding shells and holes can grow older and to much larger sizes compared to massive spiral galaxies. This finding can be attributed to the shallow gravitational potential and the absence of differential rotation in dwarf galaxies (Walter & Brinks 1999).
X-ray observations may serve as a new tool to check the standard picture: the hot–gas interior of the Hi is traced by soft X-emission which is emitted by the plasma (see Sec. 1.1). Harder X-ray emission originating from point sources may indicate old stellar endpoints such as supernova remnants, low and high mass X-ray binaries and pulsars on timescales yrs (this will be discussed in Sec. 1.2). X–ray observations therefore have the power to trace the global star–formation history way further back than it is possible with, e.g., H or FUV observations (Stewart et al. 2000).
1.1. Diffuse X-ray emission
The cooling time of the plasma can be estimated by to be some yrs, assuming a temperature of K and a typical electron density of about (see e.g. Walter et al. 1998 and references therein). In the cases of the largest holes (with radii larger than the one––scale–height of the Hi disk – 300 pc in the case of Ho II) the expanding bubble will break out and the hot gas interior will be vent out to the halo. In the case of the smaller, still confined holes, the interior X–ray emission should be detectable if the Hi column density of the approaching Hi shell does not succeed values of cm-2 (when the soft X–emission of the hot gas is intrinsically absorbed by the shell).
1.2. Individual objects
Pulsars, cooling neutron stars as well as X-ray binaries are stellar end-points and may be observable within the interior of the holes. Their X-ray luminosities range between –, corresponding to an X-ray flux (adopting a distance to Ho II of 3.05 Mpc, Hoessel et al. 1998) of –, which is detectable with the ROSAT PSPC detector in deep pointed observations like the one discussed here.
In this paper we present our analysis of three pointed ROSAT PSPC observations of Ho II. In Sec. 2 we present the data reduction and analysis. Our results are compiled in Sec. 3.
2. ROSAT observations and data analysis
We extracted 3 pointed PSPC observations towards Ho II from the ROSAT archive in Munich. The ROSAT PSPC data were analyzed by us using the EXSAS software package (Zimmermann et al. 1998). All three observations were merged into a single photon event file. The total integration time of the merged ROSAT PSPC data is 22566 sec, making Ho II one of deepest studied dwarf galaxies by ROSAT . The photon events were binned into the standard ROSAT keV (ROSAT C-band), keV (M-band), 1.5 keV (J-band) energy bands and a total energy band, all were corrected for vignetting. Within the area of an individual X-ray source towards HoII (3.5 FWHM PSF), the absorbed X-ray flux of the extragalactic X-ray background (XRB) is about . To evaluate this flux limit we assumed that the extragalactic XRB is only attenuated by the ISM of the Milky Way.
Unfortunately, there is no straight forward way to differentiate between an X-ray source belonging to HoII or an accidental positional coincidence with an XRB source. However, we can reduce this ambiguity by studying a particular X-ray source and searching for counterparts in other wavelengths using supplementary data (which is what we will do in the following, the complete analysis will be presented elsewhere, Kerp et al., 2001, in prep.).
2.1. Detection limits
The absorbed 3- X-ray flux level across the entire ROSAT energy band is . Assuming a distance to Ho II of 3.05 Mpc and a galactic X-ray attenuating column density of about (Hartmann & Burton 1997), we derive a detection luminosity threshold of .
Only very young supernova remnants or X-ray binaries are typical sources with luminosities exceeding this threshold. The presented ROSAT PSPC X-ray data therefore traces only two extreme populations of the star formation in HoII: the actual ( yr, i.e. young supernovae) or the very old population ( yr, pulsars, X-ray binaries). The intermediate star population can be traced via H and far-ultraviolet (FUV) observations (Stewart et al. 2000). Combining all data provides a unique insight on the star formation history of Ho II during the last 100 Myrs.
3. Results
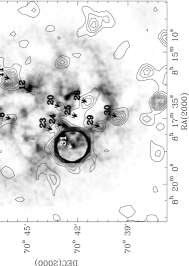
In total we detected 31 significant X-ray sources within the extent of the Hi distribution of HoII. To avoid any confusion with bright extragalactic X-ray background sources, we decided to further study only those 13 X-ray sources which are identified in at least one additional frequency range. The supplementary data give us also a better handle to constrain the nature of the X-ray sources in question. We tried to constrain the X-ray emission process of the 13 sources by studying the spectral properties. Because most of the X-ray sources are rather faint, it is impossible to extract a significant X-ray spectrum from the ROSAT data. To constrain the X-ray spectrum we produced a multi source X-ray hardness ratio color-color diagram, which is described in detail below.
3.1. The X-ray color–color diagram
To identify the emission mechanism of an X-ray source the standard procedure is to extract a spectrum from the ROSAT PSPC data. In case of faint X-ray sources ( ) – which are discussed here – the insufficient signal–to–noise ratio does not allow to apply this standard procedure. However, the count rates within the broad ROSAT energy bands contain significant information on the X-ray source spectrum. We therefore calculate the X-ray hardness ratios to constrain the emission process. In Fig. 2 we plotted the ROSAT hardness-ratio 1 (HR1) () versus the ROSAT hardness-ratio 2 (HR2) (). The hardness ratios depend strongly on the intrinsic source spectrum but also on the amount of X-ray attenuating matter along the line of sight. The stronger the photoelectric absorption the harder the resulting X-ray spectrum. Each individual X-ray spectrum has its own trajectory in this X-ray hardness ratio color-color diagram. This is similar to the change of the stellar color – reddening – of an optical color-color diagram by dust attenuation. In Fig. 2 we plotted trajectories for power-law (solid lines) and thermal plasma spectra (dashed lines) with increasing column density as parameter (from left to right , , and ). The most upper and left trajectory of each hardness ratio trajectory represents the the unabsorbed situation. The labeled trajectories (line with , representing the absorbing foreground column density belonging to the Milky Way) give the spectral slope in case of the power-law spectra (solid lines) and the log([K]) in case of the thermal plasma spectra. Therefore a soft X-ray spectrum source can be found in the lower left part of the X-ray hardness ratio color-color diagram, whereas highly absorbed or hard X-ray sources populate the upper right part of the diagram. The harder the X-ray spectrum, the larger and . All these trajectories, with as parameter, are based on the assumption that the X-ray sources of interest are at least attenuated by the interstellar medium belonging to the Milky Way ().

3.2. X-ray sources with optical or radio counterparts
The X-ray hardness ratio color-color diagram offers a very sensitive tool to get information on the X-ray emitting process even of faint sources. The faintest source analyzed has an X-ray flux of only .
However, the X-ray data alone do not allow a unique determination of the nature of the sources. Combining all available information from the X-ray to the low-frequency radio regime, we tried to constrain the emission process of each particular X-ray source.
Five X-ray sources are located within the interior of the Hi holes cataloged by Puche et al. (1992). Two of them appear to be associated with supernova remnants (#23 and #31), one can be identified as young star-forming regions (#20). The remaining two are most likely stellar end-points, in particular LMXBs (#25 and #26).
Four of the selected X-ray sources are located towards high column density regions of HoII. One may be associated with a stellar cluster hosting developed stars with bright X-ray emitting coronae (#8), two with young star forming regions (#12 and #24) and one with an X-ray binary system (#29).
Finally, we found 4 X-ray sources which are located far outside the stellar body and close to the rims of the Hi column density distribution of HoII. All these sources represent most likely stellar end-points, either supernova remnants or X-ray binaries.
Some of the H regions of HoII are associated with X-ray emission, however there is no strong correlation. We should keep in mind, however, that the X-ray detection threshold is very high, which leads to selecting only the brightest star forming regions. The much more sensitive CHANDRA and XMM-Newton observation will overcome this instrumental limitation.
LMXBs (tracers of the past star formation) are also found well outside the stellar body of HoII (#25, #26 and #29). This indicates past star formation at large galactocentric radii. The giant Hi holes may therefore be indeed residuals from energetic events associated with the stellar activity of HoII in the past (on timescale yrs). This would imply that LMXB are good markers for sites of old star formation. Because they are faint in the optical they are hardly detectable even with the Hubble Space Telescope at Mpc distances. In the X-ray domain however, they are prominent and bright X-ray sources with a hard spectrum. The ROSAT PSPC data presented here is unfortunately not sensitive enough to compile a complete inventory of LMXBs in HoII. However with CHANDRA and XMM-Newton LMXBs will be easy to detect (even in case they are deeply embedded LMXBs within the ISM of the host galaxy). This opens the exciting possibility to search for LMXBs within the todays “empty” Hi holes of HoII and other dwarf galaxies. In fact, only a few tens of ksec integration time with XMM-Newton is needed to reach the necessary flux level. The most critical step is to separate their X-ray emission from that of XRB sources which is unrelated to the galaxy of interest. The improved spectral resolution of the CCD–detectors on-board of CHANDRA and XMM-Newton will provide additional information to improve the presented X-ray hardness color–color diagram to identify the nature of the X-ray sources.
References
Hartmann D., Burton W.B., 1997, “Atlas of Galactic Neutral Hydrogen”, Cambridge University Press
Hoessel J.G., Saha A., Danielson G.E., 1998, AJ 115, 573
Puche D., Westphal D., Brinks E., Roy J.-R., 1992, AJ 103, 1841
Rhode K.L., Salzer J.J., Westphal D.J., Radice L.A., 1999, AJ 11 8, 323
Tongue T.D., Westphal D.J., 1995, AJ 109, 2462
Stewart S.G., Fanelli M.N., Byrd G.G. et al. 2000, ApJ 529, 201
Walter F., Brinks E., 1999, AJ 118, 273
Walter F., Kerp J., Duric N., Brinks E., Klein U., 1998, ApJ 502 , 143
Weaver R., McCray R., Castor J., Shapiro P., Moore R., 1977, ApJ 218, 377
Zimmermann U., Boese G., Becker W., et al., 1998, MPE Report