Detection of anisotropy in the Cosmic Microwave Background at horizon and sub-horizon scales with the BOOMERanG experiment
Abstract
BOOMERanG has recently resolved structures on the last scattering surface at redshift 1100 with high signal to noise ratio. We review the technical advances which made this possible, and we focus on the current results for maps and power spectra, with special attention to the determination of the total mass-energy density in the Universe and of other cosmological parameters.
1 Dipartimento di Fisica, Universitá di Roma La Sapienza, Roma, Italy; 2 Dept. of Physics, Queen Mary and Westfield College, London, UK; 3 Jet Propulsion Laboratory, Pasadena, CA, USA; 4 CITA University of Toronto, Canada; 5 NERSC-LBNL, Berkeley, CA, USA; 6 Center for Particle Astrophysics, Univ. of California at Berkeley, USA; 7 IROE - CNR, Via Panciatichi 64, 50127 Firenze, Italy; 8 Department of Physics, Univ. of California at Santa Barbara, USA; 9 California Institute of Technology, Pasadena, USA; 10 Dipartimento di Fisica, Universitá di Roma Tor Vergata, Roma, Italy; 11 Astrophysics, University of Oxford, UK; 12 PCC, College de France, Paris, France; 13 ENEA Centro Ricerche di Frascati, Italy ; 14 Physics and Astronomy Dept, Cardiff University, UK; 15 Departments of Physics and Astronomy, Univ. of Toronto, Canada; 16 Istituto Nazionale di Geofisica, Roma, Italy
1. Introduction
A wide class of cosmological models predicts a harmonic series of peaks in the power spectrum of the Cosmic Microwave Background (CMB). These are the imprint of the acoustic oscillations inside the horizon in the primeval plasma. At recombination (, years) the acoustic horizon subtends an angle of roughly , corresponding to a first peak at multipoles in the spherical harmonic expansion of the CMB temperature. A high confidence measurement of this peak came from analysis of the high quality image of about 3 of the sky obtained in the long duration flight of BOOMERanG (de Bernardis et al. 2000; Lange et al. 2000). An important confirmation arrived soon after from the MAXIMA experiment (Hanany et al. 2000; Balbi et al. 2000). Here we focus on the BOOMERanG experiment, which has produced a wide ( square degrees), faithful image of the CMB at angular scales smaller than 10o.
2. The Instrument
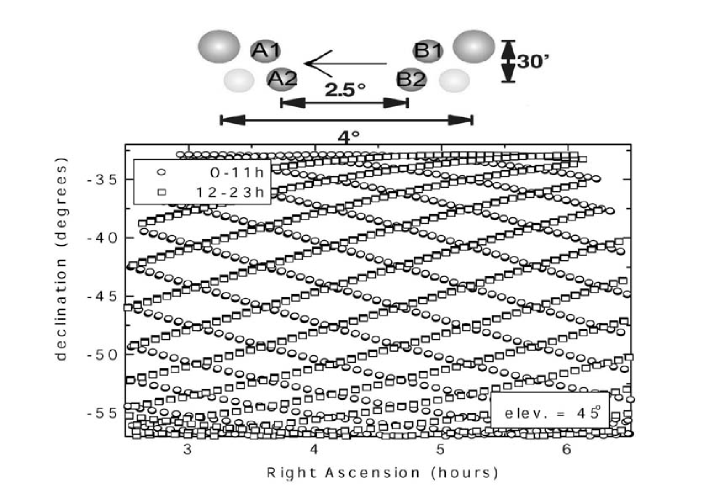
BOOMERanG is a scanning telescope, featuring three important improvements with respect to previous experiments. First, BOOMERanG uses a long duration (7 to 14 days) stratospheric ( km) balloon flight around Antarctica. Long integrations on a wide sky region are obtained, along with careful and extensive tests for systematic effects. In addition, flying during the austral summer from Antarctica, the lowest Galactic contamination region of the sky (Schlegel et al. 1998) is visible at an azimuth almost perfectly opposite to the azimuth of the Sun. This simplifies the necessary shielding required for thermal and optical reasons. Second, BOOMERanG uses a very sensitive total power receiver, based on spider-web bolometers (Mauskopf et al. 1997) cooled to 0.28 K with a custom cryogenic system (Masi et al. 1998; 1999). The power detected from one direction is compared to the power from contiguous directions by slowly scanning the telescope (1 to 2 in azimuth). This strategy is enabled by the intrinsic stability of the readout electronics (a low noise AC bridge) and of the detectors. The full payload is gently moved, avoiding mechanical choppers and the related inefficiencies and slowly varying offsets. Third, the focal plane is multiband, with 8 pixels and 4 colors (90, 150, 240, 410 GHz) strategically located with respect to the scan direction in order to have several temporal and spectral confirmations of the detected structures. We track the azimuth of the best sky region while scanning at constant elevation, thus obtaining higly crosslinked maps (see fig.1).
The main features of the detectors array (as measured in flight) are listed in table 1 (Crill et al. 2000, Piacentini et al. 2000)
3. The Data
The instrument was flown from McMurdo on Dec.29, 1998, and remained at an altitude higher than 37 km for 10.6 days, circumnavigating Antarctica along the 78oS parallel and performing nominally. We devoted 106 hours of the flight to scans in the best region at , 82 hours to scans at ; the rest of the time to calibration, observation of selected sources and diagnostics. Data were edited for instrumental events (calibration lamp flashes, telemetry glitches, elevation changes, bias changes, bias trimming, cosmic rays events). About 5 of the data in each of the channels was flagged in this process, replaced with a constrained realization of noise, and not used for further analysis.
| Parameter | 90GHz | 150GHz | 240GHz | 410GHz | |
|---|---|---|---|---|---|
| number of detectors | 2 | 6 | 4 | 4 | |
| best | 140 | 130 | 170 | - | |
| typical FWHM (arcmin) | 19 | 10 | 14 | 13 |
A preliminary pointing solution has been obtained from the data of the sun sensors, laser gyroscopes and differential GPS. The residual jitter is of the order or 3’ rms as checked on the apparent location of known Galactic sources. The responsivity calibration was obtained from the signal of the CMB dipole, visible in the data as a scan synchronous triangular signal. To check for systematic effects at the scan frequency, we calibrate separately the data at and the data at . The spread of the results is of the order of 10, due to scan sysnchronous noise, which is stronger at but is efficiently monitored using the 410 GHz channel data. So we attach to the responsivity calibration a conservative error of 10, dominated by systematic effects. The beam was measured before the flight with a tethered thermal source in the far field of the telescope. A beam model was constructed from these observations, and checked in flight on compact HII regions like RCW38 (see table 1). The preliminary uncertainty on the beam FWHM is of the order of 10. This hardly affects the power spectrum measurements at (see de Bernardis et al. 2000). In order to reduce the effect of drifts and 1/f noise, we high-pass filter the data in the time domain before making the map. This effectively corresponds to removing all the structures larger than 10o along the scan direction.
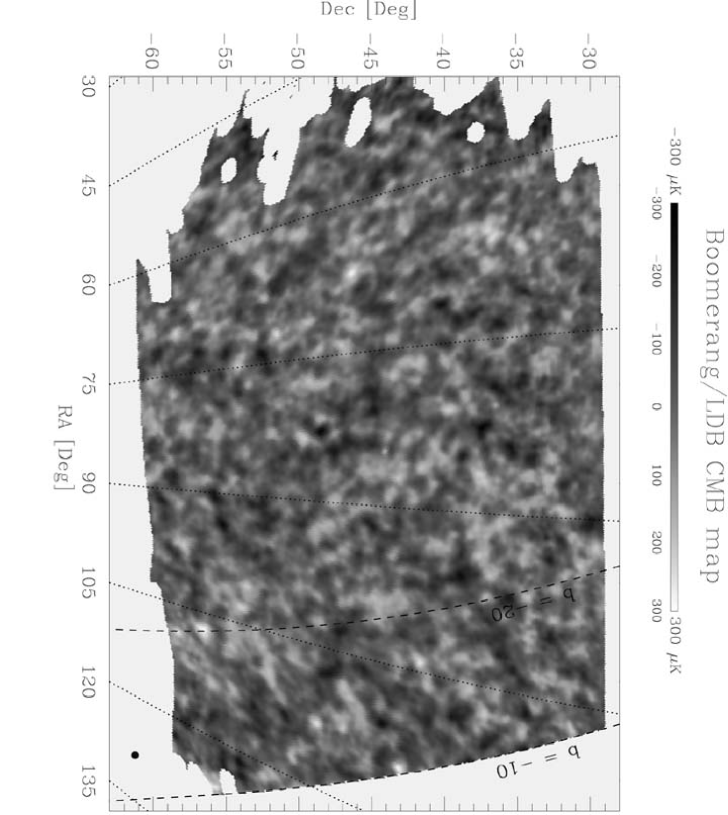
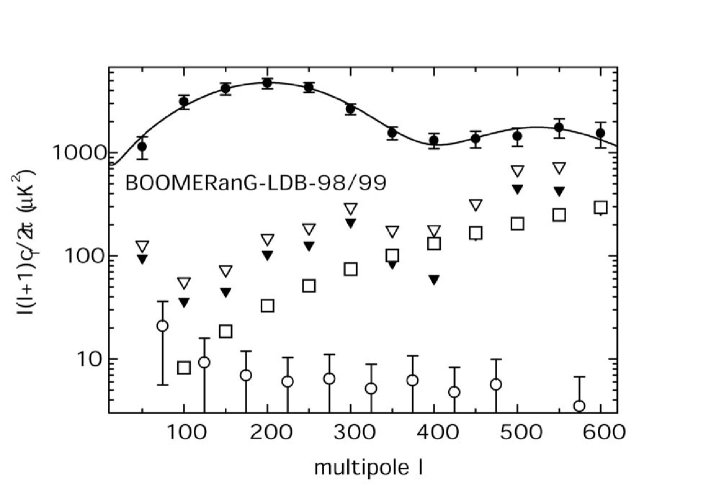
We build maps from the scan data using both simple coadding in pixels and an iterative method. The latter efficiently separates the noise from the signal, producing an accurate estimate of the noise filter (Prunet et al. 2000). This is then used in the MADCAP maximum likelihood map estimator (Borrill 1999). Both methods use the HEALPIX pixelization (Gorski et al. 1998), and find consistent results. The map obtained coadding three of the 150 GHz channels is shown in fig.2. The map features hundreds of structures with rms amplitude of and typical size of the order of one degree. These are detected with high S/N ratio. Consistency in amplitude and size with the maps obtained at 90 GHz and 240 GHz strongly suggests a cosmological origin of these strucutres. Three point sources in the map (highlighted by circles) are well known radio bright AGNs (flux ) and have been used to check our pointing reconstruction. Our estimates of Galactic contamination is based on correlation of our maps with the IRAS/DIRBE map (Schlegel et al. 1998) extrapolated to our frequencies, resampled along our scans and filtered in the time domain in the same way as our channels. This exercise shows that in the observed region, at , Galactic dust emission correlated with IRAS produces negligible signals at 150 GHz (Masi et al. 2000). The power spectrum of the central region shown in the map ( of the sky) has been computed with two independent methods: a simple spherical harmonic transform and the MADCAP maximum likelihood quadratic estimator (Borrill 1999). They give consistent results. The power spectrum derived from one single 150 GHz channel (the best one), using the 1 observations only, is shown in fig.3. The power spectrum has been corrected for the transfer function of the instrument, for the additional high-pass filtering, and for the effect of the 14’ HEALPIX pixelization. We performed several null tests to check for systematic errors. The most important is the power spectrum of the difference between the two maps obtained from the first half of the 1 observations and from the second half. The power spectrum is consistent with zero power, with a reduced . Since the payload moves by thousand km between the two halves of the data, any contamination from ground spillover should show-up in this difference spectrum, significantly increasing the . Also any contamination from the Sun in the far sidelobes of the telescope should produce similar effects, since the sun moves by many beamsizes during the measurements. The upper limit to systematic effects obtained in this way is plotted in fig.3, where we also show our estimates of contamination from Galactic dust and point sources. We can safely conclude that the observed power spectrum is not significantly contaminated by instrumental effects.
4. Cosmological Parameters
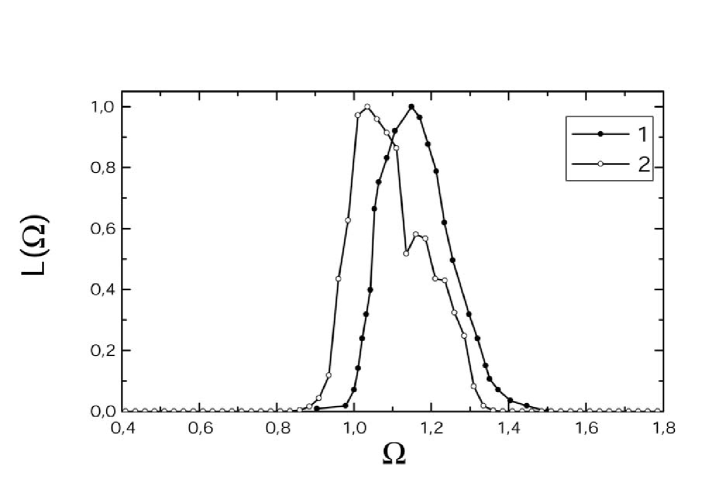
This measurement of a well defined peak in the power spectrum of the CMB strongly suggests the presence of acoustic oscillations in the primeval plasma (see e.g. Hu et al. 1997). In this scenario the degree-size hot and cold spots evident in the maps are images of the acoustic horizons on the last scattering surface at z 1100. Since CMB photons traveled so long in the Universe, the average size of these spots strongly depends on the average mass-energy density , which acts as a magnifying () or demagnifying () lens. Thus the location of the peak strongly depends on , i.e. on the curvature of the Universe, with a flat geometry producing . If there is a non vanishing cosmological constant , the relationship between , , and is non trivial (Weinberg 2000; Hu et al. 2000). We have evaluated by means of a quadratic fit to the power spectrum data. We find . In the framework of inflationary adiabatic cold dark matter models this location of the peak strongly suggests a flat geometry of the Universe (de Bernardis et al. 2000). More accurate statements require a through analysis of the full power spectrum dataset. A bayesian likelihood analysis has been carried out in order to constrain instrumental and cosmological parameters given the measured power spectrum, the COBE power spectrum data at low multipoles, and a set of prior distributions for the parameters. The result obtained depends on the priors assumed. We carried out two independent analyses using different parameters and various priors (Lange et al. 2000). In the first one we use as cosmological parameters the physical density of baryons and of dark matter ; the total mass-energy density , the energy density in cosmological constant , the spectral index of the spectrum of primordial density perturbations , the reionization optical depth and the overall normalization . In the second one we used the parameters , , , , and . In both analyses we marginalize over the uncertainty of the beam FWHM. We also marginalize over the calibration uncertainty assuming a gaussian distribution. We compute a database of power spectra for several millions of cases with different combinations of the values of the parameters. The ranges and sampling selected for each parameter are wide enough to cover in detail the relevant parameters space. We then compute for each model the likelihood of the data, given the model and the assumed prior distributions. We use uniform prior distributions for all the assumed parameters. We use the offset lognormal approximation of Bond et al. (2000) for the likelihoods. Finally, we compute the likelihood distribution for the parameter of interest by marginalizing over all the other parameters. The ranges of the parameters (equivalent to uniform priors) for analysis 1 are ( 0.03, 0.8), ( 0.003125, 0.2), (0, 1.1), (0.9, -0.5), (1.5, 0.5), (0, 0.5). For analysis 2 we have ( 0, 1.1), ( 0, 0.2), ( 0, 0.975), ( 0.25, 0.95), ( 0.5, 1.5) . is a continuous normalization parameter in both cases. In fig.4 we plot the marginalized likelihood distribution for . In analysis 1 we only add ”weak” priors for () and for the age of the universe (). In analysis 2 use similar priors: a gaussian prior for centered at 0.65 with dispersion 0.20, and the same prior for the age. The effect of the applied priors has been analyzed in detail in Lange et al. (2000). It is evident that a flat geometry () of the Universe is consistent with the BOOMERanG power spectrum of fig.3. The comparison of the two marginalized likelihoods shows the robustness of the result against changes in the details of the analysis method.
There is an important parameter degeneracy that contributes to the width of the likelihood distribution for (Bond and Efstathiou 1999). For example, given a flat model with other models (both open and closed) with virtually identical CMB power spectra can be found by fixing and , while changing and in a coordinated way. Our analysis is Bayesian, so the details of the likelihood curve will then depend on the density of models found in each direction along that particular path. In both analyses we find a number of closed models larger than the number of open models, and the shift of the two curves is due to the density of models considered in the two cases. The BOOMERanG data also constrain other cosmological parameters. In this framework the density of baryons controls the relative amplitude of the second acoustic peak of the power spectrum with respect to the amplitude of the first peak. Compressions of the plasma are favoured with respect to rarefactions when the density of baryons is increased. As a consequence, the second peak is suppressed relative to the first one. In the BOOMERanG spectrum discussed here the second peak is not evident, and we can only set an upper limit (an a lower one as well) to its amplitude. Models with a density of baryons higher than the Big Bang Nucleosynthesis (BBN) value (see e.g. Tytler et al. 2000) fit the data better. Using ”weak” priors we get , a value 2.8 higher than the BBN value. Assuming and weak priors on and we get , still off from the nucleosynthesis one. We must stress the fact that we are comparing two very different measurements of the baryon density: the CMB one is obtained from the density of baryons at , while the BBN one is inferred from measurement of the abundance of Deuterium in the line of sight towards three clusters at , and is representative of the primordial abundances. In the first case the physical processes involved are acoustic oscillations in the plasma before recombination, while in the second case are nuclear reactions occuring a few minutes after the big bang. It is rather spectacular that measurements obained with methods which are so orthogonal and subject to completely different sytematics produce results so close to each other. Another parameter constrained by the BOOMERanG power spectrum is . Using weak priors we get , in good agreement with the simplest inflationary scenario. A way to move the CMB measurement of the baryons to be more consistent with the BBN is to assume a shallower initial spectrum (): this is a simple way to reduce the height of the second peak without needing too many baryons. 0.9 is not the best ”marginalized” estimate for , but the fit to the data is very good anyway (see e.g. Lange et al. 2000; see also Tegmark et al. 2000 where large scale galaxy distribution data and CMB data are fitted simultaneously). A value is also consistent with modern inflationary models (see e.g. Kinney et al. 2000). The parameters and are strongly degenerate: combinations of these parameters resulting in the same produce very similar power spectra (Bond and Efstathiou 1998). This ”geometrical degeneracy” is broken once priors deriving from independent observations are used. We find that using either a prior due to observations of distant supernovae (Riess et al. 1998; Perlmutter et al. 1999) or a prior due to observations of the large scale distribution of galaxies (see Lange et al. 2000) we get several detections of and .
5. Conclusions
The data from BOOMERanG strongly support two of the main predictions of the simplest inflationary models: a nearly flat geometry of the Universe and a nearly scale-invariant spectrum of primordial density fluctuations. The detected density of baryons is from higher to consistent with that predicted from BBN, depending on the assumptions for other parameters. Combined with observations of different nature the BOOMERanG data produce significant detections of and . These conclusions are all confirmed by a joint analysis of the COBE, BOOMERanG and MAXIMA-1 data (Jaffe et al. 2000). Further insights are expected from the analysis of the data from the other detectors in BOOMERanG, from the data of the second flight of MAXIMA, and from the data of several interferometric CMB experiments underway.
6. Acknowledgments
The BOOMERanG project has been supported by PNRA, Universitá “La Sapienza”, and ASI in Italy, by NSF and NASA in the USA, and by PPARC in the UK. We would like to thank the entire staff of the NSBF, and the US Antarctic Program personnel in McMurdo for their excellent preflight support and a marvelous LDB flight. DoE/NERSC provided the supercomputing facilities. Web sites: (http://oberon.roma1.infn.it/boomerang) and (http://www.physics.ucsb.edu/boomerang).
References
Bond, J.R. Jaffe A.H, Knox L., 2000, ApJ, 533, 19
Bond, J.R. and Efstathiou, G. 1999, MNRAS, 304, 75
Borrill J. 1999, Proc. of the 3K Cosmology EC-TMR conference, eds. L. Maiani, F. Melchiorri, N. Vittorio, AIP CP 476, 277
Crill, B.P. et al. 2000, in preparation
de Bernardis, P. et al. 2000, Nature, 404, 955
Gorski K.M., Hivon E. & Wandelt B.D., 1998, Proceedings of the MPA/ESO Conference, eds. A.J. Banday, R.K. Sheth and L. Da Costa, (astro-ph / 9812350) ; see also http://www.tac.dk/ healpix
Hanany, S. et al. 2000, ApJsubmitted, astro-ph/0005167
Hu, W., Sugiyama N. & Silk J., 1997, Nature, 386, 37
Hu, W. et al. 2000, astro-ph/0006436
Jaffe, A. et al. 2000, astro-ph/0007333
Kinney W., Melchiorri A., Riotto A., 2000, PRD in press, astro-ph/0007375
Lange, A. et al. 2000, submitted to PRD, astro-ph/0005004
Masi, S. et al. 2000, in preparation
Masi, S. et al. 1998, Cryogenics, 38, 319
Masi, S. et al. 1999, Cryogenics, 39, 217
Mauskopf, P. et al. 2000, ApJ, 536, L59
Mauskopf, P. et al. 1997, Applied Optics, 36, 765
Melchiorri, A. et al. 2000, ApJ, 536, L63
Perlmutter, S. et al. 1999, ApJ, 517, 565
Piacentini, F. et al. 2000, in preparation
Prunet, S. et al, 2000 Proc. of the conference “Energy density in the Universe” D. Langlois, R. Ansari, J. Bartlett editors, editiones Frontieres, (2000) astro-ph/0006052
Riess et al., 1998, Astron.J., 116, 1009
Schlegel, D.J. et al. 1998, ApJ, 500, 525
Tegmark M. et al. 2000, hep-ph/0008167
Tytler, D. et al. 2000, Physica Scripta submitted, astro-ph/0001318
Weinberg, S. 2000, astro-ph/0006276
WOMBAT: http://astron.berkeley.edu/wombat/foregrounds/radio.html