ON THE HIDDEN NUCLEAR STARBURST IN ARP 220
Abstract
We construct a starburst model for the hidden starbursts in Arp 220 based on the new Starburst99 models of Leitherer et al. Comparing these stellar population synthesis models with observations, we show that the hidden power source must be due to star formation (as opposed to an AGN) at the 50% level or more in order to avoid an ionizing photon excess problem, and this starburst must be young ( yr). We derive a current star formation rate of yr-1, and an extinction mag for our line of sight to this hidden starburst.
Subject headings:
galaxies: individual (Arp 220) - galaxies: starburst - stars: formation1. INTRODUCTION
Ultraluminous infrared galaxies (ULIGs) are the most luminous galaxies in the Universe and their bolometric luminosities are comparable to those of quasars (). The physical origin of the large luminosity of ULIGs is unknown since the very centers of these objects, which is where the bolometric luminosity comes from (Sanders & Mirabel 1996) is very heavily obscured by dust and direct observation is not possible. Either an enshrouded starburst or an active galactic nucleus (AGN), or both, could generate the observed luminoisites.
Arp 220 is the nearest and best-studied ULIG111We use a distance of 74 Mpc, assuming and with the recession velocity to the Galactic Standard of Rest, (de Vaucouleurs et al. 1991). Recently Genzel et al. (1998) performed a mid-infrared spectroscopy program for a sample of ULIGs and demonstrated that Arp 220 has an appreciable PAH feature and so is powered by a starburst, assuming that the very core where originates from is not optically thick at 15 m. Based on detailed radiative transfer modelling, Rowan-Robinson (2000 and references therein) argues that galaxies like Arp 220 must be star-formation powered since they emit most of their luminosity longward of 50m. Additional indirect evidence that Arp 220 is powered by star formation includes (i) the lack of an X-ray detection (Iwasawa 1999), even at hard wavelengths where Compton scattering is less important; (ii) VLBI radio observations, which show many radio supernovae but no strong point radio source which could correspond to the AGN (Smith et al. 1998); (iii) a LINER222LINER = Low Ionization Nuclear Emission-line Region (Heckman 1980).-like optical emission-line spectrum which can result from a starburst-driven superwind (Veilleux et al. 1995; Taniguchi et al. 1999; Lutz, Veilleux, & Genzel 1999). This is not, however, unambiguous evidence that there is no AGN present. In any case, these measurements do not probe the very central regions, which is where most of the power is emitted. Rather they probe regions with optical depths at optical wavelengths.
On the other hand OH megamaser emission certainly indicates that the power source is compact (Lonsdale et al. 1994, 1998). This would be consistent with an AGN power source, but again this measurement is not a unique discriminant. The nature of the power source in cold ULIGs like Arp 220 has taken on a particular significance in recent times with the detection of a population of these objects at high redshifts which contribute a very large fraction of the extragalactic background light at far-infrared and submillimeter wavelengths (Barger, Cowie & Sanders 1999).
We now attempt to provide additional constraints on the nature of the power source in Arp 220 by investigating the so-called ionizing photon deficiency problem. Prestwich et al. (1994) performed near-infrared (NIR) spectroscopy for a sample of starburst galaxies including Arp 220 and found that the ratio of the Br luminosity to the infrared luminosity of Arp 220 is lower by a factor of ten than what is observed in lower-luminosity (but still very luminous) starburst galaxies, suggesting a deficit of ionizing photons. This could in part be due to absorption of the ionizing photons by dust, to an AGN contributing much of but few ionizing photons, or to the detailed shape of the stellar initial mass function (IMF). These physical process all operate on the global properties of Arp 220 in different ways and in this paper we use data from the literature together with starburst models and an SED fitting method to give constraints on the nature of the hidden power source.
2. MODELS
The nuclear super-star clusters seen in optical (Shaya et al. 1994) and near-infrared (Scoville et al. 1998) images are not the source of the high bolometric luminosity of Arp 220 (Shioya, Taniguchi & Trentham 2000), which is completely hidden by dust at those wavelengths. It is this hidden power source that we attempt to model. We use the population synthesis model of Leitherer et al. (1999, Starburst99) to compute bolometric luminosities and ionizing photon fluxes which we compare to the observed values derived from far-infrared and radio data respectively (where extinction is less of a problem).
The following assumptions are made:
1) we assume a model with continuous star formation. Note that there is abundant cold gas available as fuel (Scoville et al. 1991, 1998; Downes & Solomon 1998);
2) we consider the three stellar IMFs given in Table 1, where we list the IMF slope , lower-mass cutoff , and upper-mass cutoff . The values of are higher than what is observed in the solar neighborhood, but seems to be more appropriate for violent starburst galaxies (e.g., Goldader et al. 1997);
3) we assume solar metallicity, appropriate for the central regions of galaxies, which is where most stars generated in this kind of dense starburst will end up (e.g. Faber 1973);
4) we assume that a hypothesized AGN coexists with the starburst and contributes a fraction of the bolometric luminosity. Radio emission from this AGN is assumed to contribute negligibly to the ionizing photon flux inferred from radio recombination lines. This is reasonable since we expect an electron column density larger than given the existence of very dense gas traced by HCN (Solomon, Downes, & Radford 1992) and CS (Solomon, Radford, & Downes 1990). Radio emission from an AGN is then suppressed because of free-free absorption.
3. RESULTS
3.1. Initial Mass Function, Age, and AGN fraction
The total bolometric luminosity of Arp 220 is (Sanders et al. 1988). When considering the hidden power source, we need to subtract the part of the bolometric luminosity which is observed at optical and near-infrared wavelengths in the center of the galaxy. The -magnitude of the central diameter region of Arp 220 is 11.80 mag (Carico et al. 1990). Even with mag of extinction (Shier et al. 1996), this is only (assuming a bolometric correction of 0.5; Leitherer et al. 1999). This value is less than 10 % of the total bolometric luminosity of Arp 220 and we neglect it.
The ionizing photon production rate of Arp 220 is evaluated from the observation of radio recombination lines like H92: (Anantharamaiah et al. 2000). This is twice as large as the rate derived by Zhao et al. (1996) but Anantharamaiah et al. (2000) have wider velocity coverage; note that it is also larger than the upper limit derived by Scoville et al. (1991) from the free–free radio continuum flux density at 110 GHz, . Again, we have to estimate the ionizing photon rate from the regions we do see in -band and subtract it from the above values to derive the production rate for the hidden power source. The reddening-corrected ( 10 mag; Larkin et al. 1995) Br flux (; Goldader et al. 1995) gives an ionizing photon rate, for these visible starburst regions. Therefore the production rate for the hidden power source is: .
Following Scoville et al. (1997), we adopt the stellar mass of the nucleus of Arp 220 as . We therefore set the constraints on the stellar populations of the hidden starbursts as follows: and . An AGN fraction results in both of these parameters being lowered by a factor .
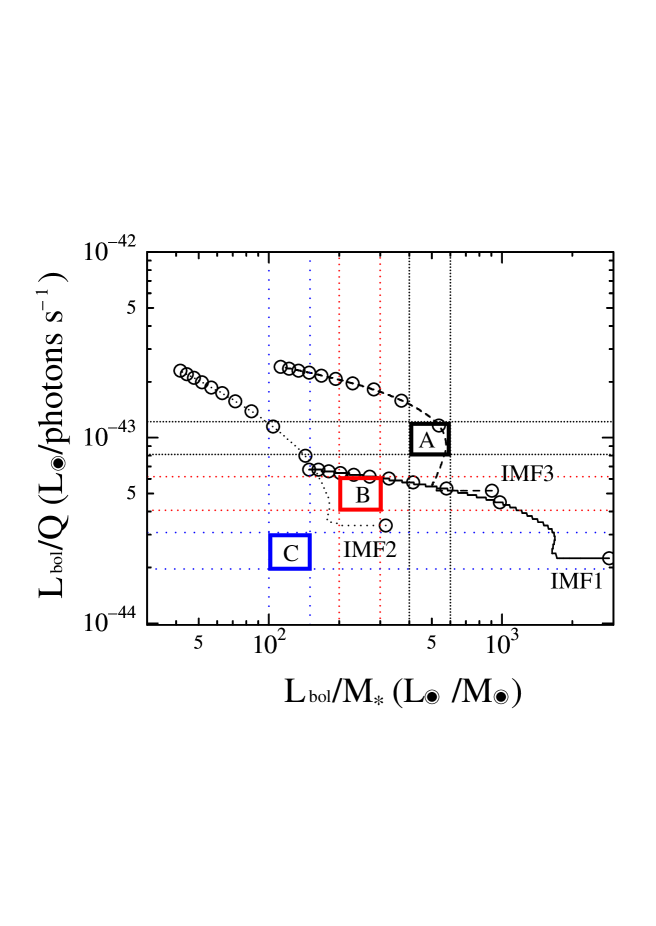
Now we compare the above numbers to the parameters derived for the three models described in Section 2. Figure 1 shows the evolutionary locus on a - plane for each model. The general form of the curves is understood as follows. Low-mass stars have smaller but larger than high-mass stars. Since the fractional mass of low-mass stars increases with increasing age, as time increases, becomes smaller while becomes larger for all the models.
Let us consider the results for the three IMFs in turn.
3.1.1 IMF1
For IMF1, the model overpredicts the bolometric luminosity given the observed ionizing photon flux (box A). This is the classical ionizing photon deficiency problem (e.g., Goldader et al. 1995). This could be solved in a number of ways: (i) reducing the number of massive stars which generate more bolometric luminosity per unit ionizing photon that lower mass stars. This could be achieved by either steepening the slope of the IMF (as in IMF2) or lowering the upper mass cutoff (as in IMF3). These adjustments have different effects on the properties studied here and are discussed in the next two sections. (ii) if some ionizing photons are absorbed by dust shortly after their production, the ionizing photon rate evaluated from radio recombination lines will be too low. The figure shows that IMF1 can then be consistent with observation if the hidden power source is a pure starburst with and between 0.3 and 0.6 of the ionizing photons that are generated are absorbed by dust (iii) if an AGN contributes some of the power, the ionizing photon deficiency problem can be reduced. If , then IMF1 is marginally consistent with observation if and no more than 30% of the ionizing photons are absorbed by dust. Increasing much beyond 0.5 is not permitted since there are then too many ionizing photons given the bolometric luminosity and the ionizing photon deficiency problem now becomes an ionizing photon excess problem. For example, region C on Figure 1 is excluded if IMF1 is valid.
3.1.2 IMF2
This steep IMF can only be consistent with observation if the age is very young ( yr) and is finely tuned to have a value of about 0.5 and if the fraction of ionizing photons absorbed by dust is finely tuned to have a value of about 0.2 (but not 0). We therefore regard it as unlikely. This IMF can never by itself generate a high enough value of to be consistent with observation. Increasing the AGN fraction helps a little but increasing it by too much creates an ionizing photon excess problem as described in the previous section.
3.1.3 IMF3
If we adopt the IMF with a smaller upper-mass limit (: IMF3), the evolutionary loci shift to the upper right on Figure 1. In the absence of either absorption of ionizing photons by dust or an AGN, the observational constraints are satisfied if . An AGN fraction greater than zero or an appreciable fraction of ionizing photons being absorbed by dust would generate an ionizing photon excess problem.
3.2. Current star formation rate in Arp 220
Since we adopt the constant star formation model, the star formation rate (SFR) is coupled uniquely to the bolometric luminosity for each model. Assuming the SFR of , the ionizing photon production rate is about at an age of yr for Model with IMF3 (i.e. where it intersects with Box A on Fig. 1). This corresponds to a total SFR of the hidden starburst of yr-1. In Arp 220, there are two concentrations of thermal dust emission with which the hidden starbursts are associated. Downes & Solomon (1998) evaluated the luminosity ratio between the western and the eastern nucleus as 1.5. We assume that the ratio of SFR between them is the same as this luminosity ratio. The SFR of the western nucleus is then yr-1 and that of the eastern nucleus is yr-1.
The results in this and the previous section depend intricately on our assumption of a star-formation rate that does not vary strongly with time (Point 1 in Section 2). An alternative way of explaining the deficiency is to have a star-formation rate that was extremely high at some time in the past but is low now. The highest mass stars, which produce most of the Lyman continuum, would since have died (these have very short lifetimes) and therefore the observed value of is low. If the starburst was sufficiently powerful to generate many intermediate-mass stars, these could produce the observed . Very large numbers of such stars would be required, since each star individually contributes only modestly to . Such a scenario may then need to be finely tuned in terms of both the time-variation of the star-formation rate and the IMF so as to avoid overproducing the total mass in stars (this must be less than the dynamical mass), but this is still an important caveat to our results.
3.3. Visual Extinction
Once we have chosen a particular model, we can compute the visual extinction necessary to hide the hidden starbursts in the -band image of Scoville et al. (1998). We find that must be larger than 30 mag for the western nucleus and 40 mag for the eastern nucleus for either IMF1 where more than 0.4 of the ionizing photons are absorbed by dust or for IMF3 where none of the ionizing photons are absorbed by dust (see the discussions in Sections 3.1.1 and 3.1.3). This result is consistent with the recent MIR observations; i.e., of 45 mag (Genzel et al. 1998).
4. Conclusion
In all the cases that we consider, the hidden power source due to star formation at the 50% level or more in order to avoid an ionizing photon excess problem, and this starburst must be young ( yr). We derive a current star formation rate of yr-1, and an extinction mag to this hidden starburst.
YS thanks the Japan Society for Promotion of Science (JSPS) Research Fellowships for Young Scientist. NT thanks the PPARC for financial support. YT would like to thank R. -P. Kudritzki, Bob McLaren and Dave Sanders at Institute for Astronomy, University of Hawaii for their warm hospitality. This work was financially supported in part by Grant-in-Aids for the Scientific Research (Nos. 07044054, 10044052, and 10304013) of the Japanese Ministry of Education, Science, Sports and Culture.
References
- (1) Anantharamaiah, K. R., Viallefond, F., Mohan, N. R., Goss, W. M., & Zhao, J. H. 2000, ApJ, 537, 613
- (2) Barger A. J., Cowie L. L., Sanders D. B., 1999, ApJ, 518, L5
- (3) Carico, D. P., et al. 1990, ApJ, 349, L39
- (4) de Vaucouleurs, G., de Vaucouleurs, A., Corwin, H. G., Jr., Buta, R. J., Paturel, G., & Forqué, P. 1991, Third Reference Catalogue of Bright Galaxies (Springer-Verlag)
- (5) Downes, D., & Solomon, P. M. 1998, ApJ, 507, 615
- (6) Faber, S. M. 1973, ApJ, 179, 731
- (7) Genzel, R., et al. 1998, ApJ, 498, 579
- (8) Goldader, J. D., Joseph, R. D., Doyon, R., & Sanders, D. B. 1995, ApJ, 444, 97
- (9) Goldader, J. D., Joseph, R. D., Doyon, R., & Sanders, D. B. 1997, ApJS, 108, 449
- (10) Iwasawa, K., 1999, MNRAS, 302, 96
- (11) Larkin, J. E., Armus, L., Knop, R. A., Matthews, K., & Soifer, B. T. 1995, ApJ, 452, 599
- (12) Leitherer, C., et al. 1999, ApJS, 123, 3
-
(13)
(
http://www.stsci.edu/science/starburst99/) - (14) Lonsdale, C. J., Diamond, P. J., Smith, H. E., & Lonsdale, C. J. 1994, Nature, 370, 117
- (15) Lonsdale, C. J., Diamond, P. J., Smith, H. E., & Lonsdale, C. J. 1998, ApJ, 493, L13
- (16) Lutz, D., Veilleux, S., & Genzel, R. 1999, ApJ, 517, L13
- (17) Prestwich, A. H., Joseph, R. D., & Wright, G. S. 1994, ApJ, 422, 73
- (18) Rowan-Robinson, M. 2000, MNRAS, 316, 885
- (19) Sanders, D. B., et al. 1988, ApJ, 325, 74
- (20) Sanders, D. B., & Mirabel, I. F. 1996, ARA&A, 34, 749
- (21) Scoville, N. Z., et al. 1998, ApJ, 492, L107
- (22) Scoville, N. Z., Sargent, A. I., Sanders, D. B., & Soifer, B. T. 1991, ApJ, 366, L5
- (23) Shaya, E., Dowling, D. M., Currie, D. G., Faber, S. M., & Groth, E. J. 1994, AJ, 107, 1675
- (24) Shier, L. M., Rieke, M. J., & Rieke, G. H. 1996, ApJ, 470, 222
- (25) Shioya, Y., Taniguchi, Y., & Trentham, N. 2000, MNRAS in press (astro-ph/0008312)
- (26) Smith, H. E., Lonsdale, C. J., Lonsdale, C. J., & Diamond, P. J. 1998, ApJ, 493, L17
- (27) Solomon, P. M., Downes, D., & Radford, S. J. E. 1992, ApJ, 387, L55
- (28) Solomon, P. M., Radford, S. J. E., & Downes, D. 1990, ApJ, 348, L53
- (29) Taniguchi, Y., Yoshino, A., Ohyama, Y., & Nishiura,S. 1999, ApJ, 514, 660
- (30) Veilleux, S., Kim, D.-C., Sanders, D. B., Mazzarella, J. M., & Soifer, B. T. 1995, ApJS, 98, 171
- (31) Zhao, J. H., Anantharamaiah, K. R., Goss, W. M., & Viallefond, F. 1996, ApJ, 472, 54
| IMF | |||
|---|---|---|---|
| 1 | 2.35 | 100 | 1 |
| 2 | 3.30 | 100 | 1 |
| 3 | 2.35 | 30 | 1 |