First results from
the BOOMERanG experiment
Abstract
We report the first results from the BOOMERanG experiment, which mapped at 90, 150, 240 and 410 GHz a wide () region of the microwave sky with minimal local contamination. From the data of the best 150 GHz detector we find evidence for a well defined peak in the power spectrum of temperature fluctuations of the Cosmic Microwave Background, localized at , with an amplitude of . The location, width and amplitude of the peak is suggestive of acoustic oscillations in the primeval plasma. In the framework of inflationary adiabatic cosmological models the measured spectrum allows a Bayesian estimate of the curvature of the Universe and of other cosmological parameters. With reasonable priors we find and (68C.L.) in excellent agreement with the expectations from the simplest inflationary theories. We also discuss the limits on the density of baryons, of cold dark matter and on the cosmological constant.
Introduction
Acoustic oscillations in the primeval plasma before recombination () produce a delicate pattern of horizon and sub-horizon size structures in the Cosmic Microwave Background. In the framework of inflationary adiabatic perturbations the angular power spectrum of these structures features a harmonic series of peaks, with the first peak at multipole .
Here we present a high confidence measurement of the first peak resulting from the analysis of the multiband, high quality image of about 3 of the sky obtained in the long duration flight of BOOMERanG deB00 ; Lan00 . We show that the BOOMERanG image is a faithful representation of the CMB at angular scales smaller than 10o, and we shortly discuss the methods we used to make sure that instrumental and astrophysical contaminations are negligible in our results. We present the measured power spectrum, and we discuss the cosmological implications of this measurement.
The instrument and the data set
The BOOMERanG payload and the important subsystems have been described in Mau97 ; Mas98 ; Mas99 ; Pia00 ; Cri00 . It is a scanning telescope measuring simultaneously eight pixels in the sky. Four pixels feature multiband photometers (150, 240 and 410 GHz), two pixels have single-mode, diffraction limited detectors at 150 GHz and two pixels have single-mode, diffraction limited detectors at 90 GHz. The NEP of these detectors is below 200 at 90, 150, and 240 GHz, and the angular resolution ranges from 10 to 18 arcmin FWHM.
The continuous scan of the sky ( in azimuth at or ) allows a wide sky coverage. Moreover, it encodes different spherical harmonic components of the sky brightness into different frequencies within a detection bandwidth ( 0.2-20 Hz) free from 1/f noise and drifts. The instrument is flown aboard a stratospheric balloon at 38 km of altitude, to avoid the bulk of atmospheric emission and noise. Using a long duration balloon flight carried out by NASA-NSBF around Antarctica we mapped square degrees in the region of the sky where Galactic contamination is minimal Sch98 . The instrument collected 57 million samples for each detector during the scans. A pointing solution matrix (accurate to 3’ rms) has been constructed using the data from the attitude sensors (sun sensors, laser gyroscopes, differential GPS). The beam response has been calibrated at ground, using a tethered thermal source in the far field of the telescope. This calibration has been checked in flight observing compact HII regions. The responsivity has been calibrated against the CMB dipole, which is visible along the scans as a 3 mK linear drift. Systematic effects limit the precision of this calibration to 10. For further analysis the data have been high-passed in the time domain, so that 1/f noise and drifts are reduced. In the same process, all the structures in the sky larger than 10o are effectively removed. A time-time correlation matrix has been constructed using an iterative method which effectively separates signal and noise in the data Pru00 . The maximum likelihood map and its covariance have been obtained from the data vector, the time-time correlation matrix and the pointing matrix as described in Bor99 . We use the HEALPIX Gor98 pixelization with 14’ pixel side as a compromise between coverage of high multipoles and computation speed.
The maps and the power spectra
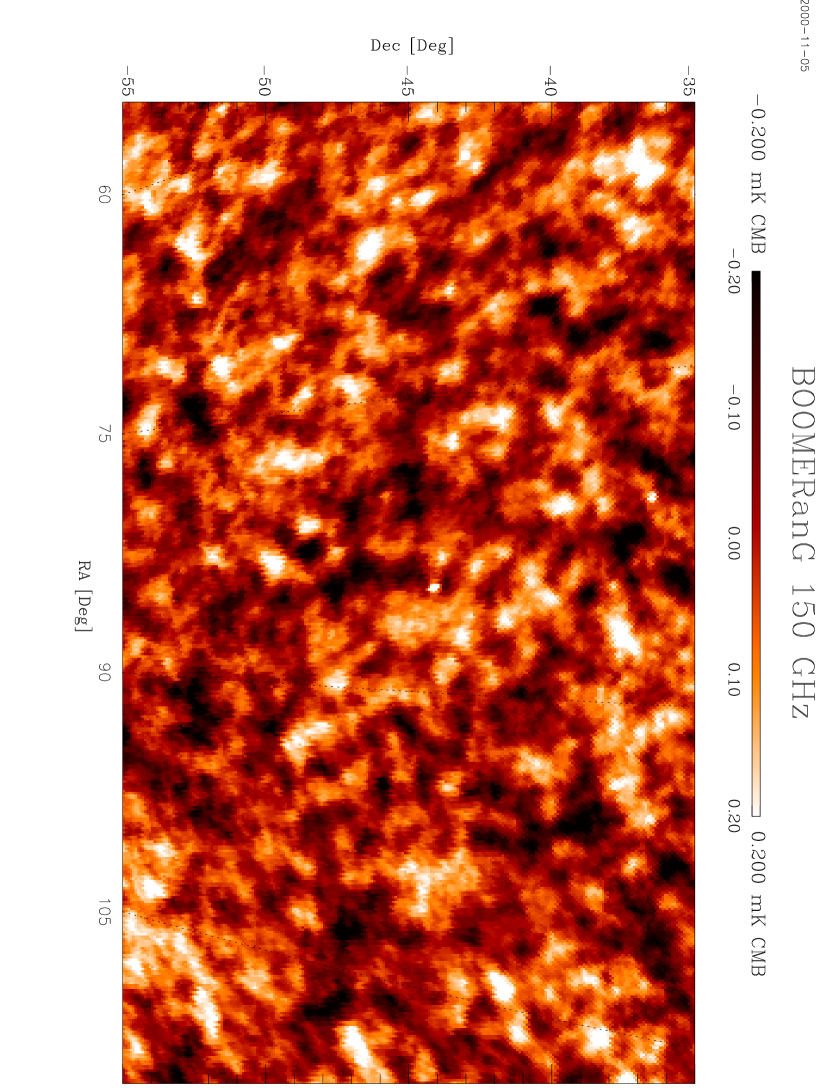
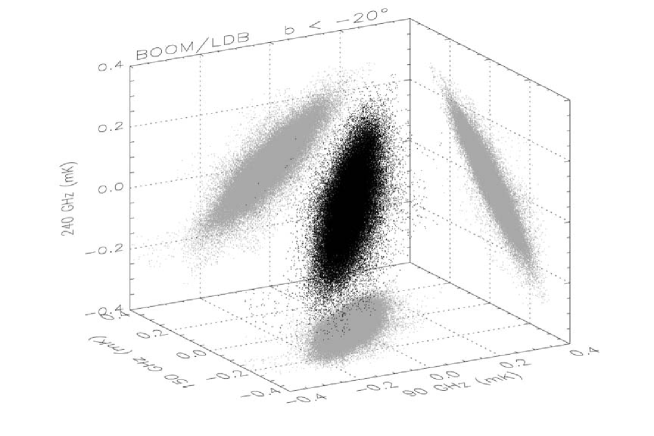
The maps in the four frequency channels have been published in deB00 . In figure 1 we increase the contrast and show the central part of a map obtained using a naive coadding in pixels of data from three of the 150 GHz channels. The 90, 150, 240 GHz maps all present the same degree-size structures, with amplitude ratios characteristic of CMB anisotropies (see figure 2), thus demonstrating that the bulk of the anisotropy we measure is cosmological in origin.
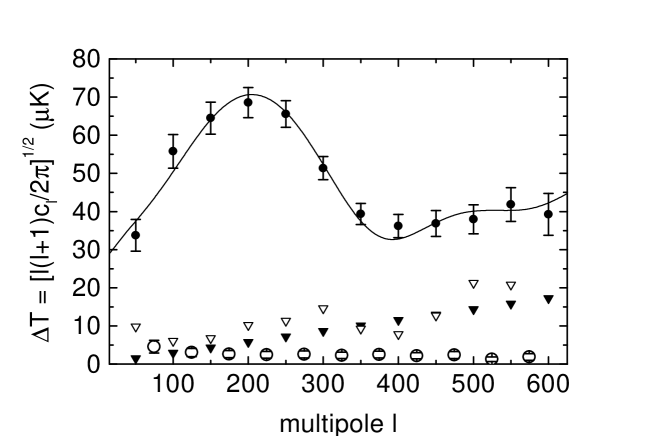
Dust contamination is evident only at lower Galactic latitudes, and mainly in the 240 GHz channel. At high Galactic latitudes the 410 GHz channel is a good monitor of low level emission from interstellar dust. We find a good correlation between this map and the IRAS/DIRBE map extrapolated at 410 GHz (model 8 in ref. Sch98 ) and filtered in the time domain in the same way as our data. This correlation allows us to estimate low level contributions from IRAS-correlated dust to the CMB map shown in fig.1. We find (see deB00 ; Mas00 for details) that this dust can produce at most 2 of the mean square anisotropy plotted in the 150 GHz map. We also studied the effect of point sources in the observed region. We used the PMN survey and the WOMBAT Wom00 software to extrapolate the radio sources flux to 150 GHz. The brightness fluctuation due to all the sources in our field corresponds to , and has to be compared to the total measured sky fluctuation . Its contribution to the angular power spectrum has been computed and is reported in fig.3. The maximum likelihood power spectrum of the central part of the map (1 of the sky) is computed as described in Bor99 ; deB00 and is plotted in fig.3. A distinct peak at multipole is evident, and significant power is detected at all the multipoles up to the highest observed ().
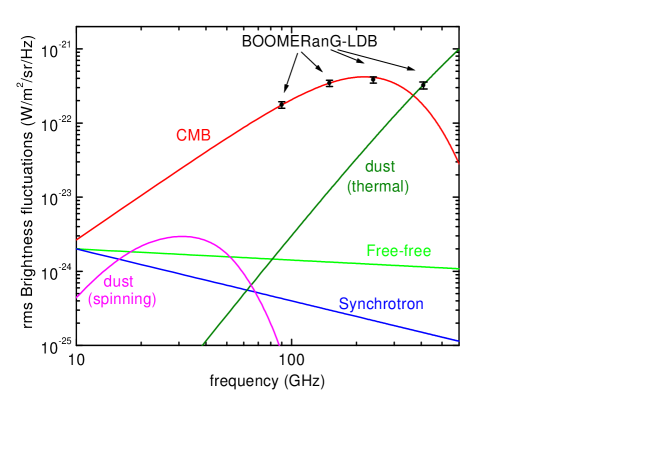
In figure 4 we plot the rms signal in the center part of the maps at 90, 150, 240 and 410 GHz, computed as . The have been converted into brightness fluctuations using the measured spectral efficiency of the different freqeuency channels. The of the 410 GHz brightness has been estimated from the component correlated with the IRAS/DIRBE maps; the amplitude of the thermal dust spectrum has been adjusted to fit such . The amplitudes of the other theoretical spectra for Galactic emission have been scaled from DeO00 taking into account the different window functions of BOOMERanG and COBE and assuming an power spectrum. Once again it is evident that the data from the three channels more sensitive to the CMB are fit very well by the derivative of a 2.726K blackbody, while all the other reasonable spectra for millimeter wave emission originated in our galaxy cannot fit our measurements.
Cosmological interpretation of the data
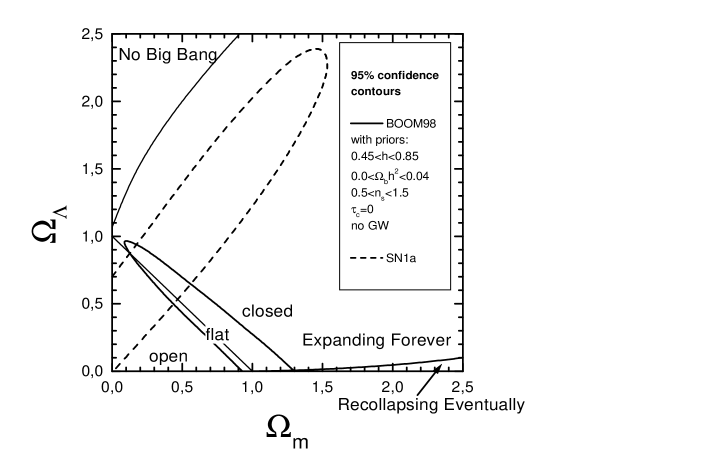
Having been able to exclude all the suspect sources of local contamination in the data of the power spectrum shown in figure 3, we can reasonably assume in the following that the detected power is in the CMB and comes from structures at the recombination epoch (). In the framework of adiabatic inflationary models, acoustic oscillations in the primeval plasma at horizon and sub-horizon scales produce a distinctive series of peaks in the power spectrum of the CMB. The BOOMERanG data support this picture. The position, amplitude and width of the peak evident in fig.3 are consistent with the general adiabatic inflationary scenario Hu97 , while the simplest models based on topological defects do not fit the data as well xxx . Using a quadratic fit we find that the peak is located at multipole (1). This result can shift a little bit if one assumes skewed power spectra similar to the adiabatic scenario ones Kno00 . This position is consistent with a flat geometry of space, but it is not univocally related to the density parameter if we allow for a non vanishing cosmological constant Wei00 . The continuous line in fig.3, a very good fit to the measured data, has parameters (, , , , ) = (1.035, 0.06, 0.425, 0.75, 1.0) where , , are the density parameters for baryons, cosmological constant, and for the total mass-energy density respectively; is the dimensionless Hubble constant, is the spectral index of the spectrum of primordial density perturbations. A full Bayesian analysis has been carried out Lan00 in order to measure the cosmological parameters and compute significant confidence intervals. In order to do this, we need to specify the prior distribution assumed for each of the parameters. This is especially important in the case of CMB power spectrum measurements, since an important geometrical degeneracy is present Bon99 , so different combinations of the parameters produce very similar power spectra. Given a flat model with , a closed model producing the same power spectrum can be found decreasing and and increasing , and an open model can be found doing the reverse. The marginalized likelihood curve for will then depend on the density of models found in each direction along that particular path. Our 95 confidence intervals for range from to depending on the assumed priors and parametrizations deB00 ; Lan00 . This strongly suggests a flat geometry of the Universe, and at least implies, with confidence, a curvature length larger than 2 to 3 times the Hubble length today. This measurement has very important cosmological consequences. Several independent measurements point to a matter density parameter significantly below unity Don99 ; Bah00 ; Bla99 ; Jus00 ; Wit00 . As a consequence a different form of energy is needed to fill the gap between the total energy density of the Universe and the energy density in matter. A cosmological constant is a good candidate, and has the appealing feature of explaining the recent evidence coming from the observation of distant supernovae Rie98 ; Per99 for an acceleration in the expansion rate of the Universe . The fine tuning problem characteristic of the cosmological constant Wei89 can be overcome invoking quintessence Ost95 ; Cal98 ; Arm00 ; Ame00 ; Bal200 . In the same adiabatic perturbations framework, we constrain in the range to (95 confidence) again depending on the priors Lan00 . Our constraints on and are consistent and support the simplest inflationary scenarios Lin81 ; Alb82 ; Wat00 . The third parameter constrained by BOOMERanG is the density of baryons. In the power spectrum this parameter controls the relative amplitude of the first peak to the second one (see e.g. Hu97 ). From the power spectrum of fig.4, this ratio is larger than expected for a standard primordial nucleosynthesis (, 1 Tyt00 ), thus suggesting a physical density of baryons somewhat higher. Depending on the assumed priors, we obtain 95 intervals for ranging from to Lan00 . This should be considered as a spectacular agreement, since we are comparing the density of baryons inferred from the physics of acoustic oscillations 300000 years after the big bang to the density of baryons inferred from the physics of nuclear reactions a few minutes after the big bang. Moreover, the measurement techniques are completely orthogonal and subject to completely different systematic effects. Should more precise measurements imply a more significant disagreement, new physics will be needed, and several hypothesis have been proposed already aa ; bb ; cc ; dd ; ee ; ff ; gg . One way to improve the consistency is to force the value to be smaller. is not the best marginalized value for , but the fit to the data is very good and still consistent with inflation (see e.g. Kin00 ). In fig.5 we plot the BOOMERanG constraints in the (,) plane. Here , with density parameter for non relativistic dark matter. It is evident that the data are fully consistent with a flat geometry of the Universe, represented by the line; however, the CMB anisotropy data alone cannot distinguish between the different contributions to the total mass-energy density. This degeneracy is efficiently removed once additional data are considered, like the data from distant supernovae or the data from the large scale distribution of galaxies. The combination of our data with any of the two is quite powerful, and suggests a ’concordance’ model with and (see Lan00 for details). In ref. Teg00 all the available CMB power spectrum data and the power spectrum of the distribution of IRAS galaxies from the redshift survey data are fit simultaneously, confirming the results above.
Conclusions
BOOMERanG has produced a faithful, wide map of CMB anisotropy at angular scales smaller than 10o. The power spectrum derived from the central part of the map ( of the sky) is consistent with the inflationary cosmological model with gaussian adiabatic density fluctuations. A careful analysis of the power spectrum data, rigorously taking into account the priors and the degeneracies related to these parameters, has been carried out. We conclude that the geometry of our universe is close to flat, and that the primordial density flucutations have a nearly Harrison-Zeldovich power spectrum. The density of baryons inferred from these measurements is slightly higher than the standard nucleosynthesis value. Combining the BOOMERanG data with data from the observations of distant supernovae or from large scale structure studies we obtain significant determinations of both and (1). All these results come from a single detector, and use the central part of the observed region. We are currently working on the combined analysis of all the 12 detectors sensitive to CMB.
Acknowledgments
The BOOMERanG project has been supported by PNRA, Universitá “La Sapienza”, and ASI in Italy, by NSF and NASA in the USA, and by PPARC in the UK. We would like to thank the entire staff of the NSBF, and the US Antarctic Program personnel in McMurdo for their excellent preflight support and a marvelous LDB flight. DoE/NERSC provided the supercomputing facilities. Web sites: (http://oberon.roma1.infn.it/boomerang) and (http://www.physics.ucsb.edu/boomerang).
References
- (1) de Bernardis, P. et al. Nature 404, 955 (2000).
- (2) Lange, A. et al. submitted to PRD, astro-ph/0005004 (2000).
- (3) Hanany, S. et al. , Ap.J. submitted, (2000) astro-ph/0005167.
- (4) Balbi, A. et al. , Ap.J. submitted, (2000) astro-ph/0005168.
- (5) Mauskopf, P. et al. Applied Optics 36, 765 (1997).
- (6) Masi, S. et al. Cryogenics 38, 319 (1998).
- (7) Masi, S. et al. Cryogenics 39, 217 (1999).
- (8) Piacentini, F. et al. in preparation (2000).
- (9) Crill, B.P. et al. in preparation (2000).
- (10) Schlegel, D.J. et al. Ap.J. 500, 525 (1998).
- (11) Prunet, S. et al, Proc. of the conference Energy density in the Universe, D. Langlois, R. Ansari, J. Bartlett editors, editiones Frontieres, astro-ph/0006052 (2000).
- (12) WOMBAT: http://astron.berkeley.edu/wombat/foregrounds/radio.html
- (13) Borrill J., Proc. of the 3K Cosmology EC-TMR conference, eds. L. Maiani, F. Melchiorri, N. Vittorio, American Institute of Physics CP 476, 277, (1999).
- (14) Gorski K.M., Hivon E. & Wandelt B.D., Proceedings of the MPA/ESO Conference, eds. A.J. Banday, R.K. Sheth and L. Da Costa, (astro-ph / 9812350) ; see also http://www.tac.dk/healpix (1998).
- (15) Masi, S. et al. in preparation, (2000).
- (16) De Oliveira - Costa, A. et al. astro-ph/0003090 (2000)
- (17) Hu, W., Sugiyama N. & Silk J. Nature, 37, 386 (1997).
- (18) topological defects
- (19) Knox L., Page L., Phys.Rev.Lett. 85 (2000) 1366-1369
- (20) Weinberg S., astro-ph/0006276 (2000).
- (21) Bond, J.R. and Efstathiou, G. MNRAS, 304, 75 (1999).
- (22) Donahue M., Voit M, astro-ph/9907333
- (23) Bahcall N.A. et al, Ap.J. 541, 1 (2000)
- (24) Blakesee J.P., et al., astro-ph/9910340
- (25) Juszkiewicz R., et al., Science 287, 109 (2000)
- (26) Wittman et al., Nature, May 11 2000
- (27) Riess A.G. et al, Ap.J. 116, 1009 (1998)
- (28) Perlmutter S. et al, Ap.J. 517, 565 (1999)
- (29) Weinberg S., Rev. Mod. Phys. 61, 1 (1989)
- (30) Ostriker J.P., and Steinhardt P.J., Nature, 377, 600 (1995)
- (31) Caldwell R.R., Dave R., Steinhardt P.J., Phys. Rev. Lett., 80, 1582 (1998)
- (32) Armendariz C., Mukhanov V., Steinhardt P.J., astro-ph/0004134 (2000)
- (33) Amendola L., astro-ph/0006300
- (34) Balbi A., et al. astro-ph/0009432 (2000)
- (35) Linde A.D., Phys.Lett. 108B, 389, (1981)
- (36) Albrecht A., Steinhardt P.J., Phys.Rev.Lett. 48, 1220, (1982)
- (37) Watson, G.S., astro-ph/0005003, (2000)
- (38) Tytler, D. et al. 2000, Physica Scripta submitted, astro-ph/0001318
- (39) S. Esposito, et al. astro-ph/0007419, (2000)
- (40) J. Lesgourgues, M. Peloso astro-ph/0004412, (2000)
- (41) M. Kaplinghat, M.S. Turner astro-ph/0007454, (2000)
- (42) S.H. Hansen, F.L. Villante astro-ph/0005114, (2000)
- (43) P. Di Bari, R. Foot hep-ph/0008258
- (44) S. McGaugh, astro-ph/0008188 (2000)
- (45) F.R. Bouchet, P. Peter, A. Riazuelo, M. Sakellariadou astro-ph/0005022 (2000)
- (46) Kinney W., Melchiorri A., Riotto A., PRD in press, astro-ph/0007375 (2000)
- (47) Tegmark M. et al. , hep-ph/0008167 (2000)