The 2000 outburst of the recurrent nova
CI Aquilae: optical spectroscopy††thanks: Based on the data
obtained at the David Dunlap Observatory, University of Toronto
Abstract
We present low- and medium resolution spectra of the recurrent nova CI Aquilae taken at 14 epochs in May and June, 2000. The overall appearance is similar to other U Sco-type recurrent novae (U Sco, V394 CrA). Medium resolution () hydrogen and iron profiles suggest an early expansion velocity of 2000–2500 km s-1. The H evolution is followed from t = 0.6 d to +53 d, starting from a nearly Gaussian shape to a double peaked profile through strong P-Cyg profiles. The interstellar component of the sodium D line and two diffuse interstellar bands put constraints on the interstellar reddening which is estimated to be E(BV)=. The available visual and CCD-V observations are used to determine t0, t2 and t3. The resulting parameters are: t0=2451669.50.1, t d, t d. The recent lightcurve is found to be generally similar to that observed in 1917 with departures as large as 1–2 mag in certain phases. This behaviour is also typical for the U Sco subclass.
Key Words.:
stars: novae – stars: individual: CI Aql1 Introduction
The first documented outburst of CI Aql was discovered in 1917 at a photographic maximum of 110 (Reinmuth 1925). The reported eruption and the lack of subsequent outbursts suggested CI Aql to be a classical nova or dwarf nova with long recurrence time. The dwarf nova classification was disproved by spectroscopic observations which showed no Balmer emission lines (Szkody & Howell 1992). Very recently, Wilson (2000) examined the Harvard College Observatory patrol plates taken in 1917 and found the 1917 outburst much brighter than Reinmuth’s estimate. Tycho B magnitudes for nearby comparison stars gave a maximum brightness of 86.
Time resolved CCD photometric observations by Mennickent & Honeycutt (1995) lead to the discovery of eclipsing binary nature of CI Aql with an orbital period of 0.618355 days. Their subsequent optical and far red spectroscopy showed only absorption lines of hydrogen, sodium and calcium. The Ca II infrared triplet being a considerably good luminosity indicator implied an evolved giant secondary component and the authors suggested CI Aql to belong to the class of recurrent novae. However, the lack of short-term erratic light variation (flickering) lead to a conclusion that the components of CI Aql were not in strong interaction between 1991-1995. In contrast to above, Greiner et al. (1996) presented optical spectra in the 3800–7200 Å range showing the high-excitation lines HeII and NIII/CIII in emission. Also, they found the [O I] emission at 6300 Å. Based on a simple consideration about the mass dependence of the semi-major axis for a reasonable range of masses of the two components, Greiner et al. excluded the possiblity of a giant component in the system, but suggesting subgiant or main-sequence components. However, their results were inconclusive on the real nature of CI Aql. The present outburst cleared the situation, placing CI Aql among the recurrent novae.
Recurrent novae (RNe) form a rare class of cataclysmic variables. Their repeated outbursts are thought to be caused by thermonuclear runaways on the surface of white dwarf primaries which accrete material from the cool dwarf or giant secondary stars. Three subclasses (T Pyx, U Sco, and T CrB) can be distinguished according to the physical nature of the secondary and the corresponding orbital period (Warner 1995). The 0.618 d orbital period of CI Aql is typical for the U Sco subclass (V394 CrA, LMC-RN, U Sco) consisting of RNe with He-dominated quiescent disks, d and visible secondary spectra in quiescence. The declining branches of their lightcurves vary from outburst to outburst indicating intrinsic variations of the interaction between the components.
The 2000 outburst of CI Aql was discovered by K. Takamizawa on unfiltered T-Max 400 exposures taken on April 28.669 and 28.673 UT. An independent photographic discovery was reported by M. Yamamoto. The first low-resolution spectra (April 29.6 UT) showed prominent H emission with no P-Cyg profile indicating a fast nova at a slightly evolved stage (Takamizawa et al. 2000). Precise astrometry by Yamaoka et al. (2000) resulted in the identification of the star with CI Aql known as an eclipsing binary (Mennickent & Honeycutt 1995) and Nova Aql 1917 (Reinmuth 1925, Duerbeck 1987). Their coincidence was provided by the large scale of the discovery plates taken in 1917. Objective prism spectra by W. Liller showed strong H emission, weak H line, [O I] lines (6300 and 6360 Å) and He II at 5870 Å(Yamaoka et al. 2000). Early multicolour photometric data obtained around maximum (Yamaoka et al. 2000, Wilson et al. 2000, Hanzl 2000) gave (BV) suggesting relatively high reddening, also pointed out by Liller based on the observed weak H emission compared to the strong H line. Mazuk et al. (2000) reported 0.8–2.5 micron spectrophotometry obtained 74 days after the peak brightness, which showed evidence for an increased excitation of the emission-line gas, as the neutral C, N and O lines disappeared and the prominent He II lines replaced the He I 10830 Å line.
The main aim of this paper is to present optical spectra taken around and after the maximum, between t = 0.6 d to t = +53 d. The low- and medium resolution spectra were used to determine the main outburst properties, the expansion velocity and the interstellar reddening. We also use all publicly available visual photometric data collected by the VSNET group (http://www.kusastro.kyoto-u.ac.jp/vsnet) to estime the rates of decline and to check the photometric phases of the obtained spectra.
The paper is organised as follows. Observations and data reductions are briefly described in Sect. 2, the detailed description of the obtained spectra is given in Sect. 3, while the reddening determination is discussed in Sect. 4. We present the visual lightcurve in Sect. 5 and compare it with the 1917 outburst. Concluding remarks are given in Sect. 6.
2 Observations
| Date (UT) | Hel. JD | Instrument | dispersion | range (Å) | t |
|---|---|---|---|---|---|
| 2000 | (2451000+) | element | (day) | ||
| May 3/4 | 668.867 | 1.88-m | 1800 l/mm | 5080–5290 | 0.6 |
| 668.875 | 1.88-m | 1800 l/mm | 6500–6700 | 0.6 | |
| May 5/6 | 670.884 | 1.88-m | 1800 l/mm | 6500–6700 | +1.3 |
| May 8/9 | 673.741 | 1.88-m | 1800 l/mm | 5080–5290 | +4.2 |
| 673.755 | 1.88-m | 1800 l/mm | 6500–6700 | +4.2 | |
| May 10/11 | 675.860 | 1.88-m | 1800 l/mm | 5080–5290 | +6 |
| 675.876 | 1.88-m | 1800 l/mm | 6500–6700 | +6 | |
| May 15/16 | 680.818 | 1.88-m | 600 l/mm | 3860–4490 | +11 |
| 680.837 | 1.88-m | 1800 l/mm | 6500–6700 | +11 | |
| May 25/26 | 690.644 | 1.88-m | 1800 l/mm | 6500–6700 | +21 |
| 690.867 | 1.88-m | 1800 l/mm | 5800–6000 | +21 | |
| May 26/27 | 691.452 | 0.6-m Schmidt | 5∘ prism | 4200–8900 | +22 |
| May 27/28 | 692.453 | 0.6-m Schmidt | 5∘ prism | 4200–8900 | +23 |
| May 28/29 | 693.472 | 0.6-m Schmidt | 5∘ prism | 4200–8900 | +24 |
| May 29/30 | 694.415 | 0.6-m Schmidt | 5∘ prism | 4200–8900 | +25 |
| May 30/31 | 695.419 | 0.6-m Schmidt | 5∘ prism | 4200–8900 | +26 |
| June 6/7 | 702.711–702.839 | 1.88-m | 1800 l/mm | 6500–6700 | +33 |
| (8 spectra) | |||||
| June 21/22 | 717.802 | 1.88-m | 1800 l/mm | 6500–6700 | +48 |
| June 26/27 | 722.765 | 1.88-m | 1800 l/mm | 6500–6700 | +53 |
The presented data were aquired on 14 nights at two observatories in May and June, 2000. Medium resolution () spectroscopic observations were carried out on 9 nights with the Cassegrain-spectrograph attached to the 1.88-m telescope of the David Dunlap Observatory (Richmond Hill, Canada). The detector was a Thomson 1024x1024 CCD chip (with a 6 e- readout noise). The slit width was 306 corresponding to 18 on the sky. Typical observing circumstances at DDO are far from being photometric which is reflected, for instance, in the usual seeing values (2-3”). That is why we did not attempt to flux calibrate the data. All spectra presented throughout the paper were continuum normalized, though it was a quite difficult task in certain cases. Further observational details are given in Table 1.
The DDO spectra were reduced with standard IRAF tasks. Nightly master biases were created by forming a median of the individual bias frames. The bias subtraction was followed by flat-fielding with a similar nightly master flat-field from five to seven individual flat-field images. The aperture extraction and wavelength calibration was done with the task doslit. The wavelength scale was determined in each case with two FeAr spectral lamp exposures obtained immediately before and after every stellar exposure. The comparison spectral lines were identified with the web-based Iron-Argon Spectral Atlas by Willmarth & Cheselka 111http://www.noao.edu/kpno/specatlas/fear/fear.html. The integration times ranged between 200-1200 seconds, depending on the actual brightness, wavelength range and resolving power. As well as the nova, we observed HD 177724 (rapidly rotating A-type star) to identify telluric lines. This turned out to be crucial when distinguishing sharp absorption features in the late high-resolution H profiles. The continuum normalization was made by fitting low-order Chebyshev-functions (with the IRAF task contin) to those parts of the individual spectra which were not or only slighty affected by the broad line profiles.
Low-resolution objective prism spectra were obtained on five nights in May, 2000 at Piszkéstető Station of the Konkoly Observatory with the 60/90/180 cm Schmidt-telescope. The detector was a Photometrics AT200 CCD camera (1536x1024 pixels, KAF-1600 chip with UV-coating). The objective prism has a refracting angle of 5∘ giving an image scale of 580 Å/mm at H. In the case of objective prism spectroscopy, the resolving power is grossly affected by the seeing that smooths the detected image along and perpendicular to the dispersion. The resolution () was estimated from the width of the spectral images (typically 3 pixels) and the actual Å/pixel image scale which strongly depends on the wavelength range. The resulting resolution values are 290 and 110 for the blue and red end of the spectra, respectively. Although the unfiltered observations covered the whole optical region between 3800 and 9000 Å, the useful spectral coverage was a slightly narrower (4200–8900 Å). The full journal of observations is presented in Table 1.
The spectral extraction of the objective prism frames was done with routines developed by the first author. Briefly, an automatic detection of the spectral images is performed, which results in the location of the spectra perpendicular and along the dispersion. For the wavelength calibration two comparison-star spectra were used, where unambiguous spectral features provide good calibrator data (hydrogen Balmer-series in an A-type star, molecular bands in a M-type star). The common features (strong atmospheric lines at 7200 Å, 7600 Å and 8170 Å) helped adjust the spectra to the same wavelength scale. The residual scatter of calibrating spectral lines is typically about 1 pixel, corresponding to 5–20 Å depending on the spectral region. The next step was a relative flux-calibration by dividing the extracted spectra with the spectral response function of the instrument (determined from the observed and absolute flux distribution of Vega taken from Gray 1992). However, this calibration may suffer from large systematic errors as Vega was observed at a significantly different air-mass with the shortest exposure time available (1 msec). Since neither the observing conditions were extremely good (strong variations of the seeing), nor could the possible shutter effects be included in the reduction, we normalized the low-resolution spectra to the continuum. This way we have lost the possible hints of a red continuum (due to the cooler secondary star) but the most important spectral features could be well identified.
3 Description of the spectra
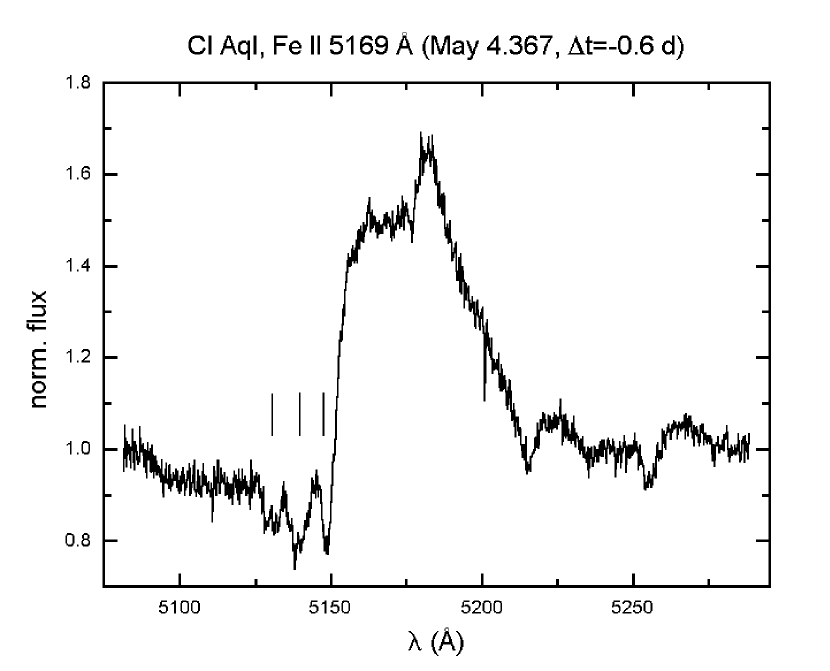
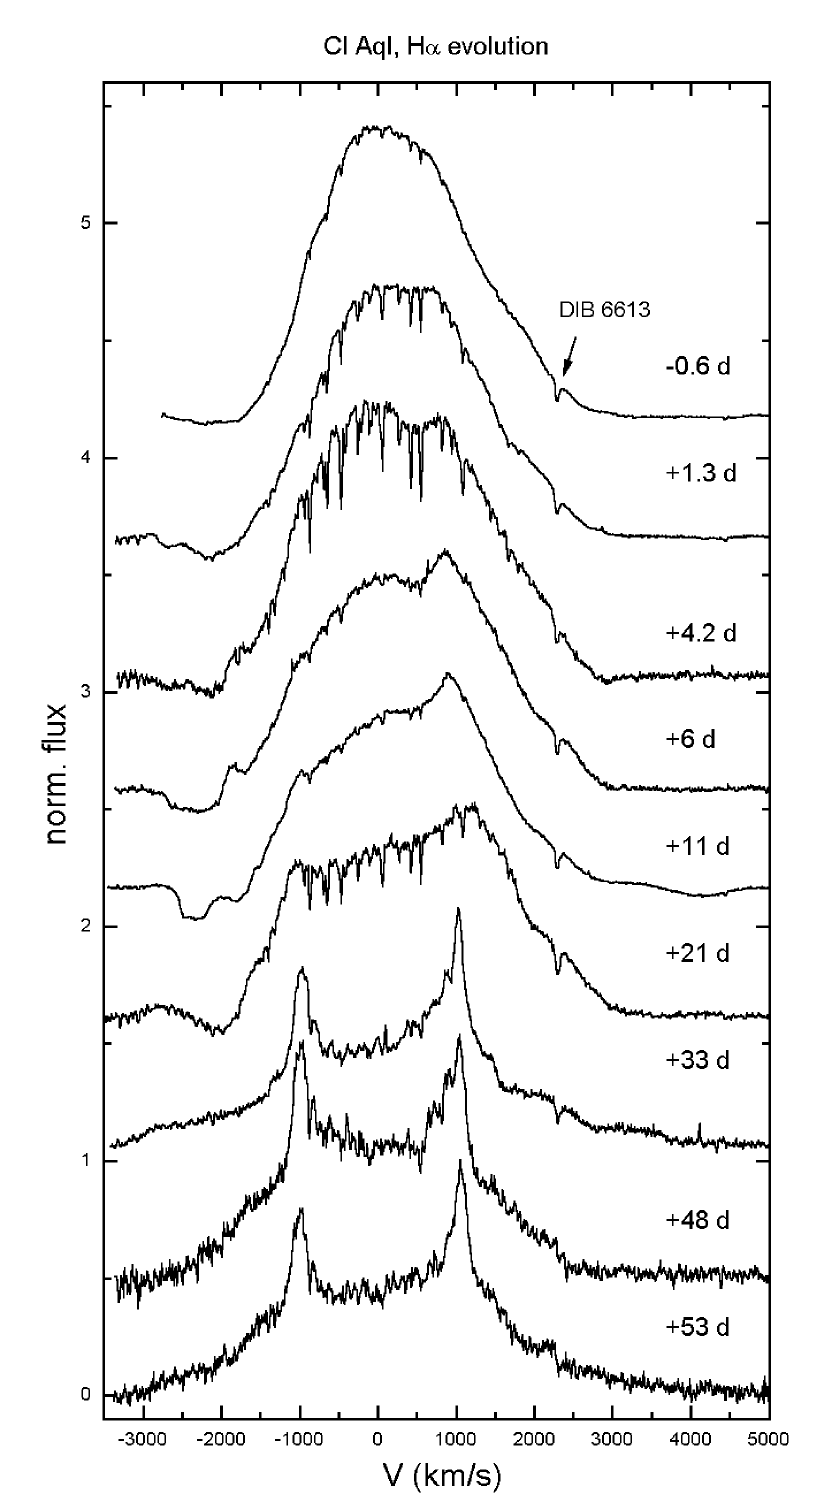
The first two spectra were obtained just before the light maximum, which occured on May 5.0 UT (JD 2451669.5, see later). The bluer one was centered at 5184 Å and showed the strong Fe II 5169 Å emission line with P-Cyg profile (Fig. 1). The radial velocities of absorption features are 1100, 1700 and 2200 km s-1. (This wavelength range was observed again on two other nights, but the acquired spectra had too poor S/N ratios for further conclusions). The simultaneously observed H line is nearly Gaussian with slight redward asymmetry (top curve in Fig. 6). Note the presence of the diffuse interstellar band (DIB) at 6613 Å. The later evolution of the H line will be described separately, thus we bring forward discussion of other spectra.
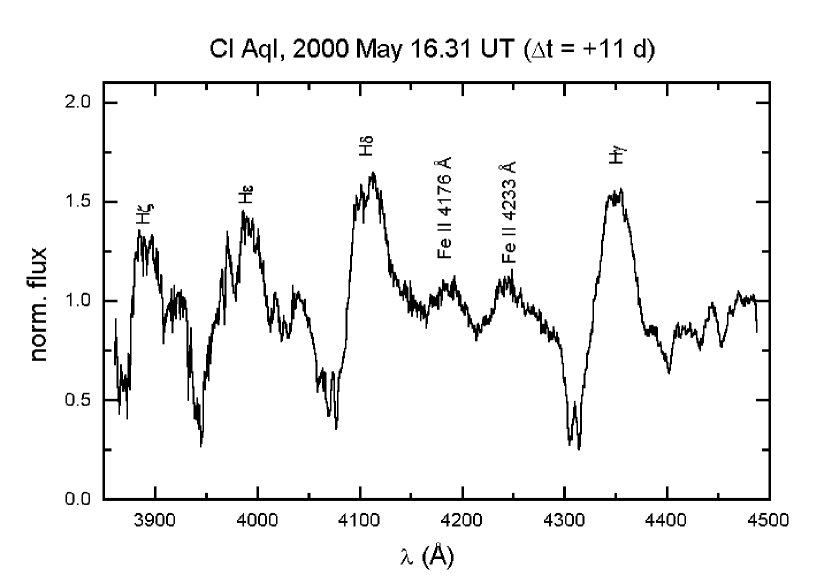
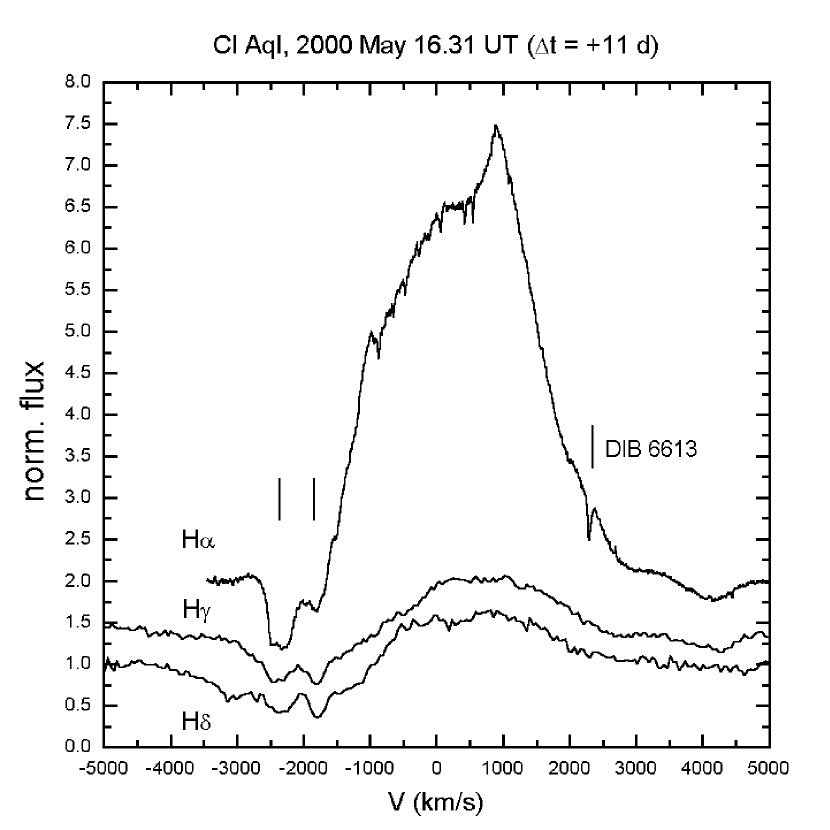
One intermediate resolution spectrum was taken on May 16.3 UT centered at 4200 Å (t = +11 d). Prominent Balmer emission lines with strong P-Cyg profiles dominate the spectrum, while Fe II 4176 and 4233 Å lines are also present (Fig. 2). An H observation on the same night reveals the similarity of all observed hydrogen lines: double-structured absorption suggesting two expanding shells with velocities of 1800 and 2400 km s-1 (Fig. 3).
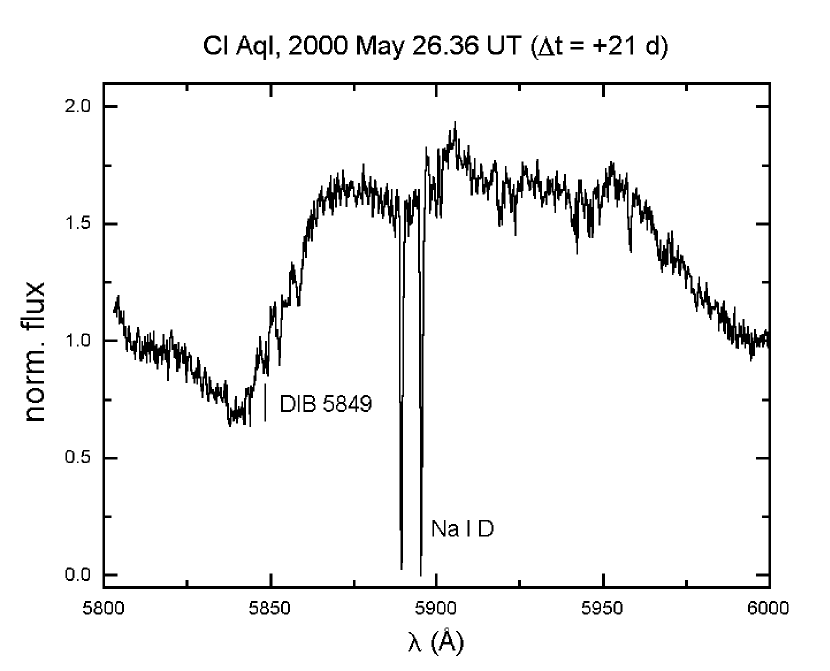
The next run was on May 25 (t = +21 d), when the He I 5876 Å/Na I D blend was observed. The most important detection in this spectrum is of the strong interstellar component (see the deep and sharp features at the rest wavelengths of sodium doublet in Fig. 4) and the much weaker DIB at 5849 Å. These lines can be used as reddening indicators as will be discussed in the next section.
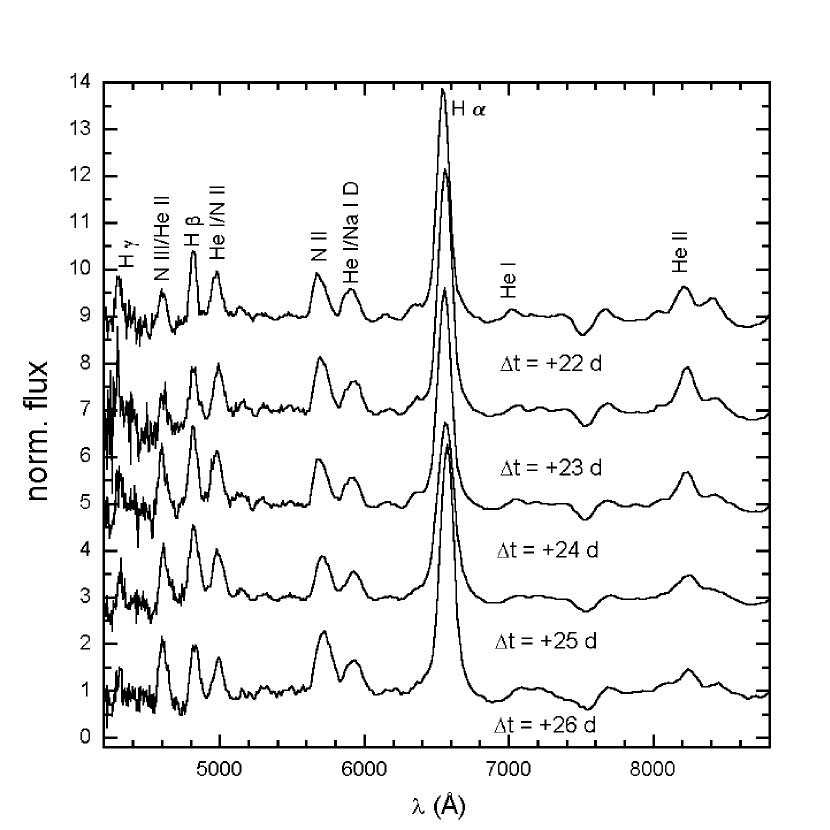
The first low-resolution objective prism spectrum taken a day later is shown in Fig. 5. We could identify the following lines/blends: hydrogen Balmer series from H to H, N III 4640/He II 4686, N III 5001/He I 5016, N II 5679, He I 5876/Na I D, He I 7075, He I 7281 and He II 8237 Å. Further objective prism spectra taken in the next four days did not show significant variations, except some changes in the He II lines, while the N III/He II blend became stronger than H. All of these features are typical for a “He/N” nova during the permitted phase (see Fig. 2 in Williams 1992). Additionally, we took a 3-hours long time-series objective prism observation on May 30, but did not find significant changes.
Finally, the largest number of spectra addressed the evolution of the H line. Being the strongest emission line, it could be observed even in the fainter state in late June. Fig. 6 summarizes the line profile variations. The early quasi-Gaussian profile changed to a P-Cyg profile implying expansion velocities above 2000 km s-1. The broad wings extend to 3000-4000 km s-1 suggesting an early FWZI of 8000 km s-1. The detected 200 Å wide region prevented obtaining a proper FWZI-curve as has been presented for U Sco by Munari et al. (1999) and Anupama & Dewangan (2000), but parallel to the shape variations, the H line became slightly narrower. The strongest line profile change occured between day +21 and +33, when the saddle-shaped profile formed with two maxima at 1100 km s-1.
We have also tried to find short-term variations in the line profile by taking 8 spectra in a 3-hours long period on June 6, but the attempt has failed.
The presented spectra will be compared with other RNe in Sect. 6, here we only mention that the observed behavior is very similar to other U Sco-type RNe (U Sco, V394 CrA), only the time scales are different.
4 The interstellar reddening
As has been noted firstly by Liller (2000), CI Aql suffers from a significant amount of interstellar reddening. Since the most interesting parameters of a nova system depends criticially on the inferred luminosity, and consequently, the distance, an accurate determination of the colour excess and visual extinction is highly desirable. Several spectroscopic methods using absorption features originating from the interstellar matter in the line of sight exist (see, e.g. Jenniskens & Désert 1994, Munari & Zwitter 1997, Oudmaijer et al. 1997), though these methods suffer from significant limitations. For instance, the Na I D doublet provides reliable excesses only in the moderately reddened region (up to E(BV)=04, Munari & Zwitter 1997). Some of the diffuse interstellar bands (DIBs) provide good reddenings (e.g. DIB 5849, Oudmaijer et al. 1997), while other give only rough estimates. The internal consistency is in the order of 01–02 even in the best cases, therefore, a certain amount of uncertainty cannot be exceeded.
We have surveyed all of the medium resolution spectra to identify possible DIBs taken from the list of Jenniskens & Désert (1994). We have unambiguously find DIB 5849 and 6613. Their equivalent widths () was measured using the IRAF task splot. The resulting values are: Å and Å. Unfortunately, the latter is slightly affected by a telluric line at 6612 Å, that is why its width has a larger uncertainty. Jenniskens & Désert (1994) gave the following ratios for the /E(BV): 0.048 (err. 0.008) for 5849 and 0.231 (err. 0.037) for 6613. The corresponding reddenings are E(BV) and E(BV). The interstellar line Ca II 3933.66 can be also used through the empirical relationships between the width of DIB 5780 and interstellar lines (see Table 2 in Jenniskens & Désert 1994). Therefore, although we have not detected DIB 5780, we could convert the measured Ca II equivalent width to which resulted in an E(BV)=066030.
In the case of CI Aql the Na I D doublet is of lower significance due to the saturation effects. Interestingly, as has been noted by the referee, there is an apparent difference between the strength of Na I D lines obtained by us and that of Greiner et al. (1996), i.e. the latter data suggest a weaker, unresolved doublet. A real difference would query the interstellar origin of this resonance line and the whole reddening estimation should be reconsidered. We attribute this phenomenon to the lower resolution of that spectrum by Greiner et al. (1996), because a close inspection of their Fig. 1 reveals a broad (15 Å) single Na I D line. We could reproduce this kind of appearance with a resampling and Gaussian convolution of our spectrum mimicking the same resolution as quoted by Greiner et al. (about 1 Å FWHM). However, we cannot solidly exclude the possibility of other origin, e.g. some kind of circumstellar absorption. The measured equivalent widths are Å and Å. Their ratio is 1.10, far from the theoretically expected 2.0 at the lowest optical depths, but exactly what is found for the asymptotic behaviour at high reddenings (Munari & Zwitter 1997). If one checks the relation between equivalent width and reddening presented in Fig. 2 in Munari & Zwitter (1997), only a weak and approximative conclusion can be drawn as 08E(BV)15.
Further constraints on the reddening are provided by the published colour measurements. Hanzl (2000) gave BV= on May 7.03 UT (t = +2 d), while Jesacher et al. (in Wilson et al. 2000) presented BV=082 on May 10.97 UT (t = +6 d). The BV colour of novae around maximum tends to be about BV= with a significant dispersion of (Warner 1995). The resulting reddening lies between 046–059 mag (with 006 formal error). Two magnitudes down from maximum the dispersion decreases, therefore the relation (BV)00 can be also used. There are a few BV CCD photometric measurements in the VSNET database obtained in early June, resulting in again a reddening about 05. However, three prominent emission complexes are covered by the standard V passband (N II 5679, He I 5876/Na I D, H), therefore we consider these colour measurements to be heavily affected by the presence of such strong emission. It is difficult to say which reddening is more reliable. In the following discussion we adopt the unweighted mean of spectroscopic values which is 08503 (formal error). Despite the limitations of using interstellar lines, their observational data are much less affected by the nova itself as in the case of multicolour photometry.
5 The light curve
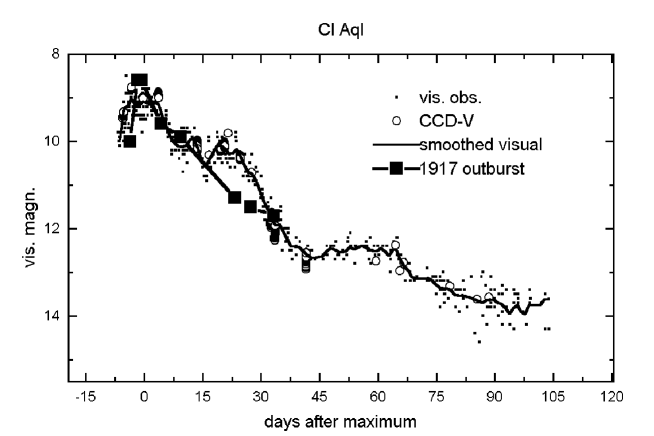
In order to estimate the light curve parameters (epoch of maximum, rates of decline), we used the CI Aql record in the VSNET archive (this data also includes the observations published in the IAU Circulars). It contains 2309 individual data points between April 28 and August 16, 2000 (1737 CCD observations and 572 visual estimates). We plot the light curve in Fig. 7. The epoch of maximum was determined by fitting a low-order polynomial around the top of the light curve, while t2 and t3 were read off from the smoothed light curve (see Fig. 7). The derived parameters are: t (2000 May 5.0 UT), t days, t days. Consequently, CI Aql is a moderately fast nova. The apparent magnitudes in maximum (90) and minimum (16 mag) give a considerably low outburst amplitude of 7 mag. We plotted also the light curve of the 1917 outburst determined by Williams (2000) in Fig. 7. The similarity is evident, though a significant deviation is suggested at t = +20 d, when an additional brightening occured in 2000. The maxima were at similar brightness, but later differences as high as 2 mag can be found. Recent t2 (30 d) differs significantly from that of in 1917 (18 d) which is entirely due to a plateau of the light curve of the 2000 outburst. Consequently, t3 appears to be more reliable indicator of the rate of decline.
Three maximum magnitude versus rate of decline (MMRD) relations were used to calculate visual absolute magnitude (Della Valle & Livio 1995, Capaccioli et al. 1989 and Schmidt 1957). They result in 74, 73 and 76. The constant absolute magnitude 15 days after the maximum (Capaccioli et al. 1989) gives 71. Their simple mean is M (formal error). However, the true uncertainty could be much larger as even the applicability of MMRD relations for the RN outburst can be questionned (e.g. the outbursts of U Sco are regularly underluminous compared to those of classical novae, Munari et al. 1999). Any meaningful luminosity value would need proper modelling of either the outburst or observations carried out in the quiescence, which is beyond the scope of this paper.
6 Discussion
The presented spectroscopic behaviour largely resembles other RNe in different phases. In the early phases of outburst broad emission lines dominated the spectra. The extensive wings reached FWZI8000-9000 km s-1 (Fig. 1 and Fig. 3). Later they became narrower. The low-resolution spectra covering the whole optical range show broad emission complexes 4500–4700, 4900–5100, 5600–5800, 5800–6000. Very similar spectra were obtained, e.g., for V394 CrA 5 and 6 days after maximum (Sekiguchi et al. 1989a, Williams et al. 1991, Williams 1992) and for U Sco at +1.45 days (Anupama & Dewangan 2000) and between +3 and +5 days (Munari et al. 1999). Interestingly, Munari et al. (1999) observed exactly the same change of He II lines at 8237 Å and 4686 Å in U Sco between +1.63 to +4.59 days (t2=2.2 days, t3=4.3 days) as has been found by us between +22 and +26 days (t2=30 days, t3=36 days). This fact suggests that the underlying physical mechanisms are similar.
The general appearance is typical for “He/N” spectra defined by Williams (1992). This gives further support to the statement of Williams (1992), that almost all novae with short recurrence times appear to have “He/N” type spectra (U Sco, V394 CrA, V745 Sco, V3890 Sgr, LMC 1990 No. 2). The interpretation of this classification was given by Williams (1992) in terms of different components in the ejecta. The broader lines of the “He/N” spectrum originate in a discrete shell, which is ejected at considerably high velocities from the white dwarf surface at the peak of outburst.
In our dataset there are some weak pieces of evidence for another interpretation. The fairly strong and broad Fe II 5169 line around the maximum raises the possibility that CI Aql belongs to the hybrid objects as discussed in Williams (1992). These stars have “Fe II” type spectra in the early phases that evolve to the “He/N” type. The very early (t = 7 d) low-resolution spectrum taken by W. Liller showed no evidence of Fe II lines (Yamaoka et al. 2000), while our spectrum a week later showed strong and broad Fe II 5169 emission (Fig. 1). Also, the intermediate resolution blue spectrum taken at +11 d (Fig. 2) is very similar to what is observed in Nova LMC 1988 No. 2 by Sekiguchi et al. (1989b). Williams (1992) suggested that this behaviour is caused by two distinct phases of the outburst. The “Fe II” spectra probably originate from discrete and massive shells, which are optically thick, thus causing the early photosphere to occur in the ejected shell. As the expanding shell(s) becomes optically thin, the spectrum change to the “He/N” type with more rectangular line shapes. The double-structured absorption in the P-Cyg profiles (Figs. 1 and 3) implies a quite complex inner structure of the ejecta, thus may strengthen the previous explanation.
The H evolution is also similar to what has been found in other RNe. Munari et al. (1999) presented a nice coverage between +0.64 d and +22.6 d for U Sco, in which the early saddle-like H split into three components with velocity separation of the order of 1600 km s-1. While the three components in the eclipsing system of U Sco are difficult to interpret in terms of collimated beams of material ejected at a large angle from the orbital plane, the two components of CI Aql can be explained with simple equatorial and polar rings of enhanced brightness in the ejected shell (Gill & O’Brien 1999). Since CI Aql is an eclipsing system, we see the hypothetic rings nearly edge-on. As has been pointed out by Gill & O’Brien (1999), the high inclination means that the least information on the shell structure can be derived from the line profiles.
Finally, the main conclusions of this paper can be summarized as follows:
-
•
Optical spectra taken between 0.6 and +53 d are presented and discussed. The overall appearance is similar to other recurrent novae, and consequently, the star belongs to the “He/N” type novae defined by Williams (1992). This means the lines originate from a discrete shell ejected by a velocity of 2000–2500 km s-1. Weak evidence for possible changing the type from “Fe II” to “He/N” is present in our dataset.
-
•
We identified two diffuse interstellar bands which were used to estimate the interstellar reddening. The saturated interstellar Na I D doublet supports the fairly high colour excess adopted to be E(BV)=08503.
-
•
The visual light curve was used to determine epoch of maximum light and rates of decline. The recent light curve was compared with that of in 1917 and significant differences were found. t3 appears to be a more reliable indicator of the decline.
Acknowledgements.
This research was supported by the “Bolyai János” Research Scholarship of LLK from the Hungarian Academy of Sciences, Hungarian OTKA Grant #T032258 and Szeged Observatory Foundation. The warm hospitality of the staff of the Konkoly Observatory and their provision of telescope time is gratefully acknowledged. The NASA ADS Abstract Service was used to access data and references. This research has made use of Simbad Database operated at CDS-Strasbourg, France.References
- (1) Anupama G.C., Dewangan G.C. 2000, AJ 119, 1359
- (2) Capaccioli M., Della Valle M., D’Onofrio M., Rosino L. 1989, AJ 97, 1622
- (3) Della Valle M., Livio M. 1995, ApJ 452, 704
- (4) Duerbeck H.W. 1987, Space Sci. Rev. 45, 1
- (5) Gill C.D., O’Brien T.J. 1999, MNRAS 307, 677
- (6) Gray D.F. 1992, Observations and analysis of stellar photospheres, Cambridge University Press, New York
- (7) Greiner J., Alcala J.M., Wenzel W. 1996, IBVS No. 4338
- (8) Hanzl D. 2000, IAUC No. 7444, 3
- (9) Jenniskens P., Désert F.-X. 1994, A&AS 106, 39
- (10) Mazuk S., Rudy R.J., Lynch D.K. et al., 2000, IAUC 7490, 2
- (11) Mennickent R.E., Honeycutt R.K. 1995, IBVS No. 4232
- (12) Munari U., Zwitter T. 1997, A&A 318, 269
- (13) Munari U., Zwitter T., Tomov T. et al. 1999, A&A 347, L39
- (14) Oudmaijer R.D., Busfield G., Drew J.E. 1997, MNRAS 291, 797
- (15) Reinmuth K. 1925, AN 225, 385
- (16) Schmidt T. 1957, Z. Astrophys. 41, 182
- (17) Sekiguchi K., Catchpole R.M., Fairall A.P. et al. 1989, MNRAS 236, 611
- (18) Sekiguchi K., Kilkenny D., Winkler H., Doyle J.G. 1989, MNRAS 241, 827
- (19) Szkody P., Howell S.B. 1992, ApJS 78, 537
- (20) Takamizawa K., Kato T., Yamamoto M. et al. 2000, IAUC 7409, 1
- (21) Warner B. 1995, Cataclysmic variable stars, Cambridge Univ. Press, Cambridge
- (22) Williams R.E., Hamuy M., Phillips M.M. et al. 1991, ApJ 376, 721
- (23) Williams R.E. 1992, AJ 104, 725
- (24) Williams D.B. 2000, IBVS No. 4904
- (25) Wilson J.C., Dunscombe K.R., Jesacher M.O. et al. 2000, IAUC No. 7426, 2
- (26) Yamaoka H., Ayani K., Shirakami K. et al. 2000, IAUC No. 7411, 1