The boron absorption line at 2089.6 Å in HD 140283 ? ††thanks: Based on observations made with the NASA/ESA Hubble Space Telescope, obtained at the Space Telescope Science Institute, which is operated by AURA, Inc., under contract NAS 5-26555
Abstract
We have observed the B i line at 2089.6 Å in the metal poor star HD 140283 with HST/STIS. The observation was an attempt to confirm the B abundances derived from the 2497 Å B i line in earlier works in general, and for for this star in particular (Edvardsson et al. 1994; Kiselman & Carlsson 1996). The resulting spectrum gained from 8 orbits of observations is hardly consistent with the boron abundance derived in the earlier works. A pure 10B line could produce the feature observed but no reasonable process can produce such a ratio between 10B and 11B. More likely the analysed feature is affected by a statistical fluctuation. A conservative upper limit estimate of the NLTE corrected boron abundance gives a value marginally consistent with that derived from the 2497 Å line. We are proposing further observations to derive a more definite abundance from the line.
Key Words.:
Stars: abundances – Stars: Population II – Stars: individual: HD 140283 – Galaxy: abundances1 Introduction
The abundances of the lightest elements and their isotopes play a well-known and important rôle in cosmology, for the early evolution of the Galaxy, and for the understanding of stellar evolution. Be and B abundances in the oldest stars have important implications for the spallative interactions between cosmic rays and the ISM which are thought to be mainly responsible for their production. There is, however, still no generally accepted model for the details of these mechanisms, and improved abundance determinations – especially for the extreme metal poor stars – are very important for the testing of different scenarios. In conjunction with measurements of Li abundances, Be and B also probe the convection zones and mixing processes in late-type stars.
In halo stars, all boron abundance determinations have so far been derived from the 2496.7 Å B i line. This is an attempt to improve this state of affairs by observations of the 2089.6 Å B i line in the well-known, bright halo dwarf star HD 140283 (BD -10 4149, HIP 76976, SAO 159459). This line has the extra virtue of showing an unusually large isotope shift between the two stable isotopes 11B and 10B, (25 mÅ, Johansson et al. 1993) which has already been used or tried for isotope-ratio determinations in the ISM and in galactic disk- or thick-disk stars. This will eventually also be possible for halo dwarfs.
2 Observations and data reductions
The observations were obtained with the Space Telescope Imaging Spectrograph (STIS) onboard the Hubble Space Telescope (HST) in February and April 1999 (proposal ID 7348). The STIS high-resolution echelle grating E230H, and the NUV-MAMA detector were used, providing a spectral resolution of 110,000 per resolution element. A total of 22 exposures of between 586 and 1120 seconds of length, with three different wavelength settings (to reduce influence of non-uniform detector sensitivity), and a total of 305 minutes exposure time were obtained for the wavelength region 2083 - 2092 Å. In between the two visits the detector had been shifted in the cross-dispersion direction (this is done monthly), which provided a total of six different positions on the detector for the line.
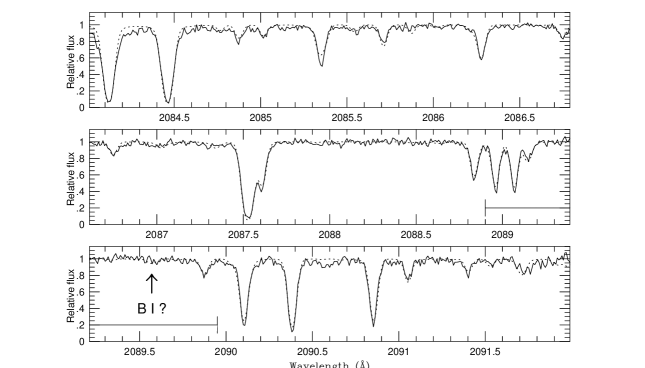
The STIS data reductions give calibrated spectra. The transformation to a relative flux scale was performed by division by a linear function, the slope of which was found by comparison with a synthetic spectrum, i.e., no nocal continuum “rectification” has been done. As seen in Fig. 1, the fit to the continuum is quite satisfactory, except possibly in the blue edge of the order.
The final S/N of the observed spectrum was estimated in the following manner: the total time-weighted flux spectra from visit 1 and visit 2 were added, and also subtracted to get the difference. The signal was measured in several different wavelength regions of the added spectra. The noise was measured in the same regions from the difference, by calculating the (resolution element) pixel to pixel standard deviation. By using the difference between the spectra, the effect of undetected weak lines on the noise are removed, leaving only the ’true’ noise. The signal divided by the rms noise gives our best estimate of the achieved S/N. Note that different parts of the detector and calibration frames were used in the two visits.
The final 2-pixel resolution-element S/N ratio obtained was , with a small variation between the different measurement sections. This value is close to what the WWW STIS Exposure Time Calculator presents, S/N . Part of the small difference could possibly be due to the shifting of the spectra and pixel interpolation to a uniform wavelength scale.
The calibrations were initially done with the calibration files available when the data was obtained, and later with the latest calibration files available from May 2000. No differences in the reduced spectra can be observed between the two calibrations.
3 Boron abundance analysis
A standard LTE abundance analysis was performed using a MARCS model atmosphere (Gustafsson et al., 1975; Asplund et al., 1997) with parameters K, , [Fe/H] , and km s-1 adopted from Edvardsson et al. (1994). The increased relative abundances of elements in metal-poor stars was accounted for by adopting [, where even-atomic-number elements from C to Ti were considered to be elements.
Basic atomic line data (wavelengths, excitation energies, oscillator strengths, radiation damping parameters and energy level designations) for atomic and singly ionized lines in the wavelength region 2083 - 2092 Å were obtained from the VALD data base (Piskunov et al. 1995; Ryabchikova et al. 1999; Kupka et al. 1999; and a large number of references therein). The treatment and parameters for “van der Waals” broadening was for most strong lines obtained from the publications of O’Mara and colleagues, see Barklem & O’Mara (1998, and references therein). For the remaining lines correction factors were applied to the classically derived parameters as detailed in Edvardsson et al. (1993). The line oscillator strengths were then modified to give a good general fit of the line absorption in the wavelength region.
Simultaneously with the line data fitting, the absolute wavelength scale of the observed spectrum was determined by fitting to the synthetic spectrum. The final agreement for most of the strong lines is very good, and deficiencies in the line list must be blamed for less god fits. We estimate that the resulting absolute wavelength scale is better than mÅ. We have not fitted all lines rigorously, e.g. the line at 2091.7 Å. Fig. 1 shows the fit of the wavelength-adjusted observed spectrum to the synthetic spectrum.
Wavelengths and oscillator strengths for B i lines, including isotopic shifts, were adopted from Johansson et al. (1993). As an exercise and check we repeated the LTE analysis of the 2496.7 Å B i line from Edvardsson et al. (1994), with identical result: (LTE). Corrections for the simplifying but erroneous assumption of LTE for boron for both the 2496.7 Å line (+0.52 dex) and the 2089.6 Å line (+0.61 dex) were adopted from Kiselman & Carlsson (1996, Table 3). Synthetic spectra with (LTE) are compared with the observations in Fig. 2. This corresponds to a corrected abundance of (NLTE). It should be noted that the differential NLTE correction of 0.09 dex between the two boron lines is quite insensitive to uncertainties in the NLTE analysis (Kiselman, 2000).
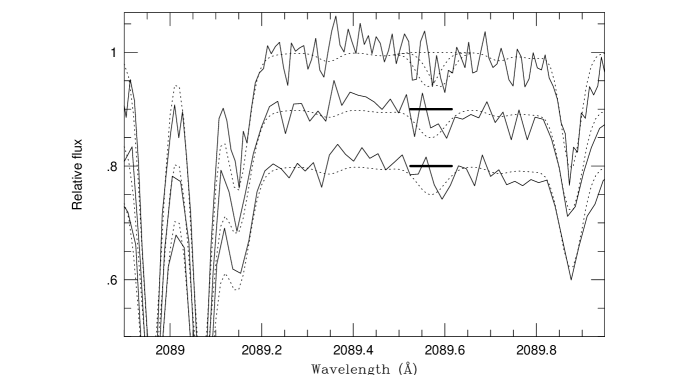
As seen in Fig. 2 we can not claim a detection of the boron feature. One might suspect a weak absorption near 2089.60 Å which would be best fit by a pure 10B line (the 25 mÅ isotope shift is indicated at the top of Fig. 2). We do not know, however, of any process which would be expected to produce predominantly 10B, and we consider the unexpected line position to be most probably due to a statistical fluctuation. We try instead to estimate an upper limit for the boron abundance: The width over which the expected boron feature should mainly depress the continuum is about 90 mÅ or 5 resolution elements (10 pixels). This region is indicated by the thick solid lines in Fig. 2. The integrated absorption equivalent width in this interval of the un-binned observed spectrum is 2.3 mÅ. With a per resolution element, we have for the line, which gives a equivalent width uncertainty of mÅ. From the discussion of the continuum level determination procedure and Figs. 1 and 2, we judge that the continuum level may at the most be wrong by 1.5%, which would correspond to 1.4 mÅ to the line. Adding these two uncertainties in quadrature makes an estimated equivalent width uncertainty of 1.6 mÅ. From these considerations we estimate that a upper limit of the equivalent width is mÅ. This value is just barely consistent with the abundance derived from the 2496.7 Å line by Edvardsson et al. (1994). Note, however, that the center-of-gravity of the possibly present feature is shifted by 25 mÅ from where it would be expected.
A simple Monte-Carlo simulation with 500 realizations of Gaussian noise added to a synthetic spectrum confirms the equivalent width uncertainty estimate above. It also indicates that a wavelength shift due to noise should be 30 mÅ.
In conclusion: The possible feature is about weaker and a little less than shifted in wavelength compared to the bona fide expected 4.0 mÅ equivalent width and position.
4 Systematic errors
Since our worries are mainly due to the different results from the two boron lines, we especially have to care about errors which may affect the strengths of the two weak boron lines differently.
The effective temperature scale for late-type stars is continuously under debate. For this particular star estimates differ by about 200 K. We find that even with a 200 K variation, the relative strength of the lines should not vary by more than 2%.
The continuous opacities in the UV region of cool stars are still under discussion. There are suggestions that we are lacking important opacity in e.g. the Sun (e.g Balachandran & Bell, 1998). The “missing opacity” is, however, generally ascribed to metals and therefore of importance mainly in metal-rich stars. HD 140283 is an extreme Pop II star (the metallicity is about 1/400 of that of the Sun), and uncertainties in the continuous metal opacity are unimportant.
Both lines emanate from the B i ground state, they are formed at similar optical depths, and have similar NLTE corrections. The possible errors in the NLTE calculations should also be similar for the two. Therefore such errors would have a small effect on this differential analysis. The relative NLTE effects are also quite insensitive to variations in for these model parameters (see Fig. 9 of Kiselman & Carlsson, 1996).
Any unknown line blending with the 2089.6 Å line would only worsen our “problem” and further decrease the boron abundance. A blend with the 2497 Å line on the other hand might explain our result. The effect of this would probably be that all stellar boron abundance determinations would have to be revised.
5 The line in HD 76932
The 2089.6 Å line was observed in the [Fe/H] thick-disk star HD 76932 by Rebull et al. (1998). The 2089.6 Å feature is strong in that star, actually stronger than expected from the 2497 Å line, even when NLTE corrections are not taken into account. The line position furthermore tends to suggest a 11B-rich feature. Both these findings are opposite to the ones we find for our extreme Pop II star. Rebull et al. suggest that there may be a blending line affecting the 2089.6 Å feature in HD 76932. If that is so, we see no traces of it in HD 140283.
6 Conclusions
We have used eight HST/STIS orbits to observe the 2089.6 Å B i line in HD 140283. The observed spectrum is only marginally consistent with the boron abundance found in previous determinations based on the 2496.7 Å B i line. We are proposing further HST/STIS observations to secure the detection of the 2089.6 Å B i line, as a very important check on all previous boron abundance determinations for halo stars.
Acknowledgements.
We thank Dr. Dan Kiselman for valuable discussions on boron-line formation and NLTE effects and also the referee Dr. Werner W. Weiss for valuable comments to the manuscript. Professor Bengt Gustafsson is thanked for helpful and enlightening discussions. The authors are supported by the Swedish Natural Sciences Research Council and the Swedish National Space Board.References
- (1) Asplund M., Gustafsson B., Kiselman D., Eriksson K. 1997, A&A 318, 521
- (2) Balachandran S.C., Bell R.A. 1998, Nature 392, 791
- (3) Barklem P.S., O’Mara B.J. 1998, MNRAS 300, 863
- (4) Edvardsson B., Andersen J., Gustafsson B., Lambert D.L., Nissen P.E., Tomkin J. 1993, A&A 275, 101
- (5) Edvardsson B., Gustafsson B., Johansson S.G., Kiselman D., Lambert D.L., Nissen P.E., Gilmore G. 1994, A&A 290, 176
- (6) Gustafsson B., Bell R.A., Eriksson K., Nordlund Å. 1975, A&A 42, 407
- (7) Johansson S.G., Litzén U., Kasten J., Kock H. 1993, ApJ 403, L25
- (8) Kiselman D., Carlsson M. 1996, A&A 311, 680
- (9) Kiselman D. 2000, private communication
- (10) Kupka F., Piskunov N.E., Ryabchikova T.A., Stempels H.C., Weiss W.W. 1999, A&AS 138, 119
- (11) Piskunov N.E., Kupka F., Ryabchikova T.A., Weiss W.W., Jeffery C.S. 1995, A&AS 112, 525
- (12) Rebull L., Duncan D., Johansson S., Thorburn J., Fields B. 1998, ApJ 507, 387
- (13) Ryabchikova T.A., Piskunov N.E., Stempels H.C., Kupka F., Weiss W.W. 1999, in Proc. of the 6th International Colloquium on Atomic Spectra and Oscillator Strengths, Victoria BC, Canada, 1998, Physica Scripta T83, 162