XMM-Newton observation of the Lockman Hole ††thanks: Based on observations obtained with XMM-Newton, an ESA science mission with instruments and contributions directly funded by ESA Member States and the USA (NASA)
We report on the first deep X-ray survey with the XMM-Newton observatory during the performance verification phase. The field of the Lockman Hole, one of the best studied sky areas over a very wide range of wavelengths, has been observed. A total of 100 ksec good exposure time has been accumulated. Combining the images of the European Photon Imaging Camera (EPIC) detectors we reach a flux limit of 0.31, 1.4 and , respectively in the 0.5-2, 2-10, and 5-10 keV band. Within an off-axis angle of 10 arcmin we detect 148, 112 and 61 sources, respectively. The log(N)-log(S) relation in the three bands is compared with previous results. In particular in the 5-10 keV band these observations present the deepest X-ray survey ever, about a factor 20 more sensitive than the previous BeppoSAX observations. Using X-ray spectral diagnostics and the set of previously known, spectroscopically identified ROSAT sources in the field, the new sources can be classified. XMM-Newton detects a significant number ( 40%) of X-ray sources with hard, probably intrinsically absorbed X-ray spectra, confirming a prediction of the population synthesis models for the X-ray background.
Key Words.:
Surveys – Galaxies: active – (Galaxies:) quasars: general – (Cosmology:) diffuse radiation – X-ray: galaxies – X-rays: general1 Introduction
Deep X-ray surveys indicate that the cosmic X-ray background (XRB) is largely due to accretion onto supermassive black holes, integrated over cosmic time. In the soft (0.5-2 keV) band 80-90% of the XRB flux has been resolved using ROSAT and recent Chandra surveys (Hasinger et al. 1998a , Mushotzky et al. mushotzky00 (2000), Giacconi et al. giacconi00 (2000)). In the harder (2-10 keV) band 25-30% of the background have been resolved in ASCA and BeppoSAX surveys (Ueda et al. ueda98 (1998), Cagnoni et al. cagnoni98 (1998), Giommi et al. giommi00 (2000)), and more than 60%, when the recent Chandra surveys are included. Surveys in the very hard (5-10 keV) band have been pioneered using BeppoSAX and resolve about 30% of the XRB (Fiore et al. fiore99 (1999)). Those X-ray surveys with a high degree of completeness in optical spectroscopy find predominantly Active Galactic Nuclei (AGN) as counterparts of the faint X-ray source population (Bower et al. bower96 (1996), Schmidt et al. schmidt98 (1998), Zamorani et al. zamorani99 (1999), Akiyama et al. akiyama00 (2000)), mainly X-ray and optically unobscured AGN (type-1 Seyferts and QSOs) but also a smaller fraction of obscured AGN (type-2 Seyferts). Spectroscopic identifications of the BeppoSAX and Chandra surveys are still far from complete, however a mixture of obscured and unobscured AGN seems to be the dominant population in these samples, too (Fiore et al. fiore00 (2000), Barger et al. barger00 (2000), Giacconi et al. giacconi00 (2000)). The most recent AGN X-ray luminosity function, derived from the ROSAT surveys, shows evidence for luminosity-dependent density evolution and indicates a constant QSO space density at redshifts (Hasinger hasi98b (1998), Miyaji et al. miyaji00 (2000)) unlike optical QSO luminosity functions (Schmidt et al. schmidt95 (1995), Fan et al. fan00 (2000)).
The X-ray observations are consistent with population synthesis models based on unified AGN schemes (Setti & Woltjer setti89 (1989), Madau et al. madau94 (1993), Comastri et al. comastri95 (1995), Gilli et al. gilli99 (1999)), which explain the hard spectrum of the X-ray background by a mixture of absorbed and unabsorbed AGN, folded with the corresponding luminosity function and its cosmological evolution. According to these models most AGN spectra are heavily absorbed and about 80% of the light produced by accretion will be absorbed by gas and dust (Fabian et al. fabian98 (1998)). However, these models are not unique and contain a number of hidden parameters, so that their predictive power remains limited (e.g. Hasinger hasi00 (2000)). In particular they require a substantial contribution of high-luminosity obscured X-ray sources (type-2 QSOs), which so far have not been detected in sufficient quantities (see the discussion in Halpern et al. halpern99 (1999)). The large throughput and the unprecedented hard X-ray sensitivity of the telescopes aboard the recently launched XMM-Newton observatory (hereafter XMM; Jansen et al. jansen01 (2001)) will ultimately yield spectra of the faint X-ray sources and constrain the evolution of their physical properties, in particular the X-ray absorption.
Here we present results of the first deep survey taken with XMM in the Lockman Hole, one of the best studied sky areas at all wavelengths. This paper concentrates on the X-ray data analysis. We show combined images from the EPIC pn-CCD (Strüder et al. strueder01 (2001)) and MOS CCD cameras (Turner et al. turner01 (2001)) and the derived source counts in different energy bands. With the help of X-ray colour-colour diagrams and the previously identified sources in this field we show that it is possible to obtain a coarse source classification based on XMM data alone.
2 X-ray observations
The Lockman Hole field, centered on the sky position RA 10:52:43, DEC +57:28:48 (2000) was observed with XMM in five separate revolutions (70, 71, 73, 74 and 81) during the period April 27-May 19, 2000 for a total exposure time of 190 ksec. The pointing direction was changed slightly (by about 10 in RA and DEC in order to bridge the gaps between the CCD detectors between exposures) and the roll angle varied in the range 48.66 to 54.25 degrees between the different revolutions. The EPIC cameras were operated in the standard full-frame mode. The thin filter was used for the PN camera, while the thin and the thick filter were alternated for the MOS1 and MOS2 cameras in order to obtain diagnostics about the soft proton particle background. Tab. 1 gives a summary of the observations.
The PN and MOS data were preprocessed by the XMM Survey Scientist Consortium (SSC; Watson et al. watson01 (2001)) using the XMM Standard Analysis System (SAS) routines. The attitude and deadtime information was not available for the datasets but can be regarded stable enough to be assumed constant for each revolution. The preprocessed FITS events files were analysed using FTOOLS routines.
A substantial fraction of the observations was affected by high and flaring background fluxes with count rates up to several hundred per second, compared to a quiet count rate of several counts per second per detector. The data were screened for low background intervals, rejecting times with a 0.5-10 keV count rate higher than 8 cts/s for the PN and 3 cts/s for each of the two MOS cameras. The remaining good time intervals added up to about 100 ksec (see Tab. 1). The actual exposure time for the three different detectors, pn-CCD, MOS1 and MOS2 were slightly different due to the varying start and end times of individual observations. A number of hot pixels and hot columns were removed interactively from the events lists by identifying them in images accumulated in detector coordinates and then spatially filtering them out of the datasets. An Al-Kα line at 1.5 keV is present in both detector types. The PN background spectrum shows in addition a strong Cu-Kα line at 8.1 keV, which is not present in the MOS background. PN photons in the energy range 7.9-8.3 keV have therefore been neglected in the further analysis.
| Date | Start | End | Dur. | Exp. | Filter | Filter |
|---|---|---|---|---|---|---|
| 2000 | [UT] | [UT] | [sec] | [sec] | MOS1 | MOS2 |
| 27.04 | 02:45 | 22:08 | 69761 | 31216 | thin | thick |
| 29.04 | 02:37 | 22:00 | 69761 | 28608 | thick | thin |
| 02.05 | 17:50 | 00:21 | 23512 | 12944 | thin | thick |
| 05.05 | 08:48 | 21:01 | 43961 | 4999 | thin | thick |
| 19.05 | 04:28 | 22:17 | 64109 | 21744 | thin | thick |
3 pn-CCD and MOS-CCD images
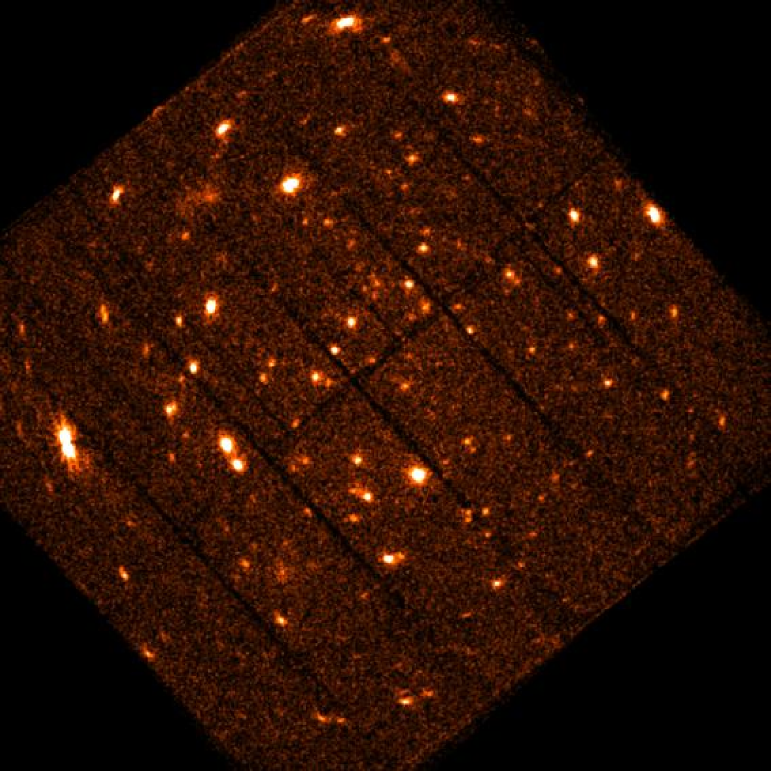
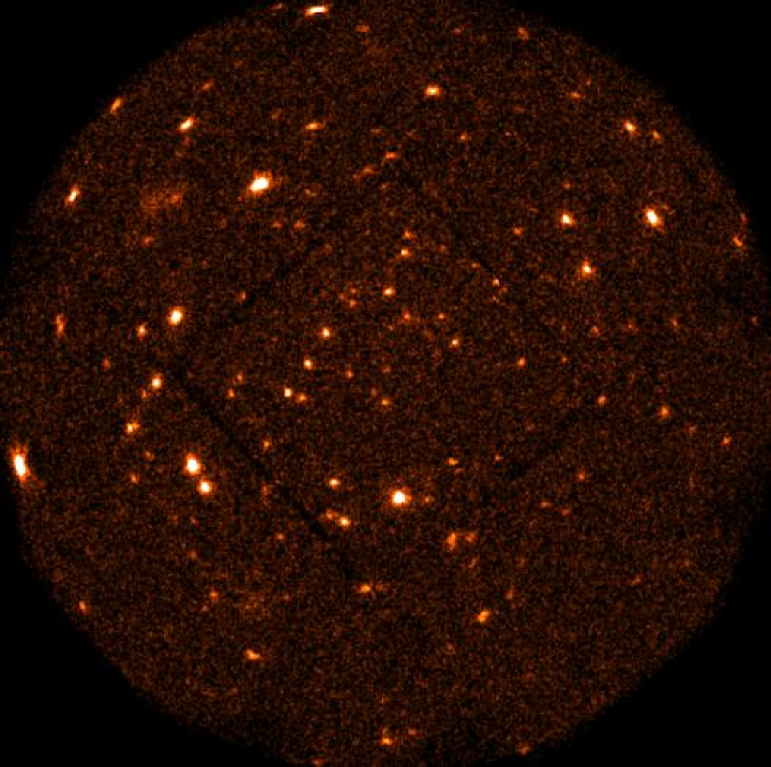
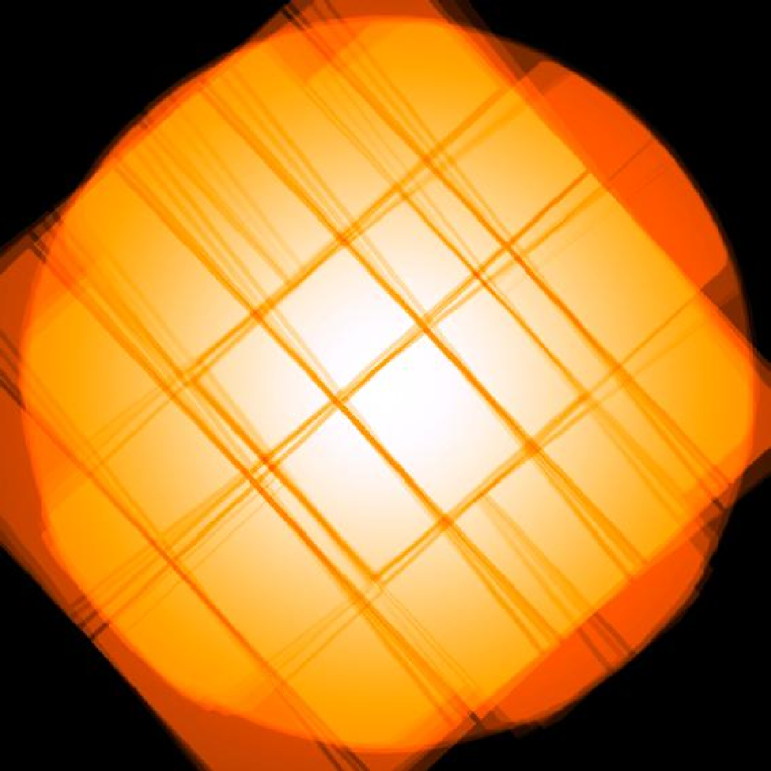
Images in celestial coordinates with a pixel size of 2 arcsec have been accumulated in the 0.5-7 keV band for all three detectors. Fig. 1 shows a comparison of the image from the PN (left) and the MOS1+MOS2 camera (right). Albeit the variation in pointing direction between different revolutions, the shadows of the inter-CCD gaps appear in the images due to an interference between the variations in pointing direction and roll angles. An exposure map was calculated for the combination of pn-CCD plus MOS1 and MOS2 cameras (Fig. 2a).
The brighter X-ray sources in the images have been already optically identified from the ROSAT data (Schmidt et al. schmidt98 (1998), Lehmann et al. lehmann00 (2000, 2001)). X-ray sources identified with point-like optical objects (i.e. AGN or stars) have been used to check and correct the astrometry of the images. Positions of the brighter X-ray sources were centroided by an elliptical 2D-Gaussian fit. The FWHM of the point spread function in the center of the field was found to be 8.9 and 7.7 arcsec for the PN and MOS images, respectively. The X-ray source centroid sky coordinates calculated from the WCS keywords were offset by 5-25 from the known optical counterparts. Thus a transversal shift and a rotation angle were fit for each dataset. For the PN, satisfactory fits were achieved by fixing the scale factor of the X-ray image to 1.0, leading to residual systematic errors to . For the MOS’s, introducing different scaling factors along the X- and Y-axes, in addition to the transversal shift and rotation, improved the fits significantly. This reflects the fact that the geometrical layout of the CCD chips in the MOS cameras had not yet been satisfactorily established. The Lockman Hole observations can be used to improve the knowledge of the layout, which then will be incorporated into future pipeline processings. For our current analysis, we use these ad-hoc corrections, which lead to residual systematic position errors of 1-3.


4 log(N)-log(S)
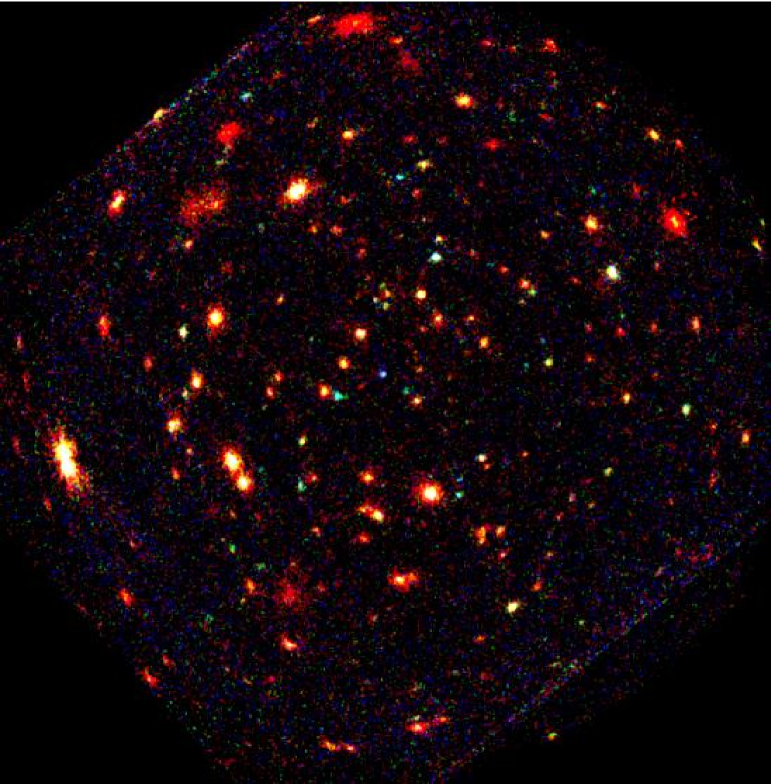
As the residual systematic errors after the application of these astrometric corrections are below the width of the point-spread function, we could co-add the images of the different cameras. Combined PN+MOS1+MOS2 images were accumulated in the bands 0.2-0.5 keV, 0.5-2 keV, 2-4.5 keV and 4.5-10 keV, respectively. Fig. 2b shows the exposure-corrected image of all cameras combined in an X-ray “real-colour” representation. The red, green and blue colours refer to the 0.5-2, 2-4.5 and 4.5-10 keV images, respectively. A population of green and blue objects is showing up in this image, i.e. obscured faint X-ray sources which have been postulated by the X-ray background population synthesis models. There are several diffuse sources with red colours which are X-ray clusters of galaxies already identified from the ROSAT data (Schmidt et al. schmidt98 (1998), Hasinger et al. 1998b , Thompson et al. thompson00 (2000)).
The SAS source detection algorithms have been applied to the data. These are an improved variant of the ROSAT source detection algorithms described in Hasinger et al. (1998a ) consisting of simple sliding window box detection algorithms, using either a local background estimate (LDETECT) or a background map derived from the images smoothed by a bi-cubic spline function after bright sources have been removed (MDETECT) as well as a multi-ML source detection and parameter estimation task. The main improvement for the XMM data is, that these algorithms are run simultaneously for several independent energy bands, keeping the source positions and extent fixed for all energy bands, while adding the source existence likelihoods from the individual energy bands together. This improved algorithm is both more sensitive and less subject to source confusion and yields source count rates in all energy bands.
Source detections were accepted with likelihood values above 10 (about 4) and inside an off-axis angle of 10 arcmin. The resulting detection statistics are given in Tab. 2. The raw source count rates have been converted to X-ray fluxes by applying a correction for vignetting (up to a factor of 2 at an off-axis angle of 10) and dead time plus out of time events (assumed to be 8% for the combination of all three detectors) as well as the counts-to-flux conversion factor (ECF) according to Tab. 2. The average energy conversion factors for the whole observation have been computed using the most recent response matrices weighted with the respective exposure times for the three different detectors. The vignetting function has been assumed to depend linearly on off-axis angle, while the azimuthal dependence expected for the MOS cameras has been ignored. Due to the still preliminary status of the current EPIC calibration and the simplifying assumptions made here we have to assume systematic flux errors on the order of 10% in addition to the uncertainty due to the range in possible photon indices (see Tab. 2).
| Banda | b | d | e | f | |
|---|---|---|---|---|---|
| 0.2-0.5 | 2.00.5 | 7.161.01 | 0.40 | 120 | 1380 |
| 0.5-2 | 2.00.5 | 10.200.04 | 0.31 | 148 | 1800 |
| 2-10 | 2.00.5 | 1.790.40 | 1.4 | 112 | 1400 |
| 5-10 | 1.60.5 | 1.280.11 | 2.4 | 61 | 1060 |
a energy band in keV in which the flux is given (see text)
b assumed range in photon index
c energy conversion factor in cts s-1 per
d minimum detected flux in
e number of sources detected within 10 arcmin radius
f source density in deg-2
The corresponding cumulative log(N)-log(S) distributions are shown in Fig. 3. In the soft band (0.5-2 keV) the data reach a flux limit about a factor of three deeper than the ROSAT HRI survey (Hasinger et al. 1998a ), and are about 50% less sensitive than the recent Chandra surveys (Mushotzky et al. mushotzky00 (2000); Giacconi et al. giacconi00 (2000)). In the 2-10 keV band the XMM data are as deep as the published Chandra surveys. In the very hard 5-10 keV band, which has been pioneered by the BeppoSAX observations (Fiore et al. fiore99 (1999)), XMM is entering new territory, reaching more than a magnitude deeper than BeppoSAX. As described above, the flux conversion still has to be regarded as uncertain by at least 10%. Also no corrections for confusion or Eddington biases have been made yet (see e.g. discussion in Hasinger et al. 1998a ). Nevertheless, the comparison of the XMM source counts with the Chandra and ROSAT data, in particular in the 0.5-2 keV band, indicates that confusion is not a severe problem for the source counts.


5 X-ray colour-colour diagrams
The unprecedented combination of high throughput and wide energy band makes XMM uniquely suited to classify sources based on their X-ray spectra alone. The large number of X-ray sources in the Lockman Hole which already have spectroscopic identifications and redshifts based on the ROSAT surveys can be used as a training set for the classification of the still unidentified XMM sources in the Lockman Hole, but also in other XMM fields.
From the count rates in the four independent energy bands used for source detection (see Sect. 4) we have calculated three statistically independent hardness ratios, HR1, HR2 and HR3, according to the formula , where and correspond to the counts in the harder and softer energy bands, respectively (see Tab. 2). Fig. 4 shows two X-ray colour-colour diagrams with different symbols for various source classes superposed on a model grid for absorbed power law spectra. The type-1 AGN known from ROSAT populate a narrow, relatively soft range in both diagrams, consistent with a photon index of and typically low apparent absorption column densities (). The new XMM sources, together with a number of previously known type-2 ROSAT AGN scatter over a much wider area. Although the new XMM sources are typically fainter than the ROSAT sources and therefore have larger hardness ratio errors, the new population is considerably harder in both diagrams. A comparison of the source colours with the underlying model grids shows, that the hardening is mainly due to apparent absorption column densities of on top of relatively soft spectra and not due to intrinsically hard power law indices. Some sources fall outside the model grid. In one case, a ROSAT Seyfert-2 galaxy which shows the largest HR3, this is probably due to a very soft component on top of a heavily absorbed power law. In some cases the hardness ratios might be affected by source confusion.
6 Discussion and Conclusions
We have shown the first log(N)-log(S) relations based on the XMM-Newton observatory. Given the still existing systematic uncertainties, the data is fully consistent with the ROSAT and Chandra source counts in the 0.5-2 keV band. This demonstrates on one hand that the combination of EPIC detectors is not yet confusion limited in a 100 ksec observation, on the other hand that cosmic variance between different fields does not affect the source counts significantly at the currently achieved flux levels, at least not in the soft band. In the 2-10 keV band there is an inconsistency of about 40% between the two recent Chandra datasets by Mushotzky et al. mushotzky00 (2000) and Giacconi et al. giacconi00 (2000), the latter one having a lower normalisation. The new XMM data are consistent with the Giacconi et al. log(N)-log(S), maybe even somewhat flatter, and clearly confirm a break in the slope compared to the quasi-Euclidean behaviour at brighter fluxes. In the 5-10 keV band the XMM data go more than an order of magnitude deeper than the previous BeppoSAX counts (Fiore et al. fiore99 (1999)). There is so far relatively little deviation from a Euclidean slope and the data is fully consistent with the predictions from recent population synthesis models for the X-ray background (Gilli et al. gilli99 (1999)). Adding up the source counts, we resolve about 60% of the 5-10 keV X-ray background.
The diagnostic power of XMM lies in its wide energy band and its unprecedented sensitivity in the hard band. With the help of X-ray colour-colour diagrams and the “training set” of about 60 previously identified ROSAT sources in the same field it is possible to characterise the new XMM sources as typically harder, probably intrinsically absorbed sources. A small number of objects with similar X-ray colours has already been identified in the deepest ROSAT survey (Lehmann et al. lehmann00 (2000)), they are type-2 Seyferts or unidentified objects with extremely red optical/NIR colours (). The new XMM source population is therefore very likely dominated by obscured AGN, as predicted by the AGN population synthesis models for the X-ray background.
Acknowledgements.
We thank the whole XMM-Newton team for providing such a wonderful observatory and producing well-calibrated data at an early time in the mission. We thank R. Gilli for providing the model prediction in Fig. 3. We acknowledge very useful coments by the referee, G. Zamorani. Part of this work was supported by the German Deutsches Zentrum für Luft- und Raumfahrt, DLR project numbers 50 OX 9801 and 50 OR 9908.References
- (1) Akiyama M., Ohta K., Yamada T. et al. 2000, ApJ 532, 700
- (2) Barger A.J., Cowie L.L., Mushotzky R.F., Richards E.A., 2000, ApJ (submitted) [astro-ph/0007175]
- (3) Bower R., Hasinger G., Castander F.J. et al., 1996, MNRAS 281, 59
- (4) Cagnoni I., della Ceca R., Maccacaro T., 1998, ApJ 493, 54
- (5) Comastri A., Setti G., Zamorani, G., Hasinger G., 1995, A&A 296, 1
- (6) Fabian A.C., Barcons X., Almaini O., Iwasawa K., 1998, MNRAS 297, L11
- (7) Fan X., Strauss M.A., Schneider D.P. et al., 2000, AJ, (in press) [astro-ph/0008123]
- (8) Fiore F., La Franca F., Giommi P. et al., 1999, MNRAS 306, L55
- (9) Fiore F., La Franca, Vignali C. et al., 2000, [astro-ph/0003273]
- (10) Giacconi R., Rosati. P., Tozzi P. et al., 2000, ApJ (submitted), [astro-ph/0007240]
- (11) Gilli R., Risaliti G., Salvati M., 1999, A&A 347, 424
- (12) Giommi P., Perri M., Fiore F., 2000, A&A (in press), [astro-ph/0006333]
- (13) Halpern J.P., Turner T.J., George I.M., 1999, MNRAS 307, L47
- (14) Hasinger G., Burg R., Giacconi R. et al., 1998a, A&A 329, 482
- (15) Hasinger G., 1998, AN 319, 37
- (16) Hasinger G., Giacconi R., Gunn J.E. et al., 1998b, A&A 329, 482
- (17) Hasinger G., 2000, Nature 404, 443
- (18) Jansen F., Lumb D., Altieri B. et al., 2001, A&A 365 (this issue)
- (19) Lehmann I., Hasinger G., Schmidt, M. et al., 2000, A&A 354, 35
- (20) Lehmann I., Hasinger G., Schmidt, M. et al., 2001, A&A (in prep.)
- (21) Madau P., Ghisellini G., Fabian A.C., 1994, MNRAS 270, L17
- (22) Miyaji T., Hasinger G., Schmidt M., A&A 353, 25
- (23) Mushotzky R.F., Cowie L.L., Barger A.J., Arnaud K.A., Nature 404, 459
- (24) Perri M., Giommi P., 2000, A&A Letters (in press) [astro-ph/0006298]
- (25) Setti G. & Woltjer L., 1989, A&A, 224, L21
- (26) Schmidt M., Schneider D.P., Gunn J.E., 1995, AJ 110, 68
- (27) Schmidt M., Hasinger G., Gunn J. et al., 1998, A&A 329, 495
- (28) Strüder L., Briel U., Dennerl K. et al., 2001, A&A 365 (this issue)
- (29) Thompson D., Hasinger G., Pozzetti L. et al., 2000, A&A (in prep.)
- (30) Turner M., Abbey A., Arnaud M. et al., 2001, A&A 365 (this issue)
- (31) Ueda Y., Takahashi T., Inoue H. et al. 1999, ApJ, 518, 656
- (32) Watson M., Auguères J-L., Ballet J. et al., 2001, A&A 365 (this issue)
- (33) Zamorani G., Mignoli M., Hasinger G. et al., 1999, A&A 346, 731