Radio Observations of High Redshift Star Forming Galaxies 11institutetext: NRAO, Socorro, NM, 87801, USA
Radio Observations of High Redshift Star Forming Galaxies
Abstract
I summarize recent results from radio observations of high redshift star forming galaxies, discuss radio continuum emission as a measure of star formation rate, and consider future capabilities at cm to IR wavelengths.
1 Radio surveys to Jy sensitivity
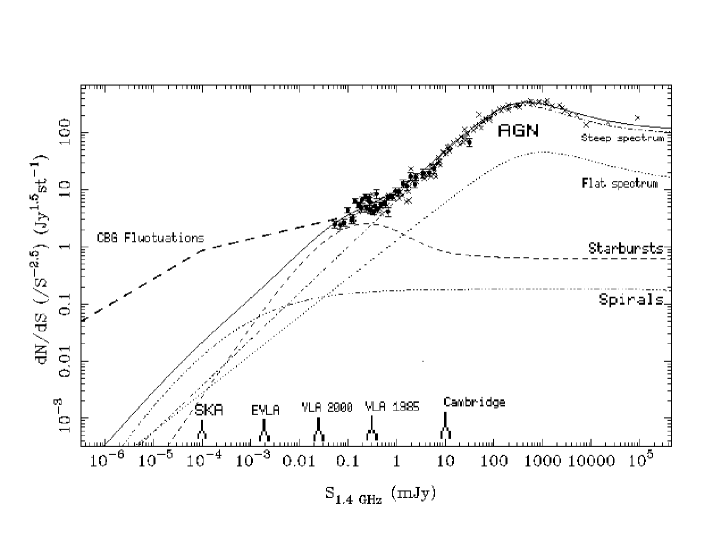
Source counts based on low frequency surveys of the sky with Jy sensitivity showed a significant departure from a Euclidean, non-evolving source population, indicating, for the first time, cosmic evolution in a source population. The source population entailed luminous radio galaxies, with spectral luminosities at 178 MHz: ryle ; jauncey . In these sources the synchrotron radio emission is from high energy electrons accelerated in a relativistic jet emanating from the active galactic nucleus (AGN)bartel .
Subsequent observations with sub-mJy sensitivity, starting with the WSRT and continuing with the VLA windhorst , revealed flattening of the source counts below 5 mJy (Fig. 1). Windhorst et al. hypothesized that this flattening was due to a new population of sources, namely star forming galaxies with . The radio emission in these sources is from relativistic electrons accelerated in supernovae remnant shockscondon .
There has been a recent revival of deep radio surveys, motivated in large part as follow-up to deep optical, infrared, and (sub)mm surveys richards ; hopkins ; garrett ; owen . The frequency of choice is 1.4 GHz for these deep surveys, allowing for Jy sensitivity with arcsecond resolution and a wide field of view (FWHM = 30′). In the coming years the Expanded VLA (EVLA) will push to the sub-Jy level, while in the coming decades the Square Kilometer Array (SKA) will potentially probe nJy sources. As pointed out in numerous papers in these proceedings (Bertoldi, Adelberger, Hughes, Sanders), radio observations play an important, complimentary role to observations at other wavelengths, in that:
-
•
They are not plagued by extinction corrections.
- •
-
•
Low order CO transitions redshift into the cm bands, revealing large reservoirs of less dense, cooler gas papadopoulos ; menten . This topic will not be discussed herein.
-
•
They provide arcsecond astrometry and imaging, thereby avoiding the confusion problems inherent in deep searches for optical counterparts of (sub)mm sources discovered in low resolution single dish bolometer array surveys.
For example, at the optical limits of the HDF () one expects, by chance, three faint galaxies within the 6′′ error circle of a typical SCUBA or MAMBO sourcelilly . At 1.4 GHz the source counts between 40 Jy and 1 mJy obey: arcsec-2, with S1.4 in mJyrichards . The number of spurious Jy sources within the error circle is only 0.02.
Since deep radio images are usually follow-up observations of deep fields at other wavebands, there has been very rapid progress in determining the nature of the parent galaxies of the Jy radio source population richards ; haarsma . This short summary will focus on recent results on the Jy radio source population, emphasizing the unique information about high redshift star forming galaxies coming from radio observations. I will also discuss the radio-to-far infrared (FIR) correlation, re-deriving star formation rates based on this correlation, and conclude with a short discussion of future instrumentation.
Richards richards finds that 75 of the SJy radio sources are identified to , with a median of . Interestingly, he also finds that 25 of the sources are unidentified to . And perhaps more interestingly, a number of groups richards ; barger99 ; bertoldi1 ; chapman find that (sub)mm observations of these Jy radio sources with faint (or absent) optical counterparts results in a detection rate at mJy levels. This suggests that the optically faint, Jy radio sources are equivalent to the mJy (sub)mm source population.
Haarsma et al. haarsma have used an extensive spectroscopic and photometric redshift analysis to determine the redshift distribution of the Jy radio source population. They find that (roughly):
-
•
50 of the sources are spirals, or irregular galaxies, at .
-
•
25 are ellipticals, presumably low luminosity AGN, at .
-
•
25 are optically faint (or absent), and red.
They propose that these later sources are likely to be high redshift (), dust obscured starbursts. This idea is consistent with the SCUBA and MAMBO results discussed above richards ; barger99 ; bertoldi1 ; chapman .
The angular size distribution of the Jy radio source population remains a point of debate. WSRT observations of the HDF at 1.4 GHz, 15′′ resolution, to 8Jy rms detect a number of sources not detected in the VLA survey at similar sensitivity but with 1′′ resolution garrett . This would suggest a significant population of sources larger than 1′′. However, confusion is a serious issue at this sensitivity level at 15′′ resolution. Combined MERLIN+VLA observations of the HDF suggest that most of the sources have angular sizes between 0.7′′ and 2′′, with a median of 1.4′′ (Muxlow et al. in prep). On the other hand, VLA observations of the cluster A2125 suggest that most of the sources are unresolved, with upper limits of typically 1′′owen . If the sources are indeed 1′′ in size, this presents a significant problem for the SKA, since the sky will become naturally confusion limited at the few nJy level, independent of the resolution of the instrument hopkins , well above the sensitivity of the SKA.
Richards richards finds that the mean spectral index for a 1.4 GHz selected sample of sources is –0.8, typical of star forming galaxies. Not surprisingly, an 8 GHz selected sample shows a flatter mean spectral index of –0.4.
Barger et al. barger99 find that only 15 of the radio sources with SJy in the Hawaii Deep Field are X-ray sources with 2 to 10 keV fluxes of: erg s-1 cm-2. This result is consistent with the idea that the majority of Jy radio sources are star forming galaxies.
One problem with deep radio surveys is the limited area covered, such that cosmic variance can lead to substantial differences between counts derived for different fields. For instance, the counts at the 100 Jy level in the Phoenix Deep Field hopkins are a factor two higher than those in the Hubble Deep Field richards . This variance can be seen as the increased scatter below 1 mJy in Fig. 1.
2 The FIR-radio correlation: deriving star formation rates from radio observations and the importance of inverse Compton losses
Most recent derivations of star formation rates based on radio observations haarsma ; cram ; mobasher use equs. 21 and 23 in Condon condon to relate the star formation rate (SFR) to the 1.4 GHz spectral luminosity. This relationship was derived from the supernova rate and the integrated radio luminosity of the Milky Way.
An alternate method for deriving the relationship between radio luminosity and SFR relies on the tight correlation between FIR luminosity and radio luminosity in star forming galaxies condon . This correlation is remarkable in the small scatter observed over at least three orders of magnitude in FIR luminosity. Further, it holds for optical and IR selected samples yin . This alternate method uses spectral synthesis models for star forming galaxies leitherer , assuming a fraction, , of the bolometric luminosity is absorbed by dust and re-emitted in the infrared, and then uses the FIR-radio correlation to relate the radio luminosity to the FIR luminosity. For a 108 yr continuous starburst, solar abundances, a Salpeter IMF from 0.1 to 100 M⊙, and = 1, this calculation leads to:
where L1.4 is the 1.4 GHz spectral luminosity in W Hz-1. Scaling to the same IMF limits, this equation implies a factor 2.5 lower SFR than the equations in Condon condon .
There are a number of uncertainties in both calculations. In the case of Condon’s calculation the Galactic supernova rate and radio continuum luminosity are both uncertain by at least 50. For the stellar synthesis model calculation, the scatter in the FIR-radio correlation leads to a 50 uncertainty, while changing parameters in the starburst model changes the predicted SFR, eg. decreasing the starburst age to 107 years increases the SFR by 50, and there is the uncertain . It is currently not clear which, if either, calculation is correct. Indeed, the relative agreement is encouraging, given the very different metods. And given the different conditions in different galaxies (eg. the age of the starburst, the dust covering factor, the IMF, …), it is clear that there will be no globally correct relationship, only a statistically most likely one.
The FIR-radio correlation has a very simple heuristic explanation: both the FIR and radio emission relate to massive star formation, with the FIR coming from dust heated by the interstellar radiation field, and the relativistic electrons being accelerated in supernova remnant shocks. However, given the number of processes and parameters involved, it remains remarkable, and as yet unexplained, as to why the correlation is so tight condon ; duric . For instance, it has long been known that the total radio luminosity of galaxies, both normal disks and nuclear starbursts, is an order of magnitude larger than that expected from the sum of the supernovae condon ; pooley , although see colina . This requires that the relativistic electrons be stored in the ISM of galaxies for a timescale, , where UB is the magnetic energy density.
This leads to the question of the importance of inverse Compton losses off the microwave background for relativistic electrons in the ISM of high redshift galaxies. The energy density in the microwave background increases as: . This is shown in Fig. 2, along with the energy density in the magnetic field in a typical spiral arm beck . The energy density in the magnetic field is larger than that in the microwave background to . Beyond this redshift, inverse Compton cooling will dominate over synchrotron radiation, limiting electron lifetimes, t1.4, and leading to a departure from the radio-FIR relation.
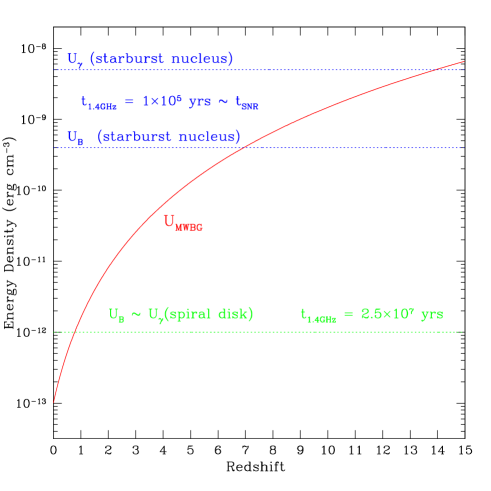
This is not true, however, for compact nuclear starburst galaxies, ie. systems with SFRs M⊙ year-1 in regions smaller than a few hundred parsecs Solomon . In these systems the energy density in the magnetic field is thought to be almost three orders of magnitude larger than in the disk Taylor99 , in which case only becomes relevant at . But compact nuclear starbursts raise a different, related problem: the energy density in the IR radiation field from the starburst itself is larger still than that in the magnetic field. This means that inverse Compton cooling should remove the synchrotron emitting electrons on fairly short timescales ( yr), and accentuates the question: why do nuclear starbursts follow the radio-FIR correlation? There is a large body of literature on this issue condon , but as yet no closure. Hence, we trade one problem, inverse Compton losses off the microwave background at high , for a second, inverse Compton losses off the starburst IR radiation field at all .
Until proven otherwise, we adopt the radio-FIR correlation as a given, and see how it can be used in the study of high star forming galaxies.
3 Using the radio-FIR correlation to study high star forming galaxies, and what the future holds
Haarsma et al. haarsma have derived the cosmic star formation rate density (SFRD) vs. based on Jy radio samples. They find a steep rise in the density from to , as has been found in optical and IR studies. But they also find a systematically higher SFRD at all redshifts by a factor 3 relative to reddening corrected optical studies. This suggests that even larger dust corrections are needed in optical studies, or that optical studies miss a large population of dust-obscured galaxies. However, they use the equations in Condon condon to derive SFRs from radio continuum luminosities. If we use equ. 1 above instead, the radio derived values agree well with the optical values.
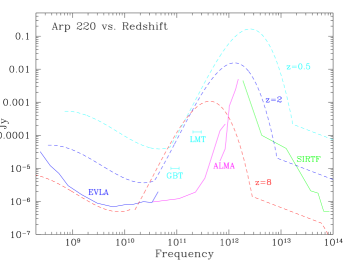
A second area in which the radio-FIR correlation has been used in the study of high star forming galaxies is as a redshift indicator yun99 ; yun00 ; blain ; dunne ; low ; hughes ; barger99 . The impetus in this case is the very faint optical counterparts being found for most faint (sub)mm sources, thereby precluding follow-up optical spectroscopy of a large sample of sources. The radio-FIR method relies on the opposing slopes of the synchrotron and thermal dust emission in star forming galaxies. Our most recent models use the average observed SED for nearby starbursts to relate redshift to the observed spectral index between 350 GHz and 1.4 GHz yun00 . Figure 3 shows the model, along with a few sources with known redshifts, including sources with AGN and starburst optical spectra. The method is admittedly imprecise, especially at high redshift, and there are a few degeneracies in the solutions, such as the addition of cold dust or the presence of a radio loud AGN blain , but it is the only viable alternative for deriving redshifts for the large majority (90) of the faint (sub)mm sources. The redshift distribution for the faint (sub)mm source population as derived using the curves from yun00 can found in the contribution by Bertoldi in this volume.

An important point concerning radio follow-up observations of faint (sub)mm sources is the relative sensitivities. Comparing MAMBO images with deep radio images shows that 70 (10 of 14) of the mJy (5) sources at 250 GHz have radio counterparts with Jy within 3′′ (Bertoldi, this volume). We expect only 0.2 chance coincidences. This result lends confidence to the reality of the MAMBO detections. It also implies that the current sensitivity of deep VLA fields is well matched to that obtained with mm bolometer arrays, and in particular, that there is not a dominant population of very high sources (), or of low , cold dust sources.
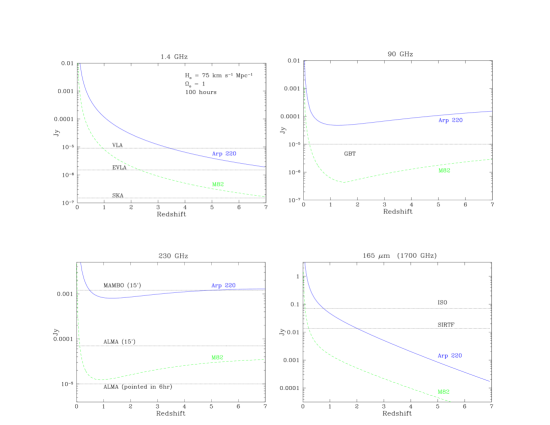
Figure 4 shows the expected sensitivity of future cm to IR instruments compared to the expected flux density of Arp 220 at various redshifts. Overall, the next generation instruments are well matched to the expected flux density of Arp 220 out to . Clearly, the ALMA is by far the most sensitive telescope relative to the dust spectrum, and will detect low luminosity galaxies to very high . However, this applies to pointed observations, which have a limited field-of-view (FWHM ). For surveys of fields larger than about , the next generation bolometer array cameras operating on large single dish telescopes will be competitive with ALMA, as will the EVLA and SIRTF.
Figure 5 shows the flux density of Arp 220 and M82 vs. at various frequencies, relative to the sensitivities of future telescopes. The important point in this diagram is the interesting source selection function at (sub)mm wavelengths: typical (sub)mm surveys detect luminous star forming galaxies at essentially all redshifts, but they miss completely the low , low luminosity galaxies. Hence (sub)mm surveys result in a very clean, but totally biased, sample of sources. Radio observations result in a mixture of low , low luminosity, and high , high luminosity star forming galaxies, as well as radio loud AGN.
The closing debate at this workshop contrasted the IR vs. submm vs. optical views of high galaxies and galaxy formation. Each side argued that they detect the dominant contribution to cosmic star formation at a specific epoch. Yet, each side has a very specific galaxy selection function, and the overlap between the populations apparently is small, . Indeed, one might argue that Jy radio surveys are the least biased means of detecting all the source populations. But therein lies the fundamental problem: how to differentiate the source populations on a deep radio image? Overall, it is clear that all sides are currently seeing only limited, and perhaps orthogonal, aspects of galaxy formation. In order to address the general question of galaxy formation, or at least the formation of the stellar content of galaxies, requires wide field surveys using the EVLA, the next generation bolometers arrays on the LMT and GBT, and SIRTF, with very deep follow-up studies of selected samples of sources using ALMA and NGST.
The National Radio Astronomy Observatory is operated by Associated Univ. Inc., under contract with the National Science Foundation. I would like to thank A. Hopkins for allowing me to reproduce Fig. 1, and B. Poggianti, N. Miller, A. Blain, M.Yun, and F. Owen for useful discussions.
References
- (1) Ryle, M. 1967, ARAA, 6, 249
- (2) Jauncey, D. 1975, ARAA, 13, 23
- (3) Carilli, C.L. and Barthel, P.D. 1996, A&A Reviews, 7, 1
- (4) Condon, J.J. 1992, ARAA, 30, 575
- (5) Windhorst, R. et al. 1985, ApJ, 289, 494
- (6) Richards, E. 2000, ApJ, 533, 611
- (7) Hopkins, A. et al. 2000, ApJ, 519, L59
- (8) Hopkins, A. et al. 2000, Exp. Ast. (in press) astro-ph/9906469
- (9) Garrett, M.A. et al. 2000, A&A, 361, L41
- (10) Owen, F. et al. 2000, in preparation
- (11) Carilli, C.L. and Yun, M.S. 1999, ApJ, 513, L13
- (12) Carilli, C.L. and Yun, M.S. 2000, ApJ, 530, 618
- (13) Papadopoulos, P. et al. 2000, Nature, submitted
- (14) Carilli, C.L., Menten, K.M., and Yun, M.S. 1999, ApJ, 521, L25
- (15) Lilly, S.J. et al. 1999, ApJ, 518, 641
- (16) Haarsma, D.B. et al. 2000, ApJ (in press) astro-ph/0007315
- (17) Barger, A.J., Cowie, L.L., and Richards, E.A. 2000, AJ, 119, 2092
- (18) Bertoldi, F. et al. (2000), in preparation
- (19) Chapman, S.C. et al. 2000, ApJ, in press (astroph 0011066)
- (20) Cram, L. et al. 1998, ApJ, 507, 155
- (21) Mobasher, B. et al. MNRAS 308, 45
- (22) Condon, J.J. and Yin, Q.F. 1990, ApJ, 357, 97
- (23) Leitherer, C. et al. 1999, ApJ (supp), 123, 3
- (24) Duric, N. and Crane, P. (eds) 1991, ASP Conf. Vol. 18 (San Francisco)
- (25) Pooley, G.G. 1969, MNRAS, 144, 101
- (26) Beck, R. et al. 1996, ARAA, 34, 155
- (27) Colina, L. and Perez-Olea, D.E. 1995, MNRAS, 277, 845
- (28) Downes, D. and Solomon, P. 1998, ApJ, 507, 615
- (29) Carilli, C.L. and Taylor, G.B. 2000, ApJ, 532, L95
- (30) Blain, A. 1999, MNRAS, 309, 955
- (31) Dunne, L., Clemens, D., and Eales, S. 2000, MNRAS, in press
- (32) Hines, D. and Low, F. 1999, in ASP Conf. Vol. 191, eds. Weymann et al., p. 165
- (33) Hughes, D. et al. 1998, Nature, 394, 241