New class of low frequency QPOs: signature of nuclear burning or accretion disk instabilities?
Abstract
We report the discovery of a new class of low frequency quasi–periodic variations of the X–ray flux in the X-ray bursters 4U1608-52 and 4U1636-536. We also report an occasional detection of a similar QPO in Aql X-1. The QPOs, associated with flux variations at the level of percents, are observed at a frequency of 7–9 Hz. While usually the relative amplitude of flux variations increases with energy, the newly discovered QPOs are limited to the softest energies (1–5 keV). The observations of 4U1608-52 suggest that these QPOs are present only when the source X-ray luminosity is within a rather narrow range and they disappear after X-ray bursts. Approximately at the same level of the source luminosity, type I X–ray bursts cease to exist.
Judging from this complex of properties, we speculate that a special mode of nuclear burning at the neutron star surface is responsible for the observed flux variations. Alternatively, some instabilities in the accretion disk may be responsible for these QPOs.
Key Words.:
Accretion, accretion disks – Instabilities – Stars:binaries:general – Stars:classification – Stars:neutron X-rays: general – X-rays: stars1 Introduction
Since the discovery of the quasi-periodic oscillations (QPO) in the X–ray flux from GX 5-1 (van der Klis et al. (1985), Lewin, van Paradijs & van der Klis 1988), they were considered an important probe of the inner part of an accretion disk and a region where the accretion disk is interacting with a neutron star surface or magnetosphere (e.g Alpar & Shaham (1985), for a review of the present status of QPO observations and theoretical models see e.g. van der Klis (2000)). The characteristic timescales in these regions are short and the QPOs are usually observed (and expected) at frequencies of tens or even thousands of Hz. Aperiodic variability is also present at much lower frequencies (e.g. – Hz). In particular, when the spectrum of the accreting neutron star binaries is soft above 5 keV (e.g. during the so-called atoll banana state) a Very Low Frequency Noise (VLFN) is observed at these frequencies (e.g. Hasinger & van der Klis (1989)), with an approximately power law dependence of power on frequency and typical RMS variations at the level of percents. Using RXTE data on several accreting neutron star binaries, we searched for low frequency quasi–periodic variations of the X–ray flux and found clear signatures of QPOs with a surprisingly similar frequency in 3 sources. The properties of the newly-found low frequency QPOs are very distinct from those of “canonical” high frequency QPOs, probably indicating a different underlying physics.
We describe the experimental results in Section 2. In Section 3 we speculate on a possible origin of the low frequency QPOs. Section 4 summarizes our findings.
2 Observations, data analysis and results
In our analysis we used publicly available data of the Rossi X-Ray Timing Explorer and EXOSAT observatories. We analyzed 450 ksec of RXTE/PCA observations of 4U1608-52 and 400 ksec of RXTE/PCA observations of 4U1636-536 covering the period Mar.1996–Feb.1999. Also, we reanalyzed an archive EXOSAT/ME observation of Aug.8, 1985.
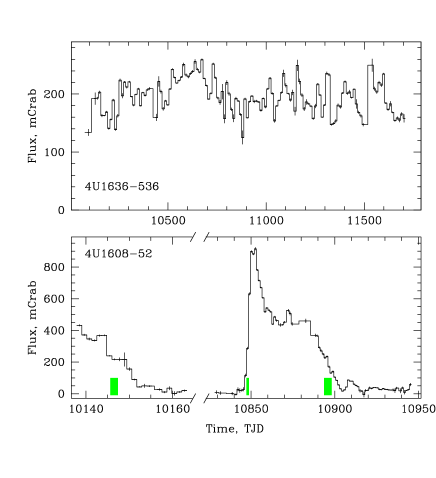
Both considered X-ray sources 4U1608-52 and 4U1636-536 are neutron star binaries which demonstrate type I X-ray bursts. Below we assume a distance of 4 kpc for 4U1608-52 (e.g. Gottwald et al. (1987)) and 5 kpc for 4U1636-536 (e.g. Lawrence et al. (1983); Inoue et al (1984)). 4U1636-536 is a relatively stable source with an average flux of approximately 200 mCrab and luminosity ergs/s (see Fig.1). On the contrary, 4U1608-52 is a transient source, changing from a quiescent state ( ergs/s, Asai et al. (1996)) to a high state with the X-ray flux over ergs/s (e.g. Gottwald et al. (1987)). Long-term light curves of the two sources (RXTE/ASM data) are shown in Fig. 1.
The analysis of the RXTE data was performed with the help of the standard FTOOLS 5.0 package. For the construction of power density spectra, the light curves were cleared out of type I X-ray bursts.

| 4U1608-52 | 4U1636-536 | |||
| Observatory/Instrument | RXTE/PCA | RXTE/PCA | RXTE/PCA | EXOSAT/ME |
| Energy band | 2-5 keV | 2-5 keV | 2-5 keV | 0.8-3.6 keV |
| Date | Mar.3–6, 1996 | Mar.24–27, 1998 | Apr.1996–Feb.1999 | Aug.8,1985 |
| Luminosity (3–20 keV), erg/s | 0.7–1.1 | 0.5–0.8 | 0.7-1.0 | 0.6 |
| Frequency, mHz | ||||
| Width, mHz | ||||
| Rms Ampl., % | ||||
In Fig. 2 we present a small segment of the analyzed light curve of 4U1608-52 in the low energy spectral band of RXTE/PCA (2–5 keV) that clearly demonstrates quasi-periodic oscillations. We clearly detected similar oscillations of X-ray flux from 4U1608-52 during two periods: during the decay phase of X-ray flares of the source in March 1996 and March 1998. Indications for quasi-periodic variations of the X–ray flux were also found during the rise phase of the 1998 X-ray flare (in Feb.3, 1998 and from Mar.14, 1998 till Mar.30, 1998). But a strong, prominent QPO peak on the power spectra was visible only in the Mar.3–6, 1996 and Mar.24–Mar.27, 1998 observations. Therefore, we use only these data in the subsequent analysis. The dates of QPO detection 111including the period during the rise phase of the X–ray flare in Spring 1998, when some indications for QPOs were also found are shown by gray boxes in Fig.1. Neither before nor after these episodes the QPO with similar frequency and width was detected with an approximate 2 upper limit of 0.4–0.5 % in the 2–5 keV energy band. We note here that the absence of QPOs at lower source flux levels is not due to statistical limitations. Similar QPOs with the RMS of 1% would be detectable down to very low fluxes (down to 100-200 cnts/s or 10–20 mCrab, i.e. to luminosity ergs/s).
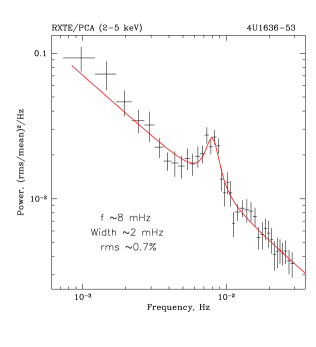
On the contrary, quasi-periodic variations are almost always present in the X-ray flux from 4U1636-536 . Unfortunately, the QPO in this source is weaker and it is not always possible to detect the QPO with sufficient significance during a single observation. In Fig. 3 we plot the power spectra of 4U1636-536 in several observational sets. It is seen that a weak QPO peak is almost always present in the power spectrum. Moreover, the centroid frequency of the QPO is very stable – 7–9 mHz. In the subsequent analysis we used the power spectrum of 4U1636-536 obtained by averaging over all observations from Mar.96–Feb.99.
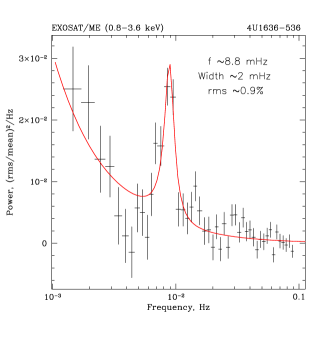
We then analyzed the archive data of the EXOSAT/ME observation of 4U1636-536 on Aug.8, 1985. A weak QPO at a frequency of 9 mHz was also found (see Table 1 and Fig.4). A similar search for the low frequency QPO in the archival EXOSAT/ME observations of 4U1608-52 also revealed a possible 10 mHz QPO candidate (though weak) during an observation on July 5, 1984.
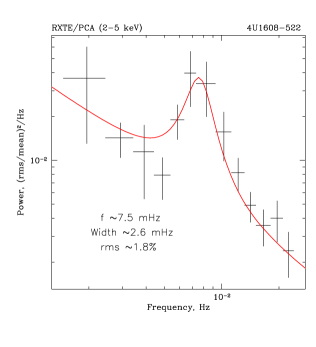
The power density spectra (PDS) for the 2–5 keV light curves of 4U1636-536 and 4U1608-52 were constructed in the –0.03 Hz frequency range. The PDS were fitted with a model consisting of a power law (VLFN) and a Lorentzian (QPO). The parameters of the detected QPOs in the light curves of 4U1608-52 and 4U1636-536 are presented in Table 1. The power spectra of 4U1608-52 and 4U1636-536 along with the best fit models are shown in Fig. 4.
In order to derive the energy dependence of the QPO amplitude, we constructed power density spectra in each energy channel of PCA. These power density spectra were fitted with the same model, fixing the slope of the VLFN component, the centroid and width of the QPO peak. The resulting dependencies of the amplitude of mHz QPOs on the photon energy are presented in Fig.5.


3 Discussion
The properties of the observed mHz QPOs (mQPOs hereafter) can be summarized as follows:
-
•
The fractional RMS amplitude strongly decreases with energy
-
•
Flux variations in mQPOs are at the level of percents
-
•
mQPOs seem to be present only at a particular level of source X-ray luminosity: 0.5–1.5 ergs/s. However this tentative conclusion is based on the data on only two sources and more observations are need to confirm it.
-
•
mHz QPOs ( 7–9 Hz) with similar properties are found in two “atoll” sources
-
•
mQPOs with similar centroid frequencies are present in data for 4U1608-52 and 4U1636-536 that are separated by years (or even 14 years for 4U1636-536).
The decline of the fractional RMS amplitude of a QPO with energy (Fig.5) seems to be a rather unusual property. Typically, the fractional RMS amplitude of the variability (at least at frequencies Hz or higher) increases with energy for accreting NS LMXBs(see e.g. Lewin et al. (1992); Berger et al. (1996); Zhang et al. (1996) Revnivtsev, Borozdin & Emelyanov 1999, Homan et al. (1999)). The same is true for the Very Low Frequency Noise (VLFN) in 4U1608-52 and 4U1636-536 at frequencies comparable to the mQPO frequency. This unusual dependence of RMS on energy possibly hints at a very different nature of the flux variations in mQPOs. Below we propose several possible explanations for the observed phenomenon.
3.1 Quasi-periodic nuclear burning?
The possibility that at high mass accretion rates nuclear burning may cause low frequency luminosity variations was first suggested by Bildsten 1993,1995 (for an overview of the nuclear burning regimes see e.g. Lewin, van Paradijs, Taam 1993, Bildsten 1997,2000). Although the original suggestion of Bildsten (1993) was that VLFN is a signature of nuclear burning, we speculate below that the newly discovered mHz QPOs may correspond to some special mode of nuclear burning which only occurs in a certain range of the mass accretion rate.
First of all, the modulation of the flux at the level of percents (see Table 1 and Fig.4) is roughly consistent with the expected relative energetics of accretion and nuclear burning ( of the order of 100). For the March 3, 1996 observation of 4U1608-52 the ratio of the total source luminosity to the luminosity of the variable component, averaged over the QPO period, is estimated as .

Secondly, it seems that mHz QPOs in 4U1608-52 were present only when the source flux was in a narrow range (within a factor of 2-3), while the total range of the source flux variations during the RXTE observations spans two orders of magnitude (Fig.1,6). Interestingly, at approximately the same flux level, type I X–ray bursts cease to exist, as shown in Fig.6. Although the number of bursts detected is not very large, the coincidence is striking and may hint at an intimate relation between changes in the nuclear burning regimes and observed QPOs. This assumption, that mHz QPOs are associated with a specific range of mass accretion rates, implies that 4U1636-536, whose flux did not change much during the RXTE observations, by chance has about the right accretion rate, for generation of mHz QPOs.
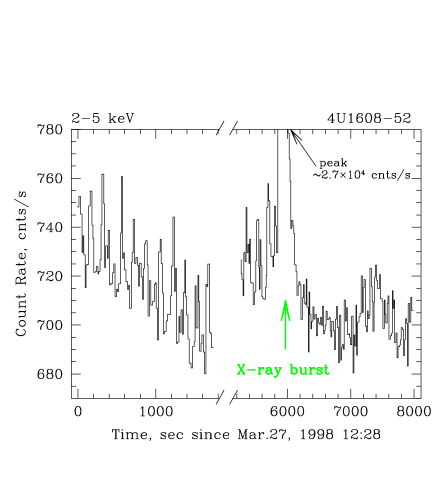
Further support for the possible link between nuclear burning and the mHz QPOs in 4U1608-52 comes from the analysis of the light curve before and after a type I X–ray burst that occurred during the period when the mHz QPOs were detected. The relevant part of the 2–5 keV light curve is shown in Fig.7. Quasi-periodic oscillations are clearly visible during the orbit preceding the one in which the X–ray burst was detected. Moreover mQPOs are also present immediately before the burst, but cease after the burst. This behavior would naturally fit the assumption that nuclear burning is responsible for mQPOs, if a large fraction of the fuel is consumed during the type I burst and a long time is needed to restore the conditions. Note here that for 4U1608-52 the ratio of peak X-ray fluxes of a type I X-ray burst and small “microburst” is of the order of 600-700. A ratio of the total energies released in the single type I burst and in the variable component during one 120 s period of mQPO is of the order of 150-180. The latter number may indicate that compared to a typical type I X–ray burst, the amount of nuclear fuel consumed during a single cycle of the mQPO is less than per cent.
A change in the X-ray flux variability after a Type I X-ray burst was previously reported by Yu et al. (1999) for Aquila X-1. The authors reported a drop in the VLFN level after the burst that was accompanied by changes in the source flux and a decrease in the kHz QPO frequency. Possible correlation of the low frequency variability with nuclear burning at the neutron star surface was also mentioned. We reanalyzed the archival data of the observation of Aql X-1 described in Yu et al. 1999 (Mar.1, 1997) and found a QPO peak at a frequency of 6–7 mHz. These variations also have a soft spectrum and are undetectable at the energies above 7 keV. Moreover, a significant fraction of the VLFN at these frequencies can be attributed to this QPO. Again, as in the case of 4U1608-52, this QPO–like feature becomes undetectable after the burst. Thus, although it is difficult to offer a satisfactory explanation of all changes occurring during the burst, we conclude that the disappearance of mQPOs is consistent with their “nuclear” origin.

Next, we examine the spectrum of the “variable” component of the mQPO in 4U1608-52. The spectrum was constructed using the integrated rms value of mHz QPO variations of the X-ray flux in different energy channels, i.e. using the so-called frequency resolved spectral technique (see Revnivtsev, Gilfanov & Churazov (1999)). The resulting spectrum is shown in Fig.8. 222Note that this spectrum characterizes the amplitude of flux variations as a function of energy and therefore does not necessarily correspond to the existing spectral component. For comparison, in the same plot, the averaged spectrum of the source is shown (scaled down by a factor of 50 to facilitate comparison with the variable component). It is obvious that the “variable” spectrum is much softer than the averaged spectrum. This was of course expected given the strong decline of the QPO rms with energy (Fig.5). For comparison, the solid curve shows black body emission with a temperature of keV333We note here that a very soft component was also found by Yu et al. 1999 by subtracting the spectrum accumulated after the type I burst from the spectrum observed before the burst in Aql X-1. A detailed fit of the soft component is difficult to make because of the poor statistics. It is however certain that the spectrum is softer than the 1.5–2 keV black body, characteristic of type I X–ray bursts. The total luminosity of the source during this observation was erg s-1. If the few percent modulations are caused by quasi-periodic nuclear burning over the whole neutron star surface, then the corresponding temperature will be 0.3–0.5 keV, where is the ratio of the peak nuclear energy release to the accretion luminosity, 8–10 km is the neutron star radius, is the Stefan–Boltzmann constant. This estimate assumes that no strong sources of heating other than nuclear burning are present. I.e. it assumes that a significant part of the burning take place outside the region where accretion energy is released and the surface of the neutron star is “preheated” to a significantly larger temperature. In the picture of a spreading layer on the surface of a neutron star (Inogamov & Sunyaev (1999)), the kinetic energy of the accreting flow is released in two bright rings equidistant from the equator. At luminosities of the order of ergs/s these rings occupy only 15–20% of the stellar surface. Nuclear burning could occur in any part of the star surface but in much deeper layers and column densities. Variations of the nuclear burning energy release in the region where the bulk of the accretion energy is released would result in variations of the much harder component which dominates the averaged spectrum of the source. These variations could be responsible for a possible weak harder component that in principle could be under the 2- upper limits presented in Fig.8 as the extension of the soft component at energies higher than 6 keV. If this interpretation is correct, then the weakness of the harder component implies that only a small fraction of burning ( 20%) occurs in the area where accretion energy is released.

Finally, we examined the characteristic shape of the mQPO in 4U1608-52 using the portion of the light curve where individual QPO profiles are clearly visible. The light curve was divided into pieces with the duration of Hz s. The phase of the profile in each piece was then calculated by comparing the observed profile with a sine wave, and the profiles were coadded with the proper shift of phase. The resulting QPO profile is shown in Fig.9. Our experiments with various template profiles to determining the phases of individual pulses resulted in moderate variations in the averaged pulse profile (as expected, given the limited statistics of the data set). The characteristic features of the profile, namely the narrower peaks and more extended valleys, are however robust against almost any choice of the procedure of constructing the averaged profile. There is also marginal evidence that the peaks are asymmetric: the steeper rise and shallower decline. It is interesting that this profile bears some similarity to the time dependent energy release plots of Bildsten 1995 (see his Figure 5a), which were calculated using the approximation of a one-dimensional none-convective model. However, the mass accretion rate (the Eddington level) assumed for these plots is markedly different from what we consider here.
Thus, there are at least several observational facts that seem to be consistent with association of the mQPOs with the quasi-periodic burning of the nuclear matter at the neutron star surface. It is unclear, however, what process governs the time scale of 2 minutes, which is surprisingly stable (and even similar for two different sources), and why the burning is quasi–periodic and present only in a narrow range of mass accretion rates.
If the nuclear burning is not uniform over the neutron star surface one may expect asymmetries in the distribution of hot spots. This might lead to the appearance of coherent pulsations with the neutron star rotation period, as is indeed observed during type I X-ray bursts (see e.g. Strohmayer (1999)). We tried to search the 4U1636-536 data (the type I X-ray bursts excluded) for coherent pulsations at the pulse frequency 580 Hz (e.g. Strohmayer et al. (1998)). We made no solar baricentric or pulsar orbital corrections. In order to take into account these possible changes of observed pulse frequency we took a 1 Hz wide detection cell. We obtained an upper limit on the modulations in the coherent signal of 0.2 % (95% confidence) pulse fraction for the 2–5 keV range. This result sets a limit on the uniformity of energy release on the neutron star surface. This limit is, however, not very stringent given the small 0.7% (see Table 1) contribution of nuclear burning to the source luminosity.
Trying to undestand the nature of unstable nuclear burning we see two simplest possible modes:
-
•
unsuccessful ignitions occur from time to time in different parts of the freshly accreted fuel. A flame burns only on a small surface area. The whole stock of fuel is waiting for a successful flame front capable of propagating across the entire surface of the star. It is obvious that such a picture could not produce quasiperiodic oscillations. The resulting variability should be much more stochastic and could produce only broad band noise.
-
•
unstable helium shell burning occurs at some depth in the freshly accreted fuel. The flame propagates over the whole surface of the star. In this case it is possible to expect quasiperiodicity. However, the observation of a normal type I X-Ray burst after a long series of microbursts (see Fig. 7) strongly restricts possible models of shell burning. The most important consequence is that unstable shell burning occurs below the main fuel stock and does not influence it until the conditions for the strong burst materialise. In addition, this picture requires that only a small fraction of the fuel is processed during the shell burning, leaving enough fuel for a stronger type I burst. Questions about flame propagation through a thin shell are not simple either.
If the unstable nuclear burning interpretation is correct then one can make two obvious predictions:
-
•
Other NS LMXB may show similar QPOs while being at a certain flux level. For 4U1608-52 and 4U1636-536 the 3–20 keV luminosity was 0.5–1.5 ergs/s when the mQPOs were observed.
-
•
Low frequency QPOs with similar properties (in particular with a much softer spectrum than the average one) should not be present in X-rays from black hole candidates.
3.2 Disk instabilities
Although there are several observational indications that mQPOs may be related to nuclear burning on the surface of the neutron star, the observations do not provide robust enough proof of this interpretation. We briefly discuss below a few other scenarios.
The soft spectrum of the variable component (much softer than the averaged spectrum) may be hinting at a possible contribution of an optically thick accretion disk emission to the variable component. In this case we can also expect that a powerful type I X-ray burst could lead to the disappearance of disk instabilities for some period.
We note here that variations of the soft component on the time scales of 100-1000 s have been observed in the galactic black hole candidate GRS 1915+105 (Belloni et al. (1997), Trudolyubov, Churazov & Gilfanov 1999, Muno et al. (1999)), which are thought to be associated with the motion of the inner boundary of an optically thick accretion disk. It is not clear however if these variations have the same nature as the mQPOs discussed above. These variations appear in GRS 1915+105 when the average source luminosity is close to the Eddington limit, while the QPO discussed above were observed in sources with luminosities of only . The amplitude of variations observed in GRS 1915+105 is very large - more than an order of magnitude.
3.3 Other possible scenarios
It is interesting that variations of the photoelectric absorption at the level of cm-2 are capable of reproducing approximately the required dependence of the RMS on energy. It is not clear however what kind of process can cause quasi-periodic variations of the absorption on the time scales of minutes, especially given the stability of the mQPO frequency.
Variations of mass accretion rate in an optically thick accretion disk may also be responsible for the observed variations. However the amplitude of variations of the harder component, presumably coming from the boundary layer, is at least a factor of 5 lower than that for the soft component. This makes the variations in the mass accretion rate an unlikely cause of the observed mQPOs.
4 Conclusions
A new type of very low frequency QPO has been discovered in at least two “atoll” sources: 4U1608-52 and 4U1636-536, with essentially the same frequency 7–9 Hz. These QPOs have a very soft spectrum, RMS amplitude of variations of the order of per cent and appears to be present only at a certain level of the mass accretion rate. We suggest that these quasi–periodic variations might be related to a special regime of the nuclear burning on the neutron star surface or some instability in the optically thick accretion disk.
Acknowledgements.
We are grateful to the referee Michael van der Klis for useful comments. This research has made use of data obtained through the High Energy Astrophysics Science Archive Research Center Online Service, provided by the NASA/Goddard Space Flight Center. M.Revnivtsev acknowedges partial support by RFBR grant 00-15-96649.References
- Alpar & Shaham (1985) Alpar A., Shaham J. 1985, Nat., 316, 239
- Asai et al. (1996) Asai, K., Dotani T. Mitsuda K. et al. 1996, PASJ, 48, 257
- Belloni et al. (1997) Belloni T., Mendez M., King A. et al. 1997, ApJ, 479, 145
- Berger et al. (1996) Berger M., van der Klis M., van Paradjis J. et al. 1996, ApJ, 469, L13
- Bildsten (1993) Bildsten L. 1993, ApJ, 418, 21
- Bildsten (1995) Bildsten L. 1995, ApJ, 438, 852
- Bildsten (1997) Bildsten L. 1997, in “The Many Faces of Neutron Stars”, ed. A. Alpar, L. Buccheri, & J. van Paradijs, (Dordrecht: Kluwer)
- Bildsten (2000) Bildsten L. 2000, in Proceeding of the 10th Annual October Astrophysics Conference (ed. S.S. Holt and W. W. Zhang), astro-ph/0001135
- Gottwald et al. (1987) Gottwald M., Stella L., White N. et al. 1987, MNRAS, 229, 395
- Hasinger & van der Klis (1989) Hasinger G., van der Klis M. 1989, A&A, 225, 79
- Homan et al. (1999) Homan J., Jonker P., Wijnands R. et al. 1999, ApJ, 516, 91
- Inogamov & Sunyaev (1999) Inogamov N., Sunyaev R. 1999, Astr.Lett., 25, 269
- Inoue et al (1984) Inoue H., Waki I., Koyama K. et al. 1984, PASJ, 36, 831
- van der Klis et al. (1985) van der Klis M., Jansen F., van Paradijs J. et al. 1985, in Proceedings of “Recent Results on Cataclysmic Variables”, ESA workshop, 291
- van der Klis (2000) van der Klis M. 2000, to appear in ARAA, astro-ph/000116
- Lewin, van Paradijs & van der Klis (1988) Lewin W., van Paradijs J., van der Klis 1988, Sp.Sci.Rev. 46, 273
- Lewin et al. (1992) Lewin W., Lubin L., Tan J. et al. 1992, MNRAS, 256, 545
- Lewin, van Paradijs & Taam (1995) Lewin W., van Paradijs J., Taam R. 1995, in “X-ray Binaries”, ed. Lewin W.,van Paradijs J., van der Heuvel E. (London: Cambgridge), 175
- Lawrence et al. (1983) Lawrence A., Cominsky L., Engelke C. et al. 1983, ApJ, 271, 793
- Muno et al. (1999) Muno M., Morgan E., Remillard R. 1999, ApJ, 527, 321
- Revnivtsev, Borozdin & Emelyanov (1999) Revnivtsev M., Borozdin K., Emelyanov A. 1999, A&A, 344, 25
- Revnivtsev, Gilfanov & Churazov (1999) Revnivtsev M., Gailfaov M., Churazov E. 1999, A&A, 347, 23L
- Strohmayer (1999) Strohmayer T. 1999, ApJ, 523, 51
- Strohmayer et al. (1998) Strohmayer T., Zhang W., Swank J. et al. 1998, ApJ, 498, 135L
- Trudolyubov, Churazov & Gilfanov (1999) Trudolyubov S., Churazov E., Gilfanov M. 1999, A&A, 351, 15
- Yu et al. (1999) Yu W., Li T., Zhang W. et al. 1999, ApJ, 512, L35
- Zhang et al. (1996) Zhang W., Lapidus I., White N. et al. 1996 ApJ, 469, L17