Eclipsing Broad Emission Lines in Hercules X-1:
Evidence for a Disk Wind?
Abstract
We present disk wind model calculations for the broad emission lines seen in the ultraviolet spectra of the X-ray binary Hercules X-1. Recent HST/STIS observations of these lines suggest that they are kinematically linked to the orbital motion of the neutron star and exhibit a red-shifted to blue-shifted evolution of the line shape during the progression of the eclipse from ingress to egress which is indicative of disk emission. Furthermore, these lines are single-peaked which implies that they may be formed in a disk wind similar to those we have proposed as producing the broad emission lines seen in the UV spectra of active galactic nuclei. We compute line profiles as a function of eclipse phase and compare them to the observed line profiles. Various effects may modify the appearance of the lines including resonant scattering in the wind itself, self-shadowing of the warped disk from the central continuum, and self-obscuration of parts of the disk along the observer’s line-of-sight. These latter two effects can cause orbital and precessional phase dependent variations in the emission lines. Hence, examination of the line profiles as a function of these phases can, in principle, provide additional information on the characteristics of the disk warp.
keywords:
binaries: eclipsing — stars: individual (Hercules X-1) — accretion disks — ultraviolet: stars1 Introduction
Hercules X-1 is one of the best-studied objects in the X-ray sky and displays a wealth of behavior which make it a unique laboratory for investigating the physics of accretion disks in binary systems. It emits X-ray pulsations with a 1.24 s period indicating that the compact object is a rapidly rotating neutron star whose magnetic field is modulating the X-ray emission (Tananbaum et al. 1972). In addition, its hard X-ray spectrum shows features consistent with resonant cyclotron absorption in a strong magnetic field, G, as would be expected at the neutron star surface (Trümper et al. 1978; Soong et al. 1990). The system has a 1.7 day orbital period, and the associated X-ray eclipses imply a highly inclined () circular orbit and an intermediate-sized companion, HZ Herculis, with mass (Deeter et al. 1981). The X-ray light curve of Her X-1 is also modulated on a 35 d period (Giacconi et al. 1973) and consists of a “main-high” state lasting 10 d, followed by a 10 d quiescent period, a subsequent “short-high” state of 7–8 d, and finally another quiescent period of 7–8 d. In addition, the X-ray light curve shows pre-eclipse dips which occur at the beat frequency of the orbital and 35 d periods. The 35 d cycle of Her X-1 and the behavior of the pre-eclipse dips have been studied in great detail by Scott & Leahy (1999) using RXTE/ASM data.
The 35 d modulation of the X-ray flux has been attributed to a precessing accretion disk which is tilted and/or warped so that the disk itself periodically obscures the central X-ray source (Katz 1973). The origin of such a warp is not clear, but relatively recent theoretical work has shown that both the warp and the disk precession may be due to a radiation-driven warping instability (Pringle 1996; Maloney, Begelman, & Pringle 1996). In these models, radiation from the central source illuminates the disk and is absorbed. Since this central illumination is radially directed, it contributes no net torque to any given annulus of the disk. However, if the disk annulus is optically thick, then the net pressure for re-radiated emission will be normal to the surface of the disk. Therefore, if the disk annulus is illuminated non-axisymmetrically, a net torque can force the annulus out of the nominal disk plane. Non-axisymmetric illumination may arise if the local angle of tilt of the disk varies with position, i.e., if the disk is warped. This is the basis for the radiation-driven instability. Alternatively, such torques may be produced in a similar fashion by non-axisymmetric winds driven from the disk surface by the X-ray heating (e.g., Schandl & Meyer 1994; Schandl 1996). However, the nature of the underlying instability is essentially the same.
Radiation-driven warping is an appealing mechanism since it allows for global precessional modes which appear to be required by the regularity of the long term periodicity, and it also provides a natural time scale for the precession (Maloney, Begelman, & Pringle 1996). For Her X-1, a plausible estimate for this time scale can easily account for the observed period: days, where is the usual disk viscosity parameter and is the efficiency of the accretion (Maloney & Begelman 1997).
The shape of the X-ray light curve over the 35 d period can provide some constraints on the characteristics of the disk warp and hence on the physical mechanisms which produce it. Schandl & Meyer (1994) and Schandl (1996) performed dynamical calculations of a disk warp driven by coronal winds from the disk surface which are powered by heating due to the central X-rays. This model accounts for the presence of the two high states via a combination of obscuration by the disk itself and by an optically thick corona overlying it. These authors did not consider the effect of re-radiation torques in their calculations, which may be at least as important as the torques due to a wind (see discussion in Maloney, Begelman, & Pringle 1996). In contrast, Scott, Leahy, & Wilson (2000) have recently described a completely phenomenological model for the tilt and phase of the inner and outer disk annuli which are adjusted to fit the main-high and short-high intervals. In addition to differing from the Schandl-Meyer geometry, their model accounts for the X-ray spectral softening seen during both high state turn-ons as being due to absorption by cold material in the outer disk. Since the Schandl-Meyer model attributes the short-high state to emergence of the X-ray source from behind the hot, optically thick disk corona, it cannot account for this spectral variation. Although the X-ray observations can clearly place some constraints on the nature of the putative disk warp, additional observational diagnostics would be helpful.
In addition to driving warps, X-ray illumination of the disk can also produce emission line radiation. Several authors have performed calculations of the disk structure and radiative transfer for an X-ray illuminated disk (Raymond 1993; Ko & Kallman 1994). These models predict the existence of an accretion disk corona as well as a chromospheric layer which produces emission from a variety of lines ranging from the Fe K lines in the X-rays to UV lines such as Civ, Nv, Siiv, Heii, and Ov. Although the predicted line ratios appear to agree substantially with those observed in well-studied objects such as Her X-1 and Sco X-1, since they are produced in a disk, the lines are expected to be double-peaked, contrary to observations (Vrtilek et al. 1991; Boroson et al. 1996, 2000a).
We present a model for the broad single-peaked UV emission lines in which they are formed in an accretion disk wind. The underlying mechanism is the same as the one we have proposed for the broad lines in active galactic nuclei (Chiang & Murray 1996; Murray & Chiang 1997) and the single-peaked emission lines in cataclysmic variables (Murray & Chiang 1996): Large radial shears, due to the wind, in line emitting material at the near and far sides of the accretion disk allow line photons with small Doppler shifts to escape and produce single-peaked emission lines. The remainder of this paper is organized as follows: In § 2, we review the recent observations of the UV emission lines in Her X-1, and in particular, discuss the evidence for a disk origin for the broad UV lines. In § 3, we review the mechanism for producing broad single-peaked emission lines in disk winds. In § 4 we apply these calculations to fit the July 1998 HST/STIS data obtained during the eclipse phases of Her X-1. We also show how disk warping can affect the appearance of the lines as a function of orbital and precessional phase. Finally, in § 5, we present our conclusions.
2 UV Observations
Her X-1 has been observed several times in UV wave bands. Spectra were taken with the IUE satellite (Dupree et al. 1978; Gursky et al. 1980; Howarth & Wilson 1983), with the EUVE satellite (Leahy & Marshall 1999) and with IUE and EUVE during a multiwavelength campaign involving the satellites ASCA, ROSAT, and CGRO (Vrtilek et al. 1994). In 1994, high resolution UV spectra were obtained over nearly half of the 1.7 d orbital phase using HST/GHRS (Boroson et al. 1996) during the main-high state. Later, spectra were taken in July 1998 with HST/STIS over almost a full orbital period, including eclipse ingress and egress phases, while Her X-1 was in the short-high state (Boroson et al. 2000a). Most recently it was observed again by STIS in July 1999, but this time the source was in the “anomalous low” state in which it was X-ray quiet even during nominal main-high and short-high periods (Vrtilek et al. 2000).
From the 1994 GHRS observations, Boroson et al. (1996) reported detecting broad high ionization lines Heii, Civ, Siiv, and Ov and were able to resolve both narrow ( km s-1) and broad ( km s-1) components in Nv. They measured the Doppler shifts of the broad and narrow components at the various orbital phases by averaging the velocities at half-maximum of the line fluxes and found that the broad and narrow components were correlated with the expected Doppler shifts of the neutron star and companion respectively. In addition, they found that the narrow components decreased in strength relative to the broad components as the system approached eclipse of the primary. They concluded that the narrow line emission was produced on the surface of the X-ray irradiated companion and that the broad emission was produced in the disk surrounding the neutron star primary.
The July 1998 observations by Boroson et al. (2000a; hereafter B00) using HST/STIS consist of 29 low resolution spectra obtained with the G140L grating having a resolution of 200–300 km s-1 and covering wavelengths 1150–1720Å, and 10 high resolution echelle spectra obtained with the E140M grating with resolution 6 km s-1 and covering wavelengths 1150–1710Å. B00 confirmed the presence of both broad and narrow components in Nv and revealed similar features in the Ov, Civ, Siiv, and Heii lines as well. Just as with Nv, the narrow components of these other lines were not apparent during the orbital phases when the X-ray illuminated face of HZ Her was not visible, i.e., during the eclipse ingress and egress phases. In the absence of the narrow components, examination of the evolution of the broad emission lines during the eclipse is particularly instructive. Using a simple model for the obscuration of the disk by the companion, B00 found that the fluxes in the broad Nv and Civ lines during the ingress phases were consistent with being from a disk which produced this emission symmetrically with respect to the line-of-centers joining the primary and companion. Furthermore, the high spectral resolution data at the egress phase showed that the lines were blue-shifted as would be expected for a partially obscured disk which rotates prograde with the binary orbit.
B00 did find some apparent difficulties with the disk interpretation for the origin of the broad emission lines. Although the Doppler shifts of the fitted broad components of the Civ, Heii, and Siiv lines were found to be largely consistent with the expected projected velocities of the neutron star, the Doppler shifts of the fitted broad Nv components were red-shifted with respect to the neutron star. This behavior is also seen in the measured velocities of the Nv line in the earlier 1994 GHRS spectra which were taken during the main-high state. In order to characterize this emission empirically, B00 modeled the disk emission from Nv by dividing the disk into four sectors corresponding to the left, right, front and back portions of the disk. They fit the high resolution spectra obtained during eclipse egress of the July 1998 data and found that the red side of the disk was brighter than the blue side by a ratio of at least 3:1. Fits to the Siiv, Heii, and Ov data have different angular brightness distributions, but nonetheless do show evidence for somewhat brighter red-shifted sides of the disk. Notably, the red-blue flux ratios found for the July 1998 short-high data also provided adequate fits to the Nv lines in the 1994 main-high GHRS data when the disk was at a different precessional phase and was therefore presumably at a different orientation.
3 Broad Emission Lines from Accretion Disks
The mechanism for producing single-peaked broad emission lines in a disk-wind has been covered in some detail by Murray & Chiang (1997, hereafter MC97) where it was applied to the broad lines of AGNs and by Murray & Chiang (1996; see also Chiang & Murray 1997) where it was discussed in the context of broad single-peaked Balmer lines in cataclysmic variable systems. In this section, we present the relevant physics and refer the interested reader to the above references, particularly MC97, for more details.
From the observations of broad absorption line (BAL) QSOs and in the context of the disk wind model, it is clear that the broad emission line photons are produced via collisional excitation and/or recombination. Accordingly, the bulk of the line emission will originate in the highest density regions of the wind near the base of the streamlines where the wind proper interfaces with the disk (Murray et al. 1995). In the absence of a wind, the emission lines from a Keplerian disk viewed at sufficiently large inclination will be double-peaked. If the emission is optically thin, this double-peaked appearance is due to the zeroes of the azimuthal derivative of the projected disk velocity occurring at the projected velocity maxima (cf. Rybicki & Hummer 1983; MC97). Here, the projected disk velocity is where is the unit vector in the direction of the observer and v is the velocity of the disk material as a function of position.
For an optically thick line, the double-peaked appearance is somewhat different. In this case, the velocity shears in the disk significantly alter the optical depth which a line photon sees for a given photon direction. In directions along which the velocity shears are large, line photons escape more readily as atoms in material along the photon path will be Doppler shifted out of resonance. Conversely, for paths along which the velocity shears are small, the atoms in the material remain in resonance, the optical depths are large, and hence line emission in these directions is suppressed. In the near and far sides of a Keplerian disk, relative to the inclined observer, where the projected velocities of the disk material are near zero, the velocity shears are also small. This leads to suppression of emission at wavelengths near line center. Rybicki & Hummer (1983) noted this effect, and Horne & Marsh (1986) showed that it provides a good description of the Balmer line shapes seen in the optical spectra of certain cataclysmic variables. The presence of a disk wind with a significant velocity shear in the poloidal direction will allow the photons with small projected velocities from the front and back sides of the disk to escape more easily, producing a single-peaked emission line.
More formally, the local anisotropy of the line emission occurs because the line emissivity is roughly proportional to the local line width which in turn depends upon the anisotropic shear broadening. The local apparent line surface brightness is given by
| (1) |
where is the inclination and the factor accounts for foreshortening assuming a flat disk, and is the line source function. The optical depth is
| (2) |
where is the line opacity which depends on the strength of the transition and on the abundance of the relevant ion in the appropriate state; in general, will vary with both and . The function is the thermally broadened line profile shape which has been Doppler shifted to the line-of-sight velocity of the emitting material. We assume a Gaussian shape for the profile:
| (3) |
The thermal line width is where is the thermal velocity of the emitting gas. We approximate the line-of-sight velocity by expanding linearly from the base of the emission layer at vertical height, :
| (4) | |||||
Here is the vertical thickness of the emitting layer, is the line-of-sight velocity at the base of the emission layer, is the azimuthal velocity, is the azimuthal angle of the emission point, is the shear velocity along the line-of-sight (i.e., the velocity difference between the top and bottom of the emission layer along the line-of-sight), and is the symmetric strain tensor describing the flow. In Cartesian coordinates, the strain tensor is given by
| (5) |
The coordinates are defined with the disk symmetry axis coincident with z-axis and the observer line-of-sight to the neutron star lying in the xz-plane. We define the quantity which is the velocity gradient, or shear, along the line-of-sight.
From Eq. 1, we see that for an optically thick line, the local emissivity is approximately equal to the source function multiplied by the width of the frequency interval over which the optical depth exceeds unity. Given the above expressions, the local emissivity is then
| (6) |
The quantity is the central optical depth of the line,
| (7) |
and the effective local linewidth is
| (8) |
Thus, when the line-of-sight shears are large, the local emissivity is enhanced.
Accordingly, a disk wind which has large velocity shears in the radial direction will have enhanced emission from the low projected velocity material from the near and far sides of the disk. For AGN disk winds, just as for O stars, we found that the radial component of the wind velocity can be modeled approximately as
| (9) |
where is the terminal velocity of the wind, and is the “footpoint” radius of the wind streamline (Murray et al. 1995). For O stars, this radius is that of the stellar surface; while for a disk wind, it is the disk radius from which a given streamline originates. The velocity law exponent depends on the effective gravity and on the parameters describing the radiative acceleration. In both O stars and AGN disk winds, the bulk of this acceleration is due to line driving. The effectiveness of the lines in providing driving force for the wind will be determined by the ionization state of the wind material which will be photoionized by either radiation from the O star or the AGN central continuum source. Since the effective temperature of the inner regions of an AGN disk is higher than that of an O star ( K vs 40,000 K), the line driving will be different. In addition, because material in a disk is in Keplerian motion, the effective gravity near the disk surface is very small. As a consequence, the velocity grows more slowly near the disk surface than in the O star case. In their pioneering work on the dynamics of line-driven stellar winds, Castor, Abbott, & Klein (1975) derived a value of , while later work using more complete calculations of the line force found (e.g., Pauldrach, Puls, & Kudritzki 1986). In Murray et al. (1995), we showed that the combined effects of the reduced effective gravity and line force appropriate for an AGN ionizing continuum, the velocity law exponent is , consistent with a slower radial acceleration near the wind footpoint. Although the importance of line driving in accelerating a disk wind is uncertain in Her X-1, the formalism we describe for the emission line formation will be relevant for any radially accelerating disk outflow.
In a disk wind, for photons escaping along sightlines to a distant observer, the line-of-sight velocity gradient is given by:
| (10) | |||||
where is the angle at which the line-driven wind emerges from the disk. The monochromatic specific luminosity is
| (11) |
Here the source function is assumed to depend only on radius. The length scale of the emitting region is where is the velocity of the emitting gas. The subscript refers to the two azimuthal angles, , which correspond to the locations of the disk material with Doppler shift of for a given radius .
As we noted above, the line emission is strongest where the density is largest, near the footpoints of the wind. Here the radial velocities are only of order the thermal speed, , and we can generally neglect the term proportional to in Eq. 10. Furthermore, the vertical length scale will be much smaller than the disk radius. In practice, this implies that we can assume the emitting layer to be geometrically thin and we can thus neglect any -dependence of and . However, even though the radial velocities are small compared with the azimuthal component, from our expression for (Eq. 9), we see that the radial shears are larger: . Hence, for high inclination objects, the line-of-sight shear will be dominated by two terms:
| (12) |
The first term is the radial shear due to the wind, while the second term is simply the Keplerian disk shear. The effect of the radial wind shear can be seen in the angular dependence of the first term. Large radial shears at , which correspond to the near and far sides of the disk where the projected velocities are small, allow line photons with small Doppler shifts to escape more easily to the observer.
4 Model Calculations and Comparison with Data
We initially examine the simplest case of a flat disk, and we will use the various eclipse light curve shapes as the principal constraints. We model the eclipse of the disk by identifying the obscuring limb of the companion with its Roche surface. Assuming a primary mass of 1.3 , a companion mass of 2.2 , and an orbital inclination of (see e.g., Schandl 1996), the primary will be eclipsed by the companion over orbital phases –1.064. If the accretion disk is flat and extends out to the Roche radius, which is cm for these system parameters, it will be at least partially eclipsed over phases –1.16. The maximum outer radius for the disk to become fully eclipsed at is cm.
Both Raymond (1993) and Ko & Kallman (1994) found from their calculations of X-ray illuminated accretion disks that the UV line intensity from the disk surface should fall much less steeply than so that emission from the outer parts of the disk will provide the dominant contribution to the line flux. For optically thick emission lines, the radial dependence of the line intensity will be given by (see Eq. 11)
| (13) | |||||
| (14) |
In order to match the flat radial dependence of the line intensities found by Raymond (1993; see his Fig. 4) and Ko & Kallman (1994; see their Fig. 18), we set . However, so long as the outer disk radii make the main contribution to the line emission, the exact radial dependence of is not very important. Since the emission line shapes will also be largely insensitive to the choice of inner radius of the line emitting region, for definiteness, we fix the inner radius to be cm, a value which is comparable to the inner radii found by the above authors for the lines we will examine. For our fits to the emission line light curves, it is sufficient to consider outer radii of the line emitting regions in the range – cm (cf. Table 1). The lower limit for the outer radius of the disk is the so-called circularization radius at which the specific angular momentum of the disk equals that of the material injected at the L1 point from the Roche lobe-filling companion (see, e.g., Frank, King, & Raine 1992), and an absolute upper limit for the outer radius is the Roche radius. However, for a given line, particularly a high ionization one, the relevant outer radius may be smaller than the actual disk radius since the emission properties are also determined by the ionization state of the material. In principle, the appropriate value of the outer radius will be affected by a number of factors including the widths of the lines, the residual line flux seen at phases near mid-eclipse, and the shape of the emission line eclipse light curve.
The eclipse spectra of the July 1998 HST/STIS observations presented and analyzed by B00 constrain our model calculations. Accordingly, in order to match the resolution of the observations, we convolve our model calculations with Gaussian functions having widths of 250 km s-1 and 10 km s-1 for the ingress and egress profiles respectively. In addition, since the high resolution data are oversampled, we rebin the data appropriately. The low resolution spectra were taken during the ingress phases –0.986, and the high resolution spectra were taken over the egress phases , 0.092 and the out-of-eclipse phases –0.804. As we noted above, the out-of-eclipse spectra show prominent narrow emission lines which B00 argue originate from the X-ray irradiated surface of the companion. Since we do not model the narrow lines, we restrict our attention to the low resolution ingress spectra and the first three phases () of the high resolution spectra during which the narrow lines do not appear. At each phase, we compute emission line profiles and disk surface brightness maps. For our flat-disk calculations, the precessional phases are irrelevant; however, when we compute the effects of the warped disk models of Schandl (1996) and Scott et al. (2000), the precessional phases will be important.
4.1 Eclipse Light Curves
In Fig. Eclipsing Broad Emission Lines in Hercules X-1: Evidence for a Disk Wind?, we plot the fluxes for the five lines, Heii, Civ, Nv, Siiv, and Ov, and the underlying UV continua associated with each line as functions of orbital phase. We also plot our best-fit flat disk models for the eclipse light curves of the lines. For each of these lines, there is a small amount of residual flux at phases during which the entire disk should be eclipsed by the secondary. For example, for the Heii line, at orbital phase , the residual line flux is erg cm-2s-1 and is at approximately same level at . Unless the disk is fully eclipsed at both of these phases, the coverage of the disk will be quite different, and these line fluxes should not be the same. Therefore, we conclude that the residual flux at does not consist of line emission which we are seeing directly from the disk surface. Instead, it may be line emission from the disk which has been scattered either by resonant or continuum processes into our line-of-sight by material high above the disk, such as the wind itself.111I thank Bram Boroson for suggesting this hypothesis. Although the companion will still obscure some fraction of the wind during the eclipse and therefore block part of the scattered emission, for the purposes of fitting the eclipse profiles, we have subtracted the mean of the small residual fluxes measured at and 0.986 from the fluxes at all phases for each of the lines.
In fitting the eclipse light curves, we have allowed the disk outer radius and overall disk flux normalization to vary, and we have used our disk wind model along with the aforementioned source function law, , and inner radius, cm. The other important model parameters are the ratio of the wind terminal velocity to Keplerian disk velocity which we take to be (see Eq. 9), the exponent of the wind radial velocity law which we set to , and the optical depth of the emission line. The first two parameters determine the relative magnitude of the radial and azimuthal gradients at the disk surface. However, as long as the radial and azimuthal gradients are comparable, variations in these parameters will only have moderate effects on the shapes of the line profiles and eclipse light curves. Furthermore, since detailed modeling of the dynamics of the wind is beyond the scope of this paper, we fix these parameters to these exemplary values although both values may in fact vary with radius. In addition, we fix the angle at which the wind emerges from the disk to . As we note above, for high inclination objects such as Her X-1, the line-of-sight shear will be largely insensitive to this parameter (cf. Eq. 12). We set the poloidal component of the velocity to be km s-1 which is approximately the thermal velocity for gas at a temperature of K. Temperatures of this magnitude have been found for the chromospheric layers in the calculations of Raymond (1993) and Ko & Kallman (1994). The density of the emitting gas will depend on the wind mass-loss rate. In the context of this model, this density could be inferred from the observations if the ionization state of the gas were also known. However, this would require a calculation similar to that of Raymond and Ko & Kallman which accounts for the effect of the wind dynamics which could in turn depend on the gas ionization state if radiative acceleration is important.
The line optical depth is more problematic. As long as it remains optically thick throughout the emission region, the line shape is unaffected by the exact value since the factor in the expression for the specific luminosity (Eq. 11) is essentially unity. However, if the line is optically thin, then , and any density dependence of the line opacity will have an effect on the line shape (cf. MC97). As we will discuss below, marginally optically thick emission may be relevant for the Nv doublet which shows line ratios significantly different from unity (B00) and which have a wider velocity profile than the other UV lines we consider.
Since the Heii 1640 line is a singlet transition and does not show evidence for interstellar absorption in any of the high resolution spectra, it should be the easiest line to compare with the model calculations. We will therefore make it the primary focus of our investigations. The Ov line is also a singlet transition; but as B00 found, it appears to have either an absorption component or a separate narrow emission component which will make its spectra more difficult to model. The Siiv line is a doublet, but we only measure the fluxes for the component since the component is blended with a complex of Oiv lines (B00). Furthermore, the component is affected by interstellar absorption. However, we do consider the Civ and Nv lines in some detail for our flat disk models, even though they are doublets and are affected by interstellar absorption, since their spectra allow us to examine some other effects which are relevant for the properties of the wind and the chromospheric layer in the disk, such as the implied wind column density in the case of the Civ lines and the effects of optical depth in the case of the Nv lines.
In Fig. Eclipsing Broad Emission Lines in Hercules X-1: Evidence for a Disk Wind?a, we plot the Heii line fluxes as a function of orbital phase. These fluxes were obtained by fitting a constant level to the UV continuum over wavelengths 1649–1663Å and integrating the residual line flux in the range 1631–1649Å. At phases –0.913, there is a “dip” in the Heii emission line light curve. A similar dip is seen in the light curves of Siiv and Ov. These dips cannot be explained in the context of a flat disk model. One possibility, which we will explore below, is that the appearance of the emission lines is modified due to self-obscuration by a warped disk. This will cause line shape and flux variations which will be a function of precessional phase. This explanation also faces difficulties, however, since the eclipse light curves of Civ and Nv do not show similar features at these phases. In addition, the fits performed by B00 to the broad components of these lines show that the fluxes vary differently for different lines over the course of the full orbital period. While some of these variations may be due to uncertainties in fitting the narrow line components simultaneously, they could reflect real differences in the variations of the emissivity for the various lines. It is unlikely that this dip is related to the pre-eclipse dips which are seen in the X-ray light curve. Although, both phenomena occur at phases prior to the main eclipse of the central X-ray source, the duration of the X-ray dips is much longer and is comparable to that of the main eclipse itself, , and it occurs at an earlier orbital phase () than the dip which we see in the emission line fluxes (Scott & Leahy 1999).
In order account for the effect of these flux dips, we have fit the eclipse light curves for two subsets of the data: a restricted dataset, excluding the fluxes from phases corresponding to the dip , and an unrestricted one, which includes all of the data. Fits to these two data subsets are shown as the solid and dotted curves in Fig. Eclipsing Broad Emission Lines in Hercules X-1: Evidence for a Disk Wind?a respectively. For the restricted dataset, we find a best-fit outer radius of cm and an out-of-eclipse flux erg cm-2s-1. For the unrestricted dataset, the values of the outer radius and line flux we obtain are similar: cm and erg cm-2s-1. We will adopt the former values for our subsequent comparisons to the individual Heii line profiles.
In Fig. Eclipsing Broad Emission Lines in Hercules X-1: Evidence for a Disk Wind?b, we show our fit to the Civ 1548.195, 1550.770 light curve. We find a similar value of the outer disk radius for these data as our Heii fit, and an out-of-eclipse flux of erg cm-2s-1. In contrast to the Heii line, the Civ line flux at is substantially larger than the model value. This cannot be accounted for by our flat disk model. However, the best fit parameters are not significantly affected by inclusion of this data point. In addition, we have accounted for the Civ interstellar absorption mentioned by B00, which we determined by fitting the post-eclipse line profile. These features can be clearly seen in the profile in Fig Eclipsing Broad Emission Lines in Hercules X-1: Evidence for a Disk Wind?. The inclusion of these absorption components in the model does not significantly change the light curve shape.
For comparison, Table 1 shows the values of and which we have obtained for the various emission lines. It is worth noting that the higher ionization lines, Nv and Ov have systematically smaller outer radii. This is similar to the so-called “ionization stratification” which is inferred from reverberation mapping of the broad line regions of Seyfert Galaxies. For these objects, the lower ionization emission lines are found to be produced at larger radii than the higher ionization lines (e.g., Krolik et al. 1991; Korista et al. 1995).
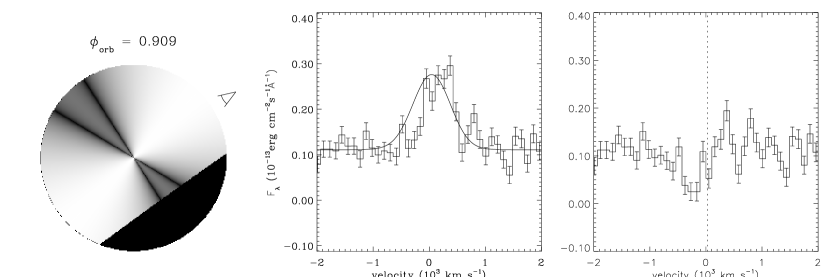
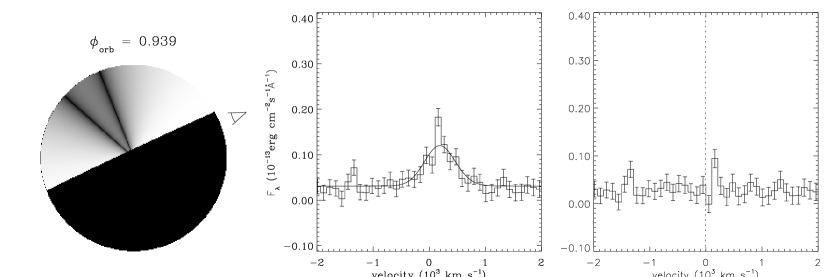
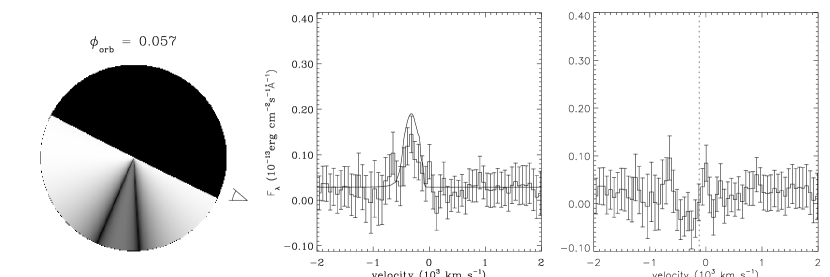
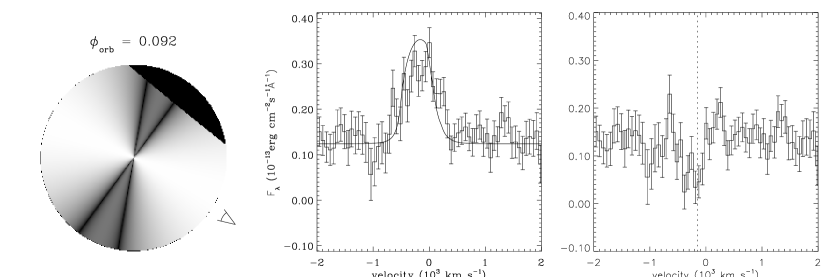
4.2 Line Profiles
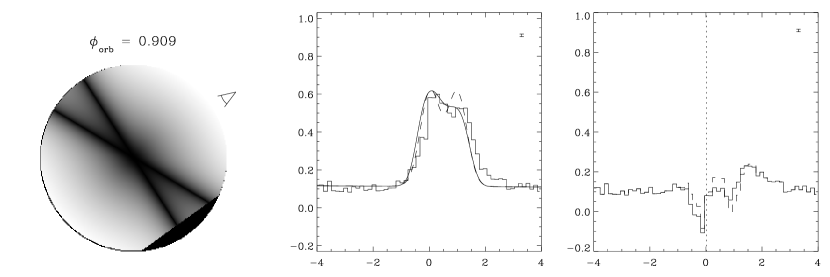
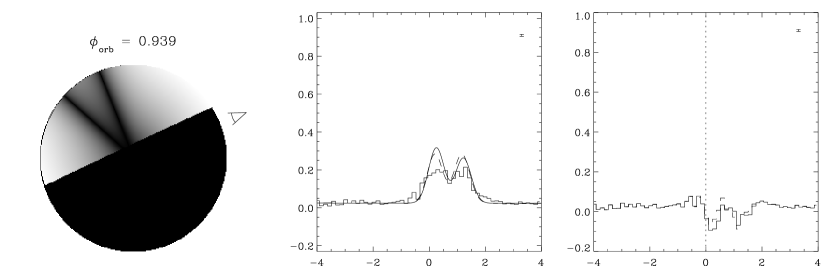
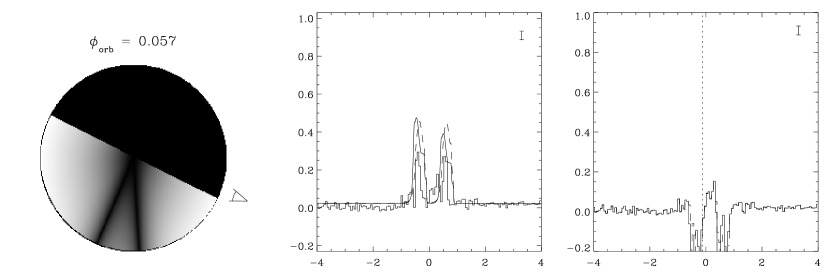
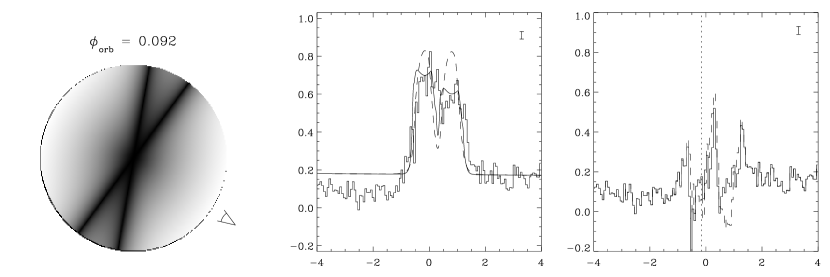
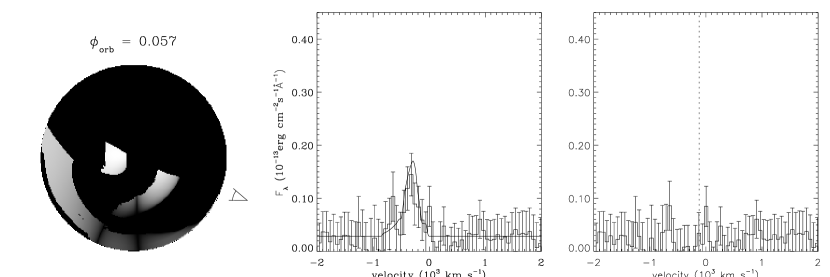
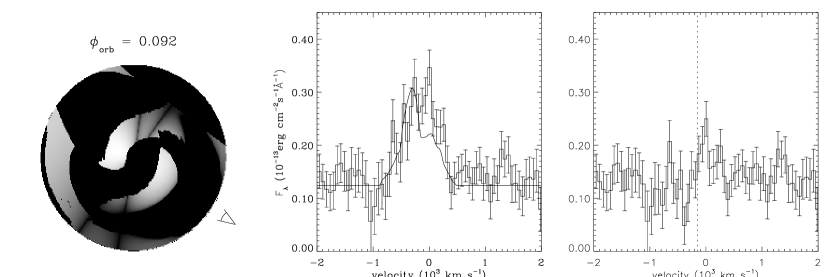
In Fig. Eclipsing Broad Emission Lines in Hercules X-1: Evidence for a Disk Wind?, we show, at orbital phases , 0.939, 0.057, 0.092, the apparent disk surface brightness, including partial obscuration by the companion (left panels), the observed and model spectra for the Heii line (middle), and the residual spectra after subtraction of the model line profiles (right). Although we could, in principle, show comparisons of the model with the data for all 29 spectra during the ingress phases, the spectra at and 0.939 are representative of the quality of the model fits for the spectra during the phase intervals –0.916 and –0.960, respectively. In order to give the reader some idea of how well the models describe the individual line profiles, we present in Table 2, values of and numbers of degrees-of-freedom (dof) for the various models and line profiles shown in Figures Eclipsing Broad Emission Lines in Hercules X-1: Evidence for a Disk Wind?, Eclipsing Broad Emission Lines in Hercules X-1: Evidence for a Disk Wind?, and Eclipsing Broad Emission Lines in Hercules X-1: Evidence for a Disk Wind?, as well as for the Siiv and Ov lines. It is clear from Tables 1 and 2 that the emission lines are not well described by these models in any formal statistical sense. That is beyond the scope of this paper. Instead, this work is meant to provide a plausibility argument for the origin of these lines in a disk wind, leaving to future work the various details of the model which are required to produce statistically satisfactory fits to the data.
The surface brightness pattern shown in Fig. Eclipsing Broad Emission Lines in Hercules X-1: Evidence for a Disk Wind? will be the same for all the lines since we assume the same velocity for the emitting gas and the same radial dependence for the source function with only the outer radius differing from line to line. The ratio of the emitted fluxes for the brighter to the darker regions at the outer radius is approximately a factor of 20. At , the observed line profile is red-shifted relative to the model profile. This appears as blue-shifted absorption in the residual spectrum and also holds for each of the profiles for phases –0.916. One interpretation of this absorption is that it is due to an out-flowing wind, such as the disk wind itself, which is scattering the underlying continuum and line emission. In Fig. Eclipsing Broad Emission Lines in Hercules X-1: Evidence for a Disk Wind?a, we plot the mean residual spectrum covering the ingress phases 0.902–0.916 for the Heii line, except that instead of subtracting the mean residual line fluxes at , we have instead added this residual flux to our model. We find a similar result for the Civ lines, and we plot these residuals in Fig. Eclipsing Broad Emission Lines in Hercules X-1: Evidence for a Disk Wind?b. For the fits to the Civ lines, we have again used the eclipse light curve to constrain the outer radius of the Civ emitting region and to find the normalization of the out-of-eclipse line flux (Fig. Eclipsing Broad Emission Lines in Hercules X-1: Evidence for a Disk Wind?b). We also assume that the lines are optically thick so that the doublet ratio is unity.
In the context of the wind interpretation for these residual P Cygni-like line profiles, we can place a rough lower limit on the wind column density based on the amount of blue-shifted absorption seen. For velocities less than zero, the equivalent width of the absorption in Civ is km s-1. In an expanding flow, at a given frequency, the optical depth will be , where is the number density of absorbers, is the abundance of carbon, is the fractional abundance of the C+3 ion, is the resonant-scattering cross-section, and is the Sobolev length scale. The width at zero intensity of the absorption is km s-1, so taking a mean optical depth of , we find a column density of cm-2. In making this estimate, we have also assumed the terminal velocity for the absorbing part of the wind to be 800 km s-1and that all of the carbon atoms are in the C+3 ground state. From this column density, we also estimate a wind mass loss rate of g s-1 using the radial velocity law, Eq. 9, assuming solar abundance of carbon and a characteristic wind footpoint radius of cm. These estimates of the wind column density and mass loss rate are very crude, but the implied value of is comfortably below the Eddington accretion rate g s-1.
4.3 Marginally Optically Thick Nv Emission
Before turning to the possible effects of a warped disk on the shape of the disk emission lines, we consider the Nv emission. As noted by Boroson et al. 1996 and B00, the doublet ratios for the Nv lines are significantly different from unity. For the July 1998 data, the values range from unity to 1.6. In their models of X-ray illuminated accretion disks, Raymond (1993) and Ko & Kallman (1994), found that the UV emission lines, including Nv, should be optically thick and therefore that the doublet ratio for these lines should be unity. By contrast, in the optically thin limit, the doublet ratio should be proportional to the ratio of oscillator strengths.
As we noted in our discussion of § 3, another indication of an optically thin line is a double-peaked profile. Optically thin lines will also be broader at half maximum than a single-peaked optically thick line. To illustrate this, we show in Fig. Eclipsing Broad Emission Lines in Hercules X-1: Evidence for a Disk Wind? disk wind emission lines for which we have varied the absolute scaling of the optical depth. From Eq. 7, the radial dependence of the line optical depth to lowest order is contained in two factors, the shear along the line-of-sight (cf. Eq. 12) and the line opacity . Here is the absorption coefficient which depends on the atomic properties and on the abundance of the relevant ion, and is the mass density. For simplicity, we will assume that the bulk of the emission for a given ion coincides with the locations in the disk wind for which the fractional abundance of that ion peaks. In ionization equilibrium, the relative fraction of ion to ion is proportional to the ionization parameter:
| (15) |
where is the number density of hydrogen ionizing photons, and is the number density of hydrogen atoms. Under the aforementioned assumption, the absorption coefficient is also proportional to , and we have where is the incident flux from the central X-ray source. For a flat disk and at large disk radii, the incident flux from a central source goes as . However, several effects, such as the possible flaring of the disk and downward scattering of the flux from the central source by material above the disk, can make the radial dependence of the incident flux closer to . In fact, both Raymond (1993) and Ko & Kallman (1994) model the incident flux using this radial dependence. Therefore, in order to be consistent with these authors, we take ; consequently, the optical depth will have a scaling. In our calculations, we model the line optical depth as
| (16) |
where . In Fig. Eclipsing Broad Emission Lines in Hercules X-1: Evidence for a Disk Wind?, we have set (dashed curve), (solid), and (dotted). The , marginally optically thick line produces a single-peaked, flat-topped profile with a larger width at half-maximum than the optically thick line.
A line shape similar to the marginally optically thick line shown in Fig. Eclipsing Broad Emission Lines in Hercules X-1: Evidence for a Disk Wind? provides a better fit to the Nv profiles than the optically thick profile. In Fig. Eclipsing Broad Emission Lines in Hercules X-1: Evidence for a Disk Wind?, we show fits to the Nv profiles using both emission lines (solid curves) and an optically thick line (dashed). In the marginally optically thick fits, we have adjusted the doublet ratio to be 1.22 since this is the expected doublet ratio if the stronger member of the doublet, Nv 1238.821, has an optical depth of 3. This doublet ratio also provides a reasonable estimate of the relative strength of the two components in the out-of-eclipse profile at (cf. B00). As for the Heii and Civ, the out-of-eclipse line flux normalization and outer radius of the Nv-emitting region was found by fitting the eclipse light curve. For the calculations, we find cm and an out-of-eclipse line flux of erg cm-2s-1, while for the optically, thick model, we obtain cm and essentially the same out-of-eclipse line flux. We have also performed these calculations using and find only small differences in the light curve and line profile shapes. In order to account for both the eclipse light curve and emission line shapes in this model, these results suggest that Nv line needs to be marginally optically thick with an optical depth of –3 at cm.
4.4 Emission Lines from a Warped Disk
The P Cygni-like residual profile is notably absent for the ingress phases , during which the neutron star is obscured (Fig. Eclipsing Broad Emission Lines in Hercules X-1: Evidence for a Disk Wind?). This would be consistent with absorption in a wind if the source of the UV continuum was centered on the neutron star and much smaller than the disk. However, the shape of the eclipse of the UV continuum (Fig. Eclipsing Broad Emission Lines in Hercules X-1: Evidence for a Disk Wind?f) is similar to that of the lines implying that the UV emitting region is also similarly extended. Matters are complicated further by the fact that the companion star may also make a significant contribution to the UV continuum (Leahy & Marshall 1999). In any case, the absence of P Cygni-like features during phases is problematic for the disk wind interpretation. One explanation is that a wind does not originate from every region of the disk, and hence the portions which are unobscured during phases do not exhibit blue-shifted absorption since there is no wind along the line-of-sight. If this were the case, however, we would expect a line profile shape more appropriate for a disk without a wind during these phases, whereas the disk wind profiles fit the data reasonably well at these phases.
An alternative explanation is that the apparent lack of blue-shifted line emission during may be due to the warped shape of the disk. Just as obscuration of the neutron star by the warp is invoked to explain the X-ray low states of the 35 d cycle, various parts of the line-emitting regions of the disk may also be blocked from our line-of-sight. In addition, self-shadowing of the disk is expected to occur which will affect the dynamics of the radiation-driven warping (Pringle 1997; Wijers & Pringle 1999). As far as the line emission is concerned, regions which are not exposed to the central X-ray source may not produce any line emission, or if those regions are illuminated indirectly by X-rays scattered by the wind (cf. Ko & Kallman 1994; Shakura & Sunyaev 1973), reduced emission may occur. In either case, the shadowed regions can in principle have different emission characteristics than the non-shadowed regions, and in both cases, line-of-sight obscuration by the disk itself will play a role.
In order to examine the effects of a warped disk, we consider two models for the shape of the warp in Her X-1. Although neither of these models is likely to be the correct one for describing the disk warp, they will serve to illustrate the effect that a warp can have on the line profile shapes. The first model is that of Schandl & Meyer (1994) and Schandl (1996) in which the warp is generated by torques from a Compton-heated wind. Although, this model has been criticized on both theoretical (Pringle 1996; Maloney, Begelman, & Pringle 1996) and observational (e.g., Scott et al. 2000) grounds, it provides a useful illustration of the shadowing effects we wish to explore. In order to compute the disk shape for this model, we use the Eulerian angles of the disk annuli shown in Fig. 1 of Schandl (1996). The tilts of the annuli range from 4∘ at the inner radius, passing through a maximum of 8∘ at cm, and having a value of at the outer radius of cm. The phases of the lines of nodes range from zero at the inner radius to at the outer radii.
The second model we consider is the phenomenological one proposed by Scott et al. (2000; hereafter SLW), based upon the shape of the 35 d light curve. Here, only the tilts and precessional phases of the inner and outer edges of the disk are specified. The tilts of the inner and outer disk annuli are 11∘ and 20∘ respectively with a relative phase shift of the lines of nodes of these two annuli of . In the absence of further information, we simply assume that the Euler angles describing the disk warp vary linearly with radius between these two limits. In this model, emergence of the X-ray source from behind the distant outer disk edge is responsible for the sharp turn-ons, while the gradual declines at the end of each high state is due to progressive occultation by the inner disk edge which is sufficiently close to the X-ray source so that it takes a significant amount of time to cover it completely. From examination of the occultation of the 1.24 s X-ray pulsations, SLW infer an inner disk radius of –40 neutron star radii. For definiteness we set cm. SLW also assume an observer inclination of . It is interesting to note that their model requires that the X-ray emission from the neutron star comes from different hemispheres depending on whether Her X-1 is in the main-high or short-high states. For the emission line calculation, because of the large observer inclination and large disk tilts in their model, this means that emission line radiation will be visible from both sides of the accretion disk, assuming it is geometrically thin. This is in contrast with the Schandl-Meyer model in which only one side of the disk and X-ray source are visible.
We show in Fig. Eclipsing Broad Emission Lines in Hercules X-1: Evidence for a Disk Wind? light curves for these two models assuming as before a line source function which depends only on radius . The major difference between these calculations and the flat disk models is that we account for obscuration along the line-of-sight due to the disk warp. In addition, because each disk annulus has a radius-dependent tilt, the velocity field of the flow and the Doppler shifts of each line-emitting disk wind element will be modified from the flat disk case. Since the disks are warped, the precessional phases are now important. For the 1998 July observations, B00 found –0.74 corresponding to the short-high state using the high-state turn-on measurements of Scott & Leahy (1999). We note that the ingress and egress data of B00 were separated by a full orbital (1.7 d) period. This partially accounts for the large difference between the model line fluxes before and after the eclipse. As expected, the magnitude of this difference depends on the specific shape of the disk warp.
The Schandl-Meyer model (Fig. Eclipsing Broad Emission Lines in Hercules X-1: Evidence for a Disk Wind?a), specifies the outer disk radius as cm which for simplicity we leave fixed at this value, although the size of the emitting region can in principle vary depending on the line considered. As with the flat disk model, we fit the Heii line fluxes over two orbital phase ranges, one excluding the dip –1.132 (solid curve) and the other over the full range 0.902–1.132 (dashed). For the SLW model (Fig. Eclipsing Broad Emission Lines in Hercules X-1: Evidence for a Disk Wind?b), only the tilt of the outer radius is specified and we allow both the line normalization and this outer radius to vary, finding a best-fit value of cm. Unlike the Schandl-Meyer model, fitting both ranges of orbital phase for the Heii data using the SLW model gives nearly identical results. This is due to the particular shape of the light curve produced by the SLW model which has a less steep decline in flux during the ingress phases than the light curves produced by either the flat or Schandl-Meyer models. On egress, the SLW model light curve is similar to that of the flat disk model, whereas the Schandl-Meyer model yields an eclipse light curve with steeper ingress and egress phases than those of the other two models.
In Figs. Eclipsing Broad Emission Lines in Hercules X-1: Evidence for a Disk Wind? and Eclipsing Broad Emission Lines in Hercules X-1: Evidence for a Disk Wind?, we show the apparent disk surface brightness for the Schandl-Meyer and the SLW models, and the line profiles associated with each model compared with the Heii data. Although, the Schandl-Meyer model shows a great deal of obscuration by the disk, it is largely red-blue symmetric so that the model profile is still noticeably blue-shifted at . By contrast, the SLW model at this phase has a larger portion of its disk obscured on the approaching side of the disk and therefore the overall Doppler shift of the line is in better accord with the data. At high spectral resolution (), the differences between the two models are much more apparent. The SLW profiles are narrower at zero intensity, owing mostly to the larger outer disk radius, while the Schandl-Meyer profiles exhibit more structure due to its more complex obscuration pattern on the disk surface.
5 Conclusions
We have presented calculations of the broad UV emission line profiles which are formed in an accretion disk wind for the X-ray binary Her X-1. Calculations performed assuming a flat accretion disk reproduce the eclipse light curve shapes for the July 1998 HST/STIS data reasonably well, although previous analysis of these data revealed out-of-eclipse variability in the broad line fluxes which are probably due to time-dependent variations in the emitting properties of the disk material. The flat disk line profiles also do a reasonable job of reproducing the shapes of the emission lines during eclipse as they evolve from red-shifted on ingress to blue-shifted on egress.
The flat disk model does not provide a perfect description of the line shapes however. At orbital phases –0.916, the observed profiles are more red-shifted than the model calculations. This may be due to scattering in an outflowing wind as evidenced by the residual P Cygni profiles for these phases (Fig. Eclipsing Broad Emission Lines in Hercules X-1: Evidence for a Disk Wind?). This explanation is attractive since P Cygni line profiles appear in the 1999 July HST/STIS spectra of Her X-1 at orbital phases (Boroson, Kallman, & Vrtilek 2000b). Alternatively, the relative red-shifts of the observed line shapes may be due to self-obscuration of the blue-shifted portions of a warped disk (Figs. Eclipsing Broad Emission Lines in Hercules X-1: Evidence for a Disk Wind? and Eclipsing Broad Emission Lines in Hercules X-1: Evidence for a Disk Wind?). Such self-obscuration may also be able to account for the line shape differences which are seen in the high resolution spectra at which the flat disk model consistently overpredicts (Figs. Eclipsing Broad Emission Lines in Hercules X-1: Evidence for a Disk Wind?, Eclipsing Broad Emission Lines in Hercules X-1: Evidence for a Disk Wind?, Eclipsing Broad Emission Lines in Hercules X-1: Evidence for a Disk Wind?). However, B00 note that there is evidence for narrow absorption in the Nv and Civ profiles at a Doppler shift of km s-1 which may significantly modify those line profiles at since the overall Doppler shifts of those lines are also km s-1 at this phase. This absorption also appears at phases , 0.132, and 0.171 at the same velocity, so it is unlikely to be associated with the disk either as an obscuring warp or outflow, as the overall Doppler shift would then vary by km s-1 over these phases (B00).
The main difficulty which this model faces is how a wind with the required characteristics can be launched from the surface of the disk. In previous analytic and numerical calculations of disk winds in AGNs and CVs, line driving provided the mechanism for accelerating the wind in which most of the initial acceleration was due to radiation produced in the disk itself (e.g., Murray et al. 1995; Proga, Stone, & Drew 1998). Although our treatment does not specifically require radiative acceleration to play a substantial role in producing the wind, large poloidal velocity gradients in the emission line region are a necessary ingredient. In the case of X-ray binaries such as Her X-1, it has been posited that any wind emerging from the disk would likely be thermally driven and have its origins in a Compton-heated corona which has been irradiated by the central X-ray source (Begelman, McKee, & Shields 1983). The scale height for such a wind should be comparable to the disk radius. This violates the underlying assumption in these calculations of a geometrically thin, albeit warped, disk. Furthermore, given these large vertical scale heights, it is unlikely that there will be poloidal velocity gradients which are comparable to the Keplerian velocity gradients.
An alternative mechanism for driving a wind from a disk is via magneto-centrifugal acceleration (e.g., Blandford & Payne 1982). In this model, the magnetic field lines thread the accretion disk and are anchored to the disk by flux freezing. If the field lines rotate rigidly with the disk and make an angle greater than with the disk normal, then material will be centrifugally accelerated along the field lines. If the magnetic field is largely poloidal then the acceleration of the disk material can be estimated by the condition that the angular velocity is constant along the field line. This leads to radial shears which are comparable to the Keplerian shears in the disk and single-peaked emission lines can be produced (Chiang & Murray 1997). However, in the self-similar solution of Blandford & Payne (1982; see also Emmering, Blandford, & Shlosman 1992), the magnetic fields near the disk are not mostly poloidal since the inertia of the accelerated material actually distorts the field lines and causes them to have a significant toroidal component in the -direction. The azimuthal shears are actually enhanced; the radial shears are much smaller than they would be if the field lines were poloidal; and as a result, the emission line profiles are strongly double-peaked (Chiang 2000).
It is far more likely in the case of Her X-1 that radiative acceleration does play a role in the formation of the broad emission lines. The existence of a chromospheric layer in which atoms with strong resonance lines are abundant implies that line driving pressure may well be important in determining the vertical structure of a X-ray irradiated disk atmosphere. For O stars, Castor, Abbott, & Klein (1975; hereafter CAK) argued that even in a static atmosphere the force due to lines will greatly exceed that due to gravity, making a line-driven wind inevitable. A cursory examination of the properties of the X-ray irradiated disk atmospheres computed by Raymond (1993) and Ko & Kallman (1994) reveals that similar conditions exist which may allow significant line-driving to occur.
Following CAK, we use a force multiplier formalism to describe the effects of line driving. Here the enhancement factor relative to electron scattering, the force multipler , is modeled as an inverse power of the electron scattering optical depth: , where and are parameters which depend on the driving continuum and on the composition and ionization state of the irradiated gas. For a static atmosphere, the electron scattering optical depth is where is the electron scattering opacity, is the mass density, and is the appropriate length scale which, for a disk wind, is . In the case of a X-ray irradiated disk atmosphere, we can estimate the relevant value of from the line optical depths quoted by Raymond and Ko & Kallman. The latter authors find line optical depths of . For resonance lines such as Civ this implies an electron scattering depth of for the chromospheric layer assuming a gas temperature of K. For O stars, such a small value of corresponds to the regime where has saturated at essentially because of the oscillator strength sum rule (CAK; Abbott 1982). At disk radii cm, Ko & Kallman (1994) find disk photosphere temperatures in the range – K, which is comparable to that of O stars making our use of this saturation value reasonable. Using this value of the force multiplier and for the driving flux, the acceleration due to radiation pressure from the disk is cm s-2. This exceeds the vertical component of gravity cm s-2 assuming a central mass of 1.3 , a disk radius of cm and a vertical height for the chromosphere of cm.
These arguments suggest that it would be worthwhile to perform calculations of X-ray irradiated disk atmospheres which include the effects of radiative acceleration. Such calculations would likely result in substantial changes to the disk vertical structure, line optical depths, and local energy balance, and may be able to account for the appearance of marginally optically thick emission lines such as those we have inferred for Nv. Furthermore, if radiatively driven winds do result, they may be important for producing a disk warp. For a given incident flux of radiation, winds can be more efficient at driving warps than radiation pressure (Pringle 1996). However, given the large scale heights of thermally driven winds such as those examined by Schandl & Meyer, it is difficult to understand the manner in which the wind back pressure is communicated down to the disk plane in order to produce non-axisymmetric torques on the underlying disk annuli. By contrast, the vertical length scale of a radiatively driven wind will be much smaller than that of a thermally driven wind since the gas does not have to reach the escape temperature in order to become unbound.
So it seems plausible that radiative acceleration plays a role in the dynamics of the line emitting regions of the disks in X-ray binaries. The appearance of broad single-peaked lines in the UV spectra of Her X-1 and the abundant evidence from the eclipse light curves and line profiles implying a kinematic connection with an accretion disk makes this scenario even more attractive.
Acknowledgements.
I thank Bram Boroson for providing data from the 1998 July HST/STIS observations and for several useful discussions. I thank Norm Murray for helpful comments and useful discussions. I also acknowledge helpful comments by the anonymous referee which have improved this paper. This work was support by NASA ATP grant NAG 5-7723. In conducting this research, the NASA Astrophysics Data System (ADS) Abstract and Article services have been used.References
- (1) Abbott, D. C. 1982, ApJ, 259, 282
- (2) Begelman, M. C., McKee, C. F., & Shields, G. A. 1983, ApJ, 271, 70
- (3) Blandford, R. D. & Payne, D. G. 1982, MNRAS, 199, 883
- (4) Boroson, B., et al. 1996, ApJ, 473, 1079
- (5) Boroson, B., et al. 2000a, ApJ, 529, 414 (B00)
- (6) Boroson, B., Kallman, T., & Vrtilek, S. D. 2000b, in preparation
- (7) Castor, J. I., Abbott, D. C., & Klein, R. I. 1975, ApJ, 195, 157 (CAK)
- (8) Chiang, J., & Murray, N. 1996, ApJ, 466, 704
- (9) Chiang, J., & Murray, N. 1997, in Proc. of Mass Ejection from AGN, eds. N. Arav, I. Shlosman, & R. J. Weymann (San Francisco: ASP Conf. Ser.), 252
- (10) Chiang, J. 2000, in preparation
- (11) Deeter, J. E., Boynton, P. E., & Pravdo, S. H. 1981, ApJ, 247, 1003
- (12) Dupree, A. K., et al. 1978, Nature, 275, 400
- (13) Emmering, R. T, Blandford, R. D., & Shlosman, I. 1992, ApJ, 385, 460
- (14) Frank, J., King, A., & Raine, D. 1992, Accretion Power in Astrophysics (Cambridge: Cambridge Univ. Press), p. 56
- (15) Giacconi, R., et al. 1973, ApJ, 184, 227
- (16) Gursky, H., et al. 1980, ApJ, 237, 163
- (17) Howarth, I. D. & Wilson, R. 1983, MNRAS, 202 347
- (18) Horne, K., & Marsh, T. R. 1986, MNRAS, 218, 761
- (19) Katz, J. I. 1973, Nature, 246, 87
- (20) Ko, Y.-K., & Kallman, T. R. 1994, ApJ, 431, 273
- (21) Korista, K. T., et al. 1995 ApJS, 97, 285
- (22) Krolik, J. H., et al. 1991, ApJ, 371, 541
- (23) Leahy, D. A. & Marshall, H. L. 1999, ApJ, 521, 328
- (24) Maloney, P. R., Begelman, M. C., & Pringle, J. E., 1996, ApJ, 472, 582
- (25) Maloney, P. R. & Begelman, M. C. 1997, ApJ, 491, L43
- (26) Murray, N., Chiang, J., Grossman, S. A., & Voit, G. M. 1995, ApJ, 451, 498
- (27) Murray, N. & Chiang, J. 1996, Nature, 382, 789
- (28) Murray, N. & Chiang, J. 1997, ApJ, 474, 91 (MC97)
- (29) Pauldrach, A., Puls, J., Kudritzki, R. P. 1986, A&A, 164, 86
- (30) Pringle, J. E. 1996, MNRAS, 281, 357
- (31) Pringle, J. E. 1997, MNRAS, 292, 136
- (32) Proga, D., Stone, J. M., & Drew, J. E. 1998, MNRAS, 295, 595
- (33) Raymond, J. C. 1993, ApJ, 412, 267
- (34) Rybicki, G. B., & Hummer, D. G. 1983, ApJ, 274, 380
- (35) Schandl, S. & Meyer, F. 1994, A&A, 289, 149
- (36) Schandl, S. 1996, A&A, 307, 95
- (37) Scott, D. M., & Leahy, D. A. 1999, ApJ, 510, 974
- (38) Scott, D. M., Leahy, D. A., & Wilson, 2000, ApJ, submitted (astro-ph/0002327)
- (39) Shakura, N. I., & Sunyaev, R. I. 1973, A&A, 24, 337
- (40) Soong, Y., Gruber, D. E., Peterson, L. E., & Rothschild, R. E. 1990, ApJ, 348, 641
- (41) Tananbaum, H., et al. 1972, ApJ, 174, L143
- (42) Trümper, J., et al. 1978, ApJ, 219, L105
- (43) Vrtilek, S. D., et al. 1991, ApJ, 376, 278
- (44) Vrtilek, S. D., et al. 1994, ApJ, 436, L9
- (45) Vrtilek, S. D., et al. 2000, ApJ, submitted
- (46) Wijers, R. A. M. J., & Pringle, J. E. 1999, MNRAS, 308, 207
| Line | Model | ||||
|---|---|---|---|---|---|
| ( erg cm-2s-1) | ( cm) | ( cm) | |||
| Heii | Flat | 1 | |||
| Heii () | Flat | 1 | |||
| Heii | Schandl-Meyer | 1 | |||
| Heii () | Schandl-Meyer | 1 | |||
| Heii | SLW | 0.04 | |||
| Heii () | SLW | 0.04 | |||
| Civ | Flat | 1 | |||
| Nv | Flat | 1 | |||
| Nv | Flat, | 1 | |||
| Siiv | Flat | 1 | |||
| Siiv () | Flat | 1 | |||
| Ov | Flat | 1 | |||
| Ov () | Flat | 1 | |||
| † fixed parameter |
| Line | Model | |||||
|---|---|---|---|---|---|---|
| km s-1 | 0.939 | 0.057 | 0.092 | |||
| Heii | Flat | () | 111/27 | 32/27 | 24/45 | 75/45 |
| Heii() | Flat | () | 127/27 | 31/27 | 26/45 | 71/45 |
| Heii | Schandl-Meyer | () | 153/27 | 47/27 | 17/45 | 68/45 |
| Heii() | Schandl-Meyer | () | 306/27 | 33/27 | 41/45 | 83/45 |
| Heii | SLW | () | 102/27 | 33/27 | 43/45 | 155/45 |
| Heii() | SLW | () | 102/27 | 32/27 | 45/45 | 163/45 |
| Civ | Flat | () | 491/35 | 223/35 | 404/64 | 243/64 |
| Nv | Flat | () | 2831/31 | 1505/31 | 1637/70 | 2251/70 |
| Nv | Flat, | () | 50537/31 | 10676/31 | 1022/70 | 30918/70 |
| Siiv | Flat | () | 423/17 | 94/17 | 135/35 | 243/35 |
| Siiv() | Flat | () | 559/17 | 74/17 | 132/35 | 247/35 |
| Ov | Flat | () | 316/23 | 165/23 | 51/46 | 457/46 |
| Ov() | Flat | () | 342/23 | 187/23 | 55/46 | 449/46 |
| ‡ velocity range over which was computed | ||||||
(a) Eclipse light curve of the Heii 1640.47 emission line data and model fits. The solid curve is the model light curve fit to data for (i.e., excluding the “dip”), and the dotted curve is the model fit to all of the data. (b) Civ 1548.195,1550.770 eclipse data and model light curves. (c)Nv 1238.821,1242.804 eclipse light curves. The solid curve is for a marginally optically thick emission line (see text) while the dotted curve is for an optically thick emission line. Although both light curves fit the data comparably well, the best-fit outer disk radii are significantly different: cm for the marginally optically thick line, while cm for the optically thick line. (d) Siiv 1393.755 eclipse light curves. As with Heii, the solid curve is fit to data for and the dotted curve is the model fit to all of the data. (e) Ov 1371.292 eclipse light curves. The solid and dotted curves are as for the Heii and Siiv lines. (f) UV continuum eclipse light curves obtained from deriving the fluxes for the Heii (crosses), Civ (stars), Nv (diamonds), Siiv (triangles), and Ov (squares) emission lines. The gradual decline and rise in continuum flux during ingress and egress imply that the UV emission is extended over a disk region comparable in size to the emission line regions.
Model versus Heii emission line data at various eclipse phases. Left: The images show the apparent disk surface brightness taking into account the effects of a disk wind. Lighter regions indicate strong emission while dark regions indicate suppressed emission. The “eye” symbol shows the orientation of the observer at each phase relative to the line-of-centers which extends horizontally to the right from the disk center. A line passing through the center of the disk and the “eye” corresponds to the disk locations with zero projected velocity as seen by the observer (neglecting the Doppler shifts induced by the orbital motion). The orientation of the eye relative to the surface brightness pattern can be understood from the zeroes of Eq. 12 as a function of the azimuthal angle which is measured with respect to this line. The dark bands along two of the disk diameters are regions of highly suppressed emission and are given by and ; the observer orientation is perpendicular to the band. The disk regions which are eclipsed by the companion are shown in black. Center: Heii emission lines as a function of projected velocity. Right: The residual spectra after subtracting the model line emission. For reference, the dotted vertical lines are the Doppler shifts of the neutron star due to the orbital motion of the system; these velocities should correspond to the line center for emission from the disk.
Model versus Civ emission line profiles. These calculations include interstellar absorption obtained from fitting the out-of-eclipse profile at (see text). The velocity scale is referred to the rest wavelength of the stronger doublet member, 1548.195Å.
Mean residuals after subtraction of the model line profiles for the ingress phases –0.916. The dashed lines are the estimates for the respective continua. Left: Heii emission line. Right: Civ line. These residuals can be interpreted as blue-shifted absorption and excess red emission due to scattering in a disk wind.
Disk wind line profiles for optically thick (, dashed curve), marginally thick (, solid), and optically thin (, dotted) emission.
Model versus Nv emission line profiles. The disk surface brightness images shown on the left are for a disk model with (Eq. 16) and therefore differ from the optically thick images shown in Fig. Eclipsing Broad Emission Lines in Hercules X-1: Evidence for a Disk Wind?. The solid curves in the middle and right panels are the marginally optically thick model with , while the dashed curves are for the optically thick model. For the marginally optically thick model, a doublet ratio of 1.22 is used. The error bars on the data are suppressed for clarity. The mean error bar size is shown in the upper right corner of each plot. The velocity scale is referred to the rest wavelength of the stronger doublet member, 1238.821Å.
Eclipse light curves for the (a) Schandl-Meyer and (b) SLW warped disk models fit to the Heii fluxes. The outer radius in the Schandl-Meyer models is fixed at cm. The solid and dashed curves correspond to fits to two subsets of the data used in order to find the out-of-eclipse flux normalization. Both the flux and outer radius are allowed to vary for the SLW fits to these data, yielding nearly identical results for both subsets of the data.
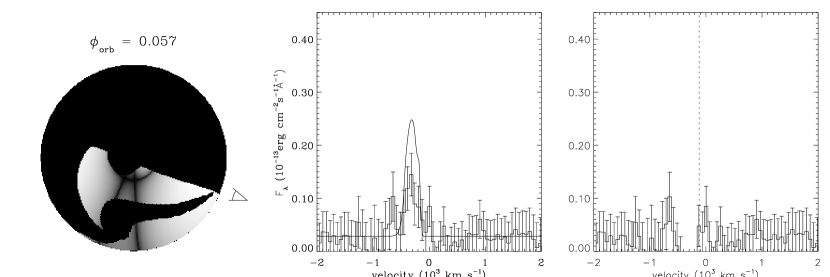
Apparent disk surface brightness, line profiles and residuals for the Heii line in the Schandl-Meyer warped disk model (cf. Fig. Eclipsing Broad Emission Lines in Hercules X-1: Evidence for a Disk Wind?).
Apparent disk surface brightness, line profiles and residuals for the Heii line in the SLW warped disk model. (cf. Fig. Eclipsing Broad Emission Lines in Hercules X-1: Evidence for a Disk Wind?).