e-mail: aabhijit@tifr.res.in, bojha@tifr.res.in
22institutetext: Physical Research Laboratory, Ahmedabad-390009, India
e-mail: canand@prl.ernet.in
Massive and luminous YSO IRAS 05361+3539 and its environment
Abstract
Near-infrared photometry and narrow/broad-band imaging of the massive and luminous young stellar object IRAS 05361+3539 are presented. Imaging observations were made at Mt. Abu while the photometric data were taken from the 2MASS. From the color-color and color-magnitude diagrams, we identified several sources of faint Class II type and about six Class I type in the parent molecular cloud complex. The IRAS 05361+3539 itself was seen to be a Class I object and our images in Br and H2 lines show jets/outflows from this object. The jet/outflow matches with the axis of CO outflow detected earlier. The near-infrared and the IRAS far-infrared flux distribution suggests a possible accretion disk with dust temperatures between 80 to 800K and extent of several tens to hundreds of AU. A possible FU Orionis type of source was detected in the cluster.
1 Introduction
Massive YSOs are protostars (Palla & Stahler, 1993) which are either surrounded by ultracompact HII regions or will eventually be hot enough to produce HII regions. They are mostly found buried deep inside clouds of gas and dust. The major difficulties in the study of massive YSOs are (a) there are fewer massive YSOs compared to low-mass YSOs and most of them are at a distance greater than 1 kpc from the Sun and b) most massive YSOs suffer large extinction (Av 10) and hence are difficult to study in the optical wavelengths. However, they can be studied in the radio and infrared wavelengths. Further, it is possible to study the environment of these objects with seeing limited spatial resolution in the near-infrared using array detectors like NICMOS.
Recent studies by Churchwell (1997) revealed that massive YSOs undergo similar bipolar outflows like the low-mass YSOs, but the rate of mass outflow is larger by orders of magnitude (3). Similarly luminosities of massive YSOs are also higher. The total mass locked in the outflow is often found to be larger than the central star. Churchwell (1997) proposed that the larger outflow mass could be due to the in-falling matter directly diverted into the bipolar jets. It is clear from earlier works (Shepherd & Churchwell 1996; Churchwell 1997; Hartquist & Dyson 1997; Hunter et al. 1997) that the impact of outflows from massive YSOs shapes the history of star-formation in the parent molecular cloud.
We have started a NIR observational program on studies of regions of massive star formation. This is our first paper in the series. In this paper we study the massive and luminous YSO IRAS 05361+3539 and the star formation in the neighborhood using 2MASS (The Two Micron All Sky Survey) data and new NIR observations from Mt. Abu, India. The region so far is not very well studied. IRAS source 05361+3539 (G173.58 +2.45) was studied in the millimeter lines (12CO and 13CO) by Shepherd & Churchwell (1996). The source is situated at a kinematic distance of 1.8 kpc (Wouterloot & Brand 1989). Earlier, Wouterloot et al. (1988) detected H2O maser from the source. The source is embedded inside a large molecular cloud. The FIR fluxes meet the conditions of Wood & Churchwell (1989) for UCHII regions and total FIR fluxes correspond to a B2.5 central star. Shepherd & Churchwell (1996) found bipolar flows in the 12CO velocity map with high velocities (up to -27.1 km/s in the blue shifted lobe) with a total mass of 32M⊙ locked in the outflow. They estimated from the IRAS fluxes the central star mass to be 7M⊙.
In section 2 we present the observations and data reduction procedures, section 3 deals with results and discussion and we summarize our conclusions in section 4.
|
||||||||||||||||||||||||||||||||||||||||||||||||||||||||||||||||||||||||||||||||||||||||||||||||||||||||||||||||||||||||||
2 Observations and data reduction
2.1 Observations from Mt. Abu
IRAS 05361+3539 (hereafter IRS1) was observed from the 1.2 meter Infrared Telescope, Mt. Abu, India, using a 256256 HgCdTe array (NICMOS-3, made by Infrared Laboratories, Arizona, USA). The telescope is located at an elevation of 1700 meters from the mean sea level and the instrument is described in Nandakumar (2000). Both the telescope and the NIR camera are owned by the Physical Research Laboratory, Ahmedabad, India.
The source was observed in two sessions: in J, H and K’ bands on 10th January 2000, and in narrow band filters centered on 2.12m (H2 ), 2.16m (Br), and 2.14m (continuum) on 25th February 2000. The FWHM of the narrow-band filters was 0.042m. The plate scale was 1′′ / pixel for the broad-band images and 0.5′′/ pixel for the narrow-band images. The nights were photometric during the observations. The seeing was 2′′ during the broad band observations and 1.5′′ during the narrow band observations. A large number of dithered sky frames were obtained ( by shifting the telescope 3 arcmin off the source in north-south-east-west directions) in all the filters for sky subtraction and for making flat frames. Although the 2.14m filter is supposed to exclude the nearby emission lines, we found from filter transmission curves that there is serious contamination from the 2.12m line. We therefore will not consider the 2.14m line image in this paper and will present the narrow band images as emission line plus continuum. We observed three standard stars (AS11, AS19, and AS21 from Hunt et al. 1998) during the observations. We used the relation given by Wainscoat & Cowie (1992) to obtain K’ magnitudes from K magnitudes.
The data reduction was done using IRAF software tasks. All the NIR images went through standard pipeline procedures like sky-subtraction and flat-fielding. Individual object frames were of 30s of integration in J and H band and 3s in K’ band. The images were co-added to obtain a final image in each band (J, H and K’) of total integration time of 150s. Further, in each band two such images were obtained. The images were further filtered using a median filter of 33 pixels for removing noise at sky-level, thus making them suitable for photometric analysis. We used DAOPHOT (Stetson 1987) task for deriving the photometry in the unvignetted field of view of 2 arcmins. The zero point was obtained using the three observed standard stars. From the J, H and K’ images containing the IRAS source, stars were identified down to 3 level (peak signal), subsequently each frame was visually inspected at different contrast levels to cross check the detection and remove false detections by DAOFIND. Aperture photometry was performed on the images using PHOT task with aperture radius of 4.5 pixels in the J, H and K’ images. The sky was sampled using 5-pixel wide annuli centered on each star with inner radius at 5 pixels. The aperture size was decided using the brightest and isolated star. From the two images of 150s in each band, we found that the overall photometric error is of 0.07 mag. This estimation includes uncertainties in the determination of zero-point ( 0.03 mag) from the observed three standard stars. We found that in the K’ images we could detect 12 stars up to 14.2 mag in the field of view of 2′ using the above mentioned procedure.
The narrow-band images also went through similar image processing. The total integration time was 250s in H2 and Br filters.
2.2 2MASS data
We extracted stars from the 2MASS point source catalogue which were within 8′ diameter of the IRAS source. The data were downloaded from the 2MASS Homepage available free for the Astronomical community. The 2MASS observations were carried out on 3rd February 1998111The date of observation was obtained from the header of the 2MASS fits images.. The 2MASS point source catalogue consists of J, H and Ks magnitudes of stars. The Ks band (bandpass =2.00m to 2.32m with center at 2.17m) is very similar to K band. A histogram of the 2MASS sources in the Ks band within a field of view of 8′ around the IRAS source was plotted. The histogram showed that the completeness limit is close to 15 mag.
Since the 2MASS catalogue goes deeper than the Mt. Abu images we decided to use the catalogue magnitudes to plot color-color and color-magnitude diagram. However, the magnitudes obtained from the Mt. Abu images will be used to find prospective variable stars and to study the morphology of the IRAS source and associations.
Table 1 shows a comparison of J,H,K’ and Ks magnitudes of stars detected within the unvignetted field of 2′ in the K’ image with the 2MASS point source catalogue. We found that for standard stars the difference in K’ and Ks magnitudes is less than 0.05 which is less than the photometric error. Hence we will treat the K’ and Ks magnitude scales as similar in this paper.
3 Results and Discussion


3.1 Star formation in the cloud
Figures 1 and 2 show the J-H/H-Ks color-color diagram and the Ks/H-Ks color-magnitude diagram of the sources from 2MASS data. In figure 1 the solid curve is the locus of points corresponding to unreddened main sequence stars (Koornneef, 1983). The two dashed lines are parallel to the reddening vector with magnitude of Av=30. They form the reddening band (drawn from the base and tip of the unreddened main sequence) and bound the region in which stars with normal photosphere fall (also see Hunter et al. 1995). Similarly, in Figure 2, the solid line represents the locus of unreddened main sequence and the dashed arrow shows the direction and magnitude of the reddening vector. We did a search in the SIMBAD database to find out any known sources around IRS1 with a search radius of 4.5′. Apart from the IRAS source and its H2O maser source, a star of A0V type (HD37317, 7.79 mag in Ks) was found in the SIMBAD search. This star’s co-ordinates are 05h 39m 19.9s +35∘ 38′ 30′′, that is approximately 2.8′ south-west from the IRAS source. We found from the 2MASS point source catalogue the colors of the star to be H-Ks=0.05 mag and J-H=0.031 mag. The colors of IRS1 are H-Ks=0.93 mag and J-H=1.45 mag.
Stars in figure 1 can be divided into three main groups a) those lying on the left side of the reddening band, b) those lying in the reddening band and c) those lying on the right side of the reddening band. The stars in the first group (a) plotted as open circles can be further divided into two sub-groups: one, those having J-H color less than 2 and second, those with J-H color more than 2. The former subgroup are mostly foreground stars as supported by their low values of Av (less than 5 mag), and the stars in the latter subgroup could be spurious detections since they have J and H magnitudes fainter than 17 and 16 mag respectively. The second group (b) mostly consist of normal stars with low values of Av (10) and background stars with high values of Av (10) and are also plotted as open circles. The third group (c) contains stars showing excess emission in H and Ks. Such sources are mostly YSOs (Lada & Adams 1992; Lada et al. 1993; Gomez, Kenyon & Hartmann 1994). YSOs can be further divided into Class I, Class II and Class III type sources based upon their Spectral Energy Distributions (SEDs) (Strom et al. 1989; Kenyon et al. 1993; Hartmann 1998). We have plotted sources redder than IRS1 and falling on the right hand side of the reddening band as ‘filled circles’ and are considered to be Class I type or protostars (since IRS1 is a known protostar; also see Lada & Adams 1992). Sources which show low H-Ks color (1.5) and J-H color (1.0) and also lying on the right hand side of the strip of reddening lines are also plotted as ‘open circles’. All these sources are faint in the Ks band (14 to 15.2 mag). Even though most of them are within the limit of completeness, we will need deep K band images to verify the existence of the sources. Their Av values range from 13 to 23 mag, suggesting that they could be Class II type sources (Kenyon et al. 1993).
It is clear from the J-H/H-Ks color-color diagram that the region around IRS1 is undergoing a phase of star formation. Three out of five Class I sources detected (excluding IRS1) are found within one arcmin radius of IRS1. Two of these sources are brighter than 14.2 mag in K’ and are detected in the Mt. Abu images. A comparison of magnitudes of these two sources # and # (see Table1) show that one of them #() has varied over the time of observation between 2MASS (February 1998, as given in the header of the FITS images) and Mt. Abu (January 2000). The star has become fainter by 1.1 mag in K’ and H bands in about 23 months. In the Mt. Abu J band image the star is not detected. Since the difference in magnitude is much larger than the photometric errors and the decrease in the brightness is consistent in K’ and H bands, we believe that this is real. The star also shows extreme reddening in the J-H/H-Ks color diagram, a typical characteristic of Class I sources and presence of circumstellar material. Variability in low-mass protostars is known (Hartmann 1998). The total luminosity depends on the mass accretion rate, and low mass protostars like FU Orionis type of objects have shown variability of several magnitudes in the optical wavelength (Bell et al. 1995, and references therein). It is possible that we have witnessed a FU Orionis kind of behavior from the star. However, we need further NIR observations to verify this.

3.2 Photometry and Spectral Energy Distribution of IRAS 05361+3539
IRAS 05361+3539 (IRS1) is a massive luminous YSO and is associated with an ultra-compact HII region (Shepherd & Churchwell 1996). The low-resolution NVSS contour plot shows emission towards IRS1 at mJy level(4)(Condon et al. 1998). The FIR IRAS fluxes of IRS1 at 100m, 60m, 25m, and 12m are 1310Jy (upper limit), 29.15Jy, 6.72Jy, and 1.18Jy respectively. We estimated the spectral index of IRS1 to be 1.1 between 60m and 1.12m (Jband). The source therefore belongs to the group of Class I type sources (Strom et al. 1989). The SED is shown as a plot (crosses) of Log/Log in figure 3 where is the wavelength in m and F is the flux in Watts/meter2. We determined the temperature distribution of the circumstellar matter by fitting a model (Anandarao, Pottasch, & Vaidya 1993) to the observed SED. We have assumed photospheric temperature of 20,000K, stellar radius equal to seven solar radii, and plane parallel geometry for the dust shells. The dashed line in Fig 3 shows the model. The derived dust temperatures are 800K at 4AU and 80K at 400AU from the central source. The uncertainties in the dust parameters could be as large as 10-20 % due mainly to the inherent non-uniqueness of the model and to some extent to the uncertainties in the assumed stellar parameters. These results confirm that IRS1 is a Class I type source. The range of dust shell parameters derived from the model seem to support the accretion disk scenario (Hartmann 1998; Adams, Lada & Shu 1987) in which case, the grain heating is due to two processes: one due to the reprocessing of UV photons and the other due to viscous heating in the disk (Hillenbrand et al. 1992). Following Hillenbrand et al. (1992) we estimate the minimum radius of an accretion disk attributing the entire 25m flux to the accretion heating of the grain (i.e. T=140K). We derive radius of the disk to be 160 AU if the inclination is 0∘ (face on).
3.3 Morphology of IRAS 05361+3539 and Detection of a NIR Jet
Figure 4 shows K’, H2 (emission line + continuum) and Br (emission line + continuum) images of IRS1. Figure 5 gives the contour map of H2 superposed on the K’ image. The plate scale in Fig 4 is 1′′/pixel for the K’ image and 0.5′′/pixel for the narrow band images.
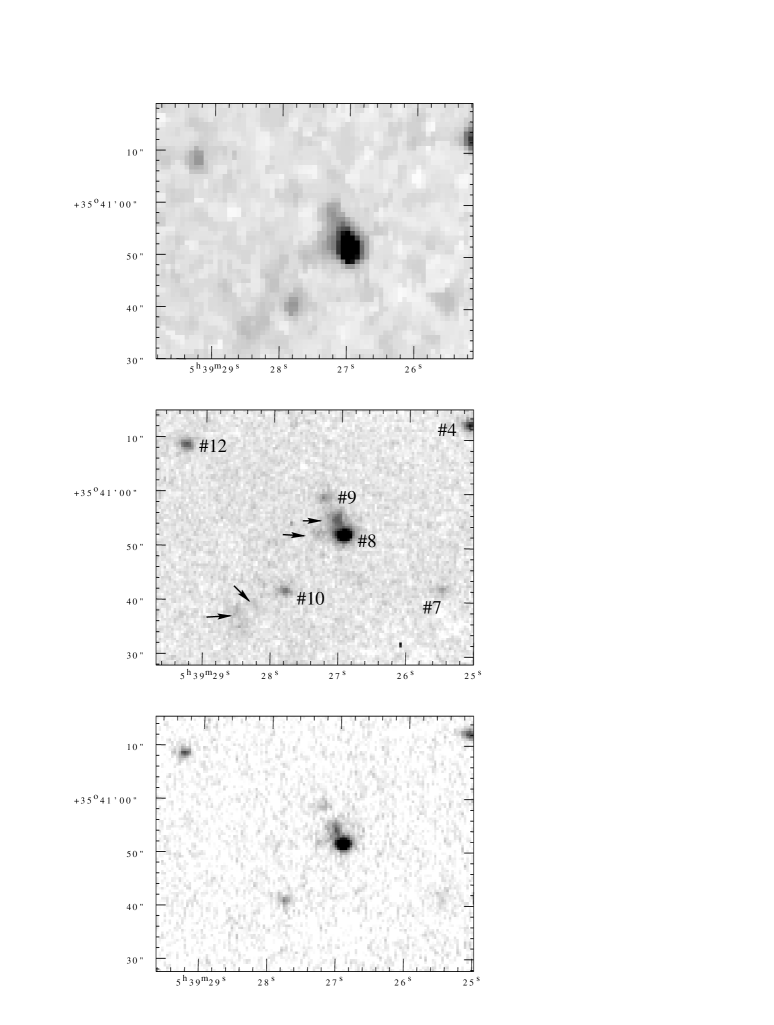
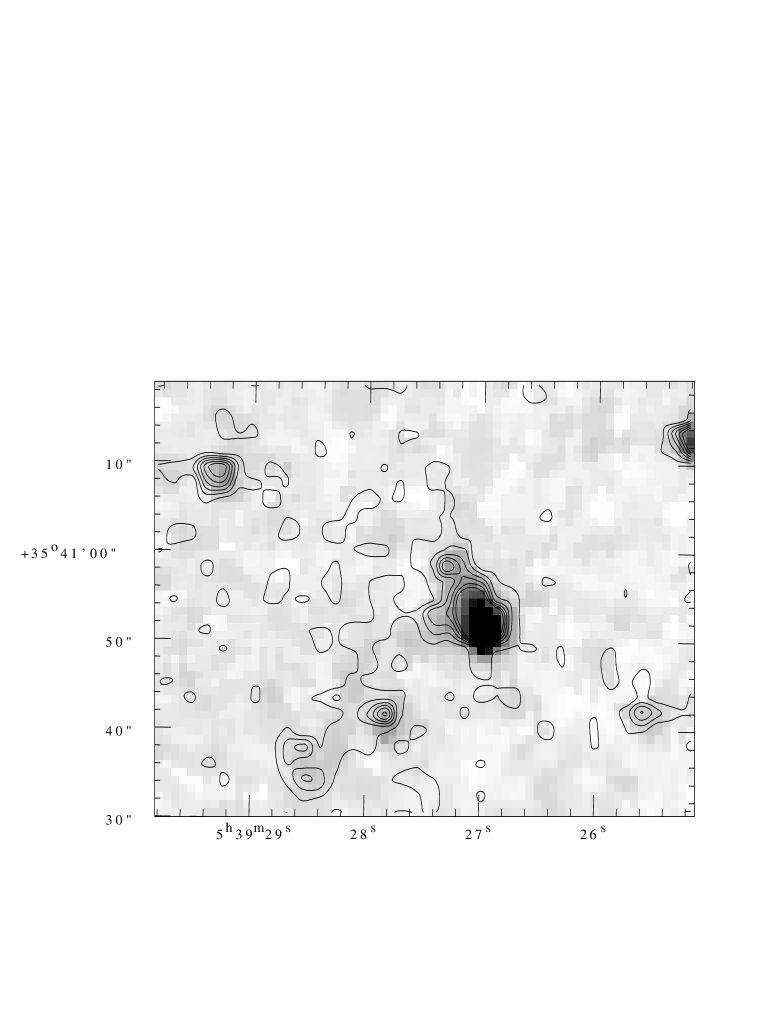
The NIR images reveal (figures 4, 5) that the IRS1 source is associated with a nebulosity extended up to 5′′ in the northern direction and a filamentary structure of length 6′′ in the east (seen more prominently in the H2+continuum image).
The eastern filamentary structure bends beyond 7′′ from IRS1 and continues another 20′′ in the southeast direction. Since we do not have a continuum free H2 emission line image we cannot quantify the amount of H2 emission from the region. However, we qualitatively argue from the brightness in the K’ and the H2+continuum image that at least 40% of the total brightness in the narrow band image is due to pure H2 emission. Further, the filamentary structure matches with the eastward jet found in the low resolution CO map of Shepherd & Churchwell (1996). Therefore, it is likely that the H2 emission is tracing the jet from the YSO. The bending of the jet could be because of physical obstruction of its flow due to the presence of putative dense matter. We do not see significant structure in the Br + continuum image. If one assumes a particle density of 105 /cm3, then there can not be sufficient flux of energetic UV photons available from a B2 star to ionize the matter except in optically thin regions.
The structure in the northern direction is six times brighter than the jet. There are three distinct possibilities regarding the nature of this structure. This could be an unresolved star closely associated with the IRS1 source. However, in the 2MASS point source catalogue there is no entry corresponding to that position. We will need high-resolution images in K band to prove that the northern structure is an unresolved star.
A second alternative is that the extended nebulosity is due to the presence of the ultra-compact HII region. From the near-infrared morphology, it appears that this could be a cometary UCHII region (Wood & Churchwell 1989). Supposing that the central star has a relative motion with respect to the parent molecular cloud, say a few km/s, such a supersonic motion can create a region of low density behind the star (Hughes & Viner 1976; Weaver et al. 1977). If we consider a dynamical time of 5.3104 years (Shepherd & Churchwell 1996) and a speed of 1km/s to 2km/s (Jones & Walker 1988) then, in as many years the star would have traveled a distance of 0.1 pc (upper limit). The extent of the extended nebulosity in the H2 + continuum image corresponds to about 0.04 pc (5′′, see figure 4). The density behind the central star should be much less (103 particles/cm3) for the UV photons to reach up to 0.04 pc.
NIR spectroscopy of UCHII regions have shown that they are bright in Br emission line (Armand et al. 1996; Doherty et al. 1994). Aγ for the UCHII region can be calculated from Av using the relation Aγ/Av=0.125 (for Rv=5.0 extinction law of Cardelli, Clayton & Mathis 1989), and it turns out to be 1.87 mag. The density of matter can also be calculated from the relation between Av and column density, Av/NH=1 10-21 mag/cm2 (Cardelli, Clayton & Mathis 1989). We determined the density of matter within 1 pc of the source assuming that most of the extinction is from within 1pc of the source. This gives a lower limit of density of 5x10³particles/cm3. The upper limit can be 105 particles/cm3, if we consider that most of the extinction is within 0.05 pc. The value of 0.05 pc has been assumed based on the fact that very close to the star up to 5000AU the density can be as high as 108 particles/cm3 and up to 0.5 pc it can be 105 particles/cm3 (Churchwell 1997). A sizable Stromgren sphere with the lower limit of particle density can be obtained for a central B2 type star. But, we do not see any significant brightness in the Br + continuum image compared to the K’ band image except at the core of the nebulosity. A deeper Br image will be required for dertermining the extent of the nebulosity.
As a third possibility, the extended nebulosity can be considered as a dense clump of molecular hydrogen in the parent molecular cloud. We found that the region is bright in the H2+continuum image and only qualitatively we can say that pure H2 emission is present. H2 emission can arise due to either UV fluorescence, or collisionally excited by the impact of stellar winds from IRS1 (Genzel, 1992).
From the above arguments, it appears that it is difficult to determine from the present data the nature of the extended nebulosity. High resolution radio continuum images and medium resolution NIR spectroscopy are necessary to resolve this issue.
4 Conclusion
The parent molecular cloud seems to be an active star forming region. We have found a total of 6 prospective Class I type sources in the region including IRAS 05361 +3539. A number of faint Class II type sources are also detected in the region. One of the Class I sources (star no.12) detected close to IRS1 shows extreme reddening in the J-H/H-Ks color-color diagram. This star also appears to be fainter in H and K’ band by 1.1 magnitude in the Mt. Abu images when compared with the 2MASS magnitudes. The time difference between these observations was 23 months. Therefore, star # 12 could be a variable protostar of FU Orionis type. We need further observations to prove it.
The infrared spectral index of IRS1 is estimated to be 1.1 from IRAS and NIR fluxes. Our model predicts the possibility of an accretion disk with dust temperatures from 80K to 800K and with an extent of several hundreds of AU. Traces of molecular H2 emissions have been detected along the CO jet axis mapped by Shepherd & Churchwell (1996) in the eastward direction. A nebulosity is also detected towards north extending up to 5′′ from IRS1. This could be due to either an unresolved star, an UCHII region, or a dense clump of molecular hydrogen.
Acknowledgements.
The present observations were made under a collaborative project between TIFR and PRL. We thank the staff at Mt. Abu IR Telescope facility for support during observations. We especially thank the referee Dr. Todd R. Hunter for his very useful comments on the paper which significantly improved the quality of the paper. This publication makes use of data products from the Two Micron All Sky Survey, which is a joint project of the University of Massachusetts and the Infrared Processing and Analysis Center, funded by the National Aeronautics and Space Administration and the National Science Foundation. This research has made use of the SIMBAD database, operated at CDS, Strasbourg, France.References
- (1) Adams, F.C., Lada, C.J., & Shu, F.H. 1987, ApJ, 321, 788
- (2) Anandarao, B.G., Vaidya, D.B., & Pottasch, S.R. 1993, A&A, 273, 570
- (3) Aramand, C., et al. 1996 A&A, 306, 593
- (4) Bell K.R., et al. 1995, ApJ, 444, 376
- (5) Churchwell, E. 1997, ApJ, 479, L59
- (6) Cardelli, J.A., Clayton, G.C., & Mathis, J.S. 1989, ApJ, 345, 245
- (7) Condon, et al. 1998, AJ, 115, 1693
- (8) Doherty, R.M., et al. 1994, MNRAS, 266, 497
- (9) Genzel, R. 1992, The Galactic Interstellar Medium, Saas-Fee Advenced Course 21, ed. Burton, W.B., Elmegreen, B.G., & Genzel, R., (Springer-Verlag) 275
- (10) Gomez, M., Kenyon, S.J., & Hartmann, L. 1994, AJ, 105, 1850
- (11) Hartmann, L. 1998, Accretion Processes in Star Formation, (Cambridge University Press)
- (12) Hartquist, T.W., & Dyson, J.E. 1997, IAU Symp. 182, Herbig-Haro Flows and Birth of Stars, ed. B. Reipurth & C. Bertout (Dordrecht Kluwer), 537
- (13) Hillenbrand, L.A. et al. 1992, ApJ, 397, 613
- (14) Hughes, V.A., & Viner, M.R. 1976, ApJ, 248, 622
- (15) Hunt, L.K., et al. 1998, AJ, 115, 2594
- (16) Hunter, T.R., et al. 1997, ApJ, 478, 283
- (17) Hunter, T.R., et al. 1995, A&A, 302, 249
- (18) Jones, B.F., & Walker, M.F. 1988 AJ, 95, 1755
- (19) Kenyon, S.J., et al. 1993, ApJ, 414, 773
- (20) Koornneef, J. 1983, A&A, 128, 84
- (21) Lada, C.J., & Adams, F.C. 1992, ApJ, 393, 278
- (22) Lada, C.J., et al. 1993, ApJ, 408, 471
- (23) Nandakumar, M.S. 2000, Ph.D. Thesis, Gujarat University, Ahmedabad
- (24) Palla, F., & Stahler, S.W. 1993, ApJ, 418, 414
- (25) Shepherd, D.S., & Churchwell, E. 1996, ApJ, 472, 225
- (26) Stetson, P.B. 1987, PASP, 99, 191
- (27) Strom, K.R., et al. 1989, ApJS, 71, 183
- (28) Wainscoat, R.J., & Cowie, L.L. 1992, AJ, 103, 332
- (29) Weaver, R., et al. 1977, ApJ, 218, 377
- (30) Wood, D.O.S., & Churchwell, E. 1989, ApJS, 69, 831
- (31) Wouterloot, J.G.A., & Brand, J. 1989, A&AS, 80,149
- (32) Wouterloot, J.G.A., et al. 1988, A&A, 191, 323