H I absorption in radio galaxies: effect of orientation or interstellar medium?††thanks: Based on observations with the Australia Telescope Compact Array, with the Very Large Array and with the Westerbork Synthesis Radio Telescope.
Abstract
A search for H I absorption has been made in 23 radio galaxies selected from a complete sample. The observations were made with the Australia Telescope Compact Array (ATCA), with the Very Large Array (VLA) and for one galaxy with the Westerbork Synthesis Radio Telescope (WSRT). In five galaxies H I absorption was detected. We investigate how the detection rate is distributed among galaxies with different radio and optical properties. Among the Fanaroff-Riley (FR) type I radio galaxies, only one object (10 of total) was detected in H I absorption. The H I absorption in these objects is likely to come from a nuclear disk, as found for other galaxies of this type (e.g. NGC 4261 and Hydra A). The low detection rate is consistent with the hypothesis (as suggested by optical and X-ray data) that the “standard” pc scale, geometrically thick torus is not required in low-luminosity radio galaxies. This is consistent with earlier optical work. In the case of FR type-II powerful radio galaxies, no H I absorption has been detected in broad line radio galaxies, while three out of four narrow-line radio galaxies have been detected (the one non-detection having quite a high upper limit). All these are compact or small radio galaxies. To first order this is consistent with the predictions of the unified schemes, assuming that the H I absorption is due to an obscuring torus. However, the indications of this being the only cause of the absorption are not very strong. In particular, we find that in two of the three detected objects that the H I is blueshifted compared to the systemic velocity. In the third galaxy (PKS 1549–79) two redshift systems (from the optical lines) are found. The uncertainty in the systemic velocity derived from optical lines is discussed. Finally, by also considering data available in the literature, we find a tendency for radio galaxies with a strong component of young stellar population and far-IR emission to show H I absorption. The overall richer ISM that is likely to be present in these galaxies may be a factor in producing the absorption.
keywords:
galaxies: nuclei — galaxies: ISM – galaxies: active – radio lines: galaxies1 Introduction
The near-nuclear regions of powerful radio galaxies are crucial for understanding the anisotropy of the radiation field and the fuelling of the activity, but currently very little is known about the distribution and kinematics of the gas close to the nucleus. One of the few ways to improve our knowledge is by studying the H I absorption against their radio nuclei. The advantage of this approach is that observations of the H I absorption against radio continuum sources open the possibility of detecting relatively small quantities of H I even in high redshift objects.
H I absorption has been found in a large number of different types of AGN. By looking at the properties of the absorption, it appears that this absorption can be caused by a variety of gaseous components.
For most radio galaxies in which H I absorption has been detected, (see for example Cygnus A, Conway & Blanco 1995 and Conway 1998; NGC 4621, Jaffe & McNamara 1994 and van Langevelde et al. 2000; Hydra A, Dwarakanath et al. 1995, Taylor 1996), it has been suggested that a disk with radius of the order of pc can be the cause for such absorption. In the case of Cygnus A VLBA observations (Conway 1998) show that the absorption is occurring against the counter-jet, and that it is elongated spatially in a direction perpendicular to the radio jet. This strongly suggests that the H I absorption is due to a circumnuclear torus that blocks the view of the quasar nucleus of Cygnus A. In the case of NGC 4621, the H I absorption on the VLBI scale (van Langevelde et al. 2000) appears against the counter-jet at a projected distance from the nucleus of only 5 pc. The cause of the absorption is believed to be a thin disk (1.3 pc thick). Finally, in Hydra A (Taylor 1996) the absorption is likely to arise from a disk with thickness of 30 pc. All of these structures could be part of a continuous structure which spans all the way from a many-kpc scale disk down to the classical accretion disk of a few tens of parsec in size. This has also been found to be the case for Seyfert galaxies (Gallimore et al. 1999).
A class of radio sources that appears to be particularly suitable for detecting and studying the H I absorption are Compact Symmetric Objects (CSO) and Compact Steep Spectrum (CSS) radio sources, as noted by Conway (1996). These are strong radio sources, a few kpc (i.e. sub-galactic) in size and are thought to be very young ( yr). It is claimed that in these objects the most likely cause of the H I absorption is also a nuclear disk/torus. However, the interpretation of some of these absorption profiles relies on the value of the systemic velocity that often is very uncertain.
Evidence of very broad absorption (400-500 km s-1, compared to the 50-200 km s-1 found in general in radio galaxies) has been found in luminous infrared galaxies (Mirabel 1989) like 4C 12.50 and 3C 433. In particular, Mirabel (1989) noted that for 4C 12.50 the shape of the H I absorption profile bares a striking similarity with that of starburst galaxies like Arp 220 (Mirabel 1982), suggesting a link between radio-IR spirals and powerful radio galaxies in the early stages of their evolution (like 4C 12.50).
The interaction between the radio plasma and the interstellar medium can also play a role. In the Seyfert galaxy IC 5063, very broad (700 km s-1) H I absorption, blueshifted with respect to the systemic velocity (Morganti et al. 1998, Oosterloo et al. 2000) has been observed coincident with a radio lobe about 1 kpc from the nucleus. This is clear evidence for a strong interaction between the radio plasma and the ISM in the galaxy, causing the cold gas to be ’blown out’ from the centre of the galaxy at large velocities. Evidence for interaction between the radio plasma and the ISM has been found in at least two radio galaxies: the superluminal object 3C 216 (Pihlström et al. 1999) and 3C 326 (Conway et al. in preparation). On even larger scale ( 10 kpc), H I absorption against the radio lobes has been found in the radio galaxy Coma A (Morganti et al. 2000a).
In some galaxies (e.g. Centaurus A, van der Hulst et al. 1983; NGC 1052 van Gorkom et al. 1986), additional narrow profiles are clearly seen, redshifted with respect to the systemic velocity by a few hundred km s-1. These profiles could correspond to gas clouds falling towards the AGN. Van Gorkom et al. estimated that these infalling clouds could provide the right amount of fuel for the AGN.
It is clear that radio galaxies show a diversity of H I absorption properties. However, most previous studies have been based on heterogeneous samples of objects, often including the most spectacular objects in a given redshift range. In order to establish the H I absorption properties of the general population of radio galaxies it is important to study a well-defined sample.
In an attempt to study the presence and properties of the H I absorption in radio galaxies in a more systematic way and to investigate whether the presence of the absorption can be related to other characteristics of the galaxies (e.g. orientation, as one would expect if the nuclear disk/tori are the cause of absorption) we have searched for H I absorption in a sample of radio galaxies for which a wealth of information (from radio, optical and X-ray observations) is available.
Here we present the results obtained for 23 radio galaxies observed so far. In §2 we describe the observations that were made either with the Australia Telescope Compact Array (ATCA) or with the Very Large Array (VLA) depending on the declination of the objects and for one galaxy with the Westerbork Synthesis Radio Telescope (WSRT). In §3 we describe the results obtained and we discuss in more detail the galaxies in which H I absorption is found. In §4 we discuss the occurrence of the H I absorption in the context of the overall characteristics of the sources, in §5 we discuss the difficulties in the interpretation of the data due to uncertainties in the systemic velocities derived from optical emission lines. Finally, in §6 we discuss the likely origin of the absorption in the galaxies of our sample.
In this paper we assume km s-1Mpc-1 and .
Table 1. Radio & optical characteristics of the observed galaxies
| Name | Other | Vhel | Radio | Optical | |||
|---|---|---|---|---|---|---|---|
| name | km s-1 | Morph. | 2.3 GHz | 2.3 GHz | 2.3 GHz | type1 | |
| 0034–01 | 3C 15 | 21885 | 1/2 | 25.80 | 23.77 | 0.010 | WLRG |
| 0035–02 | 3C 17 | 65860 | 2 | 27.00 | 26.00 | 0.113 | BLRG |
| 0055–01 | 3C 29 | 13427 | 1 | 25.50 | 23.70 | 0.016 | WLRG |
| 0123–04 | 3C 40 | 5396 | 1 | 24.67 | 23.05 | 0.025 | WLRG |
| 0305+03 | 3C 78 | 8590 | 1 | 25.30 | 24.33 | 0.121 | WLRG |
| 0325+02 | 3C 88 | 9060 | 2 | 25.11 | 23.71 | 0.042 | WLRG |
| 0428–53 | 11400 | 1 | 25.39 | 23.61 | 0.017 | WLRG | |
| 0518–45 | Pic A | 10510 | 2 | 26.21 | 24.62 | 0.027 | BLRG |
| 0521–36 | 16590 | … | 26.23 | 25.25 | 0.117 | BL Lac | |
| 0620–52 | 15320 | 1 | 25.40 | 24.16 | 0.062 | WLRG | |
| 0625–35 | 16367 | 1 | 25.59 | 24.86 | 0.227 | WLRG | |
| 1246–41 | NGC 4696 | 2958 | … | 23.90 | 21.73 | 0.007 | WLRG |
| 1251–12 | 3C 278 | 4497 | 1 | 24.65 | 22.84 | 0.016 | WLRG |
| 1318–43 | NGC 5090 | 3421 | 1 | 24.22 | 23.34 | 0.153 | WLRG |
| 1333–33 | IC 4296 | 3761 | 1 | 24.87 | 23.15 | 0.019 | WLRG |
| 1549–79 | 456722 | CFS | 26.59 | 26.34 | 1.310 | NLRG | |
| 1637–77 | 12801 | 2 | 25.45 | 24.04 | 0.040 | WLRG | |
| 1717–00 | 3C 353 | 9120 | 2 | 26.16 | 23.53 | 0.002 | WLRG |
| 1814–63 | 193502 | CSS | 26.14 | … | … | NLRG | |
| 1949+02 | 3C 403 | 17688 | 2 | 25.77 | 23.58 | 0.007 | NLRG |
| 2152–69 | 8476 | 1/2 | 25.79 | 24.28 | 0.031 | BLRG | |
| 2221–02 | 3C 445 | 16848 | 2 | 25.71 | 24.12 | 0.027 | BLRG |
| 2314+03 | 3C 459 | 65924 | 2 | 26.78 | 26.24 | 0.394 | NLRG |
1 NLRG = narrow line radio galaxy, BLRG = broad line radio galaxy, WLRG =
weak line radio galaxy
2 new values, see text for details.
2 The Sample and the Observations
The observed radio galaxies have been selected from the 2-Jy sample of radio sources (Wall & Peacock 1985, Tadhunter et al. 1993, 1998; Morganti et al. 1993, 1999 and references therein). This sample includes strong (S 2 Jy) radio sources with declination south of and redshift less than 0.7. Although the aim was to have a “complete” sample of radio galaxies observed in H I, the actual observed sample has been constrained by three technical limitations: 1) the observed objects have a radio core typically stronger than 60 mJy (one exception is the galaxy PKS 1949+02 (3C 403)); 2) the redshift limit reachable with the available receivers is between 0.15 and 0.22 (depending on the telescope used); 3) even inside this range a few objects could not be observed because their redshifted H I would fall in spectral regions with strong known radio interference. While the first two constraints have introduced some bias on the selection of the observed objects, the latter has just randomly affected the sample.
The radio and optical characteristics of the observed galaxies are summarised in Table 1, mainly taken from Morganti et al. (1997). In Table 1 we also included the values of (defined as the ratio of core to extended radio fluxes and considered to be a orientation indicator). We have observed nine Fanaroff-Riley (FR) type-I galaxies objects, eight FR type-II, two intermediate morphology galaxies, one BL Lac, and three compact radio galaxies (but one of them is the very low radio power galaxy NGC 4696). As derived from our optical spectra (Tadhunter et al. 1993, 1998), four galaxies are narrow line radio galaxies (NLRG), four are broad line radio galaxies (BLRG) and the remainder have weak optical emission lines (WLRG, EW 10Å). Note that some of the FR type-II selected have weak emission lines. Because of the limitations mentioned earlier, most of the objects in our sample are FR type-I radio galaxies or broad-line radio galaxies (that are known to have, on average, stronger radio cores compared to the narrow-line galaxies, Morganti et al. 1997). Also the large number of WLRG FR-II galaxies is due to the fact that they have relatively strong cores (Morganti et al. 1997).
Almost all observations were made either with the ATCA or with the VLA depending on the declination of the objects. We have used the 6 km configuration of the ATCA and the B-array configuration of the VLA. The spatial resolution of the ATCA and VLA data is typically between 6 and 10 arcsec. The log of the observations is given in Table 2. PKS 1333–33 was observed with both instruments. The ATCA observations of PKS 2152–69 are part of a larger study of the radio continuum properties of this object (Morganti et al. in prep). One galaxy (3C 459) was also observed with the WSRT. The system temperature of the new 21-cm frontends used at the WSRT is low ( K) even at the relatively low frequency of the redshifted H I in this object (1165 MHz), therefore allowing us to better estimate the characteristics of the absorption in this galaxy.
With the ATCA we were able to observe galaxies up to a redshift , corresponding to 1235 MHz. In the ATCA observations we used a 16 MHz bandwidth and 512 channels in order to be sure to have both a large velocity range and good velocity resolution. The velocity resolution obtained is km s-1 before Hanning smoothing. Each object was observed a number of times (for approximately 20 minutes each time) throughout a 12 h observing period in order to obtain as much as possible uniform coverage. As bandpass and flux-density calibrator we have used PKS 1934–638, assumed to have (according to the latest result by Reynolds, 1996) 15.1 and 14.9 Jy at 1235 and 1405 MHz, the lowest and highest frequencies used. We spent between 10 min and 1 hour on the bandpass calibrator, depending on the flux of the core of the observed sources. The log of the ATCA observations is given in Table 2a.
The VLA observations were made with a 6.25 MHz bandwidth and 64 channels. The spectral resolution obtained is 21 km s-1. Most of the observed radio galaxies have , but we also included two objects with . The observing time and frequency for each galaxy are given in Table 2b.
The WSRT observation of 3C 459 was made using the DZB backend, 10 MHz bandwidth 256 channels given about 12 km s-1 velocity resolution. This galaxy was observed for 3.6 h.
The spectral data were calibrated with the MIRIAD package (Sault et al. 1995). The continuum subtraction was done by using a linear fit through the line-free channels of each visibility record and subtracting this fit from all the frequency channels (“UVLIN”).
The estimated rms noises given in Tables 2a, b and c are taken from Hanning smoothed images obtained with natural weighting. We have also used the line-free channels for producing an image of the continuum emission.
Table 2a. Log of the observations: ATCA
| Name | Other | Date | Freq. | Band | Exp. | Beam (PA) | rms |
|---|---|---|---|---|---|---|---|
| name | MHz | MHz | Time(h) | mJy/beam | |||
| 0428–53 | 98/08/29 | 1367 | 16 | 3h | 7.56.3 (+30) | 3.34 | |
| 0518–45 | Pic A | 97/11/07 | 1372 | 16 | 3h | 8.15.8 (+8) | 3.20 |
| 0521–36 | 98/08/29 | 1346 | 16 | 3.5h | 10.06.8 (+8) | 3.15 | |
| 0620–52 | 97/11/07 | 1349 | 16 | 3h | 7.86.4 (+83) | 2.40∗ | |
| 98/08/30 | 1355 | 16 | 3h | ||||
| 0625–35 | 97/11/07 | 1349 | 16 | 3h | 9.25.2 (4.3) | 2.68 | |
| 1246–41 | NGC 4696 | 97/11/08 | 1405 | 16 | 3.5h | 7.57.0 (69) | 2.60 |
| 1318-43 | NGC 5090 | 97/11/08 | 1405 | 16 | 3.5h | 7.65.5 (–4) | 1.55∗ |
| 98/05/16 | 1405 | 16 | 10h | ||||
| 1333-33 | IC 4296 | 97/11/08 | 1405 | 16 | 3.5h | 9.26.3 (+3) | 2.79 |
| 1549-79 | 97/11/08 | 1235 | 16 | 3h | 5.67 | ||
| 1637-77 | 97/11/06 | 1365 | 16 | 3h | 6.55.8 (27) | 2.69 | |
| 1814-63 | 97/11/06 | 1336 | 16 | 3h | 5.75.4 (62) | 5.25 | |
| 2152-69 | 97/05/11 | 1382 | 16 | 10h | 6.76.3 (–15) | 2.02 |
Table 2b. Log of the observations: VLA
| Name | Other | Date | Freq. | Band | Exp. | Beam (PA) | rms |
|---|---|---|---|---|---|---|---|
| name | MHz | MHz | Time(min) | mJy/beam | |||
| 0034–01 | 3C 15 | 98/09/29 | 1324 | 6.25 | 15 | 7.26.3 (–2) | 0.65∗ |
| 99/10/30 | 50 | ||||||
| 99/11/04 | 40 | ||||||
| 0035–02 | 3C 17 | 99/10/30 | 1164 | 6.25 | 50 | 8.65.7 (+46) | 2.80 |
| 99/11/04 | 40 | ||||||
| 0055–01 | 3C 29 | 98/09/29 | 1360 | 6.25 | 30 | 8.06.4 (–36) | 1.00 |
| 0123–04 | 3C 40 | 99/10/30 | 1395 | 6.25 | 50 | 7.35.3 (+44) | 0.46∗ |
| 99/11/04 | 40 | ||||||
| 0305+03 | 3C 78 | 98/09/30 | 1381 | 6.25 | 12 | 6.45.5 (–54) | 0.95 |
| 0325+02 | 3C 88 | 98/09/30 | 1379 | 6.25 | 30 | 6.54.8 (–56) | 0.83 |
| 1251–12 | 3C 278 | 98/09/29 | 1399 | 6.25 | 30 | 11.45.7 (+35) | 1.50 |
| 1333–33 | IC4296 | 98/09/29 | 1403 | 6.25 | 30 | 19.74.9 (+22) | 1.90 |
| 1717–00 | 3C 353 | 98/09/29 | 1378 | 6.25 | 40 | 4.43.7 (–81) | 0.80∗ |
| 99/10/30 | 50 | ||||||
| 1949+02 | 3C 403 | 98/09/29 | 1341 | 6.25 | 90 | 5.95.2 (–77) | 0.65 |
| 2221–02 | 3C 445 | 98/09/29 | 1345 | 6.25 | 30 | 10.06.5 (–44) | 0.92∗ |
| 99/10/30 | 50 | ||||||
| 2314+03 | 3C 459 | 99/10/30 | 1165 | 6.25 | 50 | 6.14.3 (+67) | 3.82 |
Table 2c. Log of the observations: WSRT
| Name | Other | Date | Freq. | Band | Exp. | rms | Peak |
| name | MHz | MHz | Time(min) | mJy/beam | Jy | ||
| 2314+03 | 3C 459 | 00/05/24 | 1164.5 | 10 | 3.6h | 1.25 | 5.007 |
| rms noise from the combined data |
A few more objects from the 2-Jy sample have data available from the literature: NGC 4261 (PKS 1216+06, 3C 270) observed by Jaffe & McNamara (1994) and recently by van Langevelde et al. 2000; Hydra A observed by Dwarakanath et al. (1995) and Taylor (1996); 3C 317 (PKS 1514+07) observed by Jaffe (1991), Centaurus A (van der Hulst et al. 1983), PKS 1934–63 (Véron-Cetty et al. 2000), PKS 0023–26 and PKS 2135–20 (Pihlström et al. in prep). We shall consider also these objects in our discussion.
3 Results
Of the 23 radio galaxies we observed, five galaxies show H I absorptions: PKS 1318–43 (NGC 5090), PKS 1549–79, PKS 1814–63, PKS 1717–00 (3C 353) and PKS 2314+03 (3C 459). No H I in emission has been detected. The results obtained for our sample are summarised in Table 3. represents the maximum depth of the absorption, or its 3 limit.
The line profiles for the five detected objects are shown in Figs. 1 to 5. The -axis shows the heliocentric velocities derived using the optical definition. The systemic velocities (defined as ) are marked in the plots. The values are taken from the literature (see the notes for details), except in the case of PKS 1549–79 and PKS 1814–63. For these objects the velocities are derived from new or re-analysed spectra and more details are given below in the notes. For the extended objects an image (obtained using the line-free data and using uniform weighting) of the radio continuum is also shown.
Table 3. Parameters of the H I absorptions
| Name | Other | (Jy) | N | |||
| name | Jy | % | km s-1 | cm-2 | ||
| 0034–01 | 3C 15 | 0.702 | 0.002 | 0.3 | … | 0.15∗ |
| 0035–02 | 3C 17 | 0.981 | 0.012 | 0.9 | … | 0.47∗ |
| 0055–01 | 3C 29 | 0.060 | 0.003 | 5.1 | … | 2.82∗ |
| 0123–04 | 3C 40 | 0.057 | 0.002 | 2.5 | … | 1.35∗ |
| 0305+03 | 3C 78 | 0.716 | 0.004 | 0.4 | … | 0.22∗ |
| 0325+02 | 3C 88 | 0.091 | 0.003 | 2.8 | … | 1.52∗ |
| 0428–53 | 0.165 | 0.010 | 6.3 | … | 3.44∗ | |
| 0518–45 | Pic A | 0.728 | 0.010 | 1.3 | … | 0.73∗ |
| 0521–36 | 5.546 | 0.009 | 0.2 | … | 0.09∗ | |
| 0620–52 | 0.368 | 0.007 | 2.0 | … | 1.08∗ | |
| 0625–35 | 1.200 | 0.008 | 0.7 | … | 0.37∗ | |
| 1246–41 | NGC 4696 | 0.920 | 0.008 | 0.9 | … | 0.47∗ |
| 1251–12 | 3C 278 | 0.069 | 0.005 | 6.7 | … | 3.70∗ |
| 1318–43 | NGC 5090 | 0.275 | 0.008 | 2.9 | 150 | 2.7 |
| 1333–33 | IC 4296 | 0.156 | 0.006 | 4.1 | … | 2.23∗ |
| 1549–79 | 4.73 | 0.120 | 2.6 | 100-200 | 3.6 | |
| 1637–77 | 0.175 | 0.008 | 4.7 | … | 2.59∗ | |
| 1717–00 | 3C 353 | 0.094 | 0.010 | 10.9 | 300 | 42 |
| 1814–63 | 11.9 | 2.280 | 21.3 | 75 | 17 | |
| 1814–63 | 11.9 | 0.100 | 0.8 | 300 | 20 | |
| 1949+02 | 3C 403 | 0.021 | 0.002 | 9.8 | … | 5.35∗ |
| 2152–69 | 0.583 | 0.005 | 1.0 | … | 0.57 | |
| 2221–02 | 3C 445 | 0.064 | 0.003 | 4.4 | … | 2.42 |
| 2314+03a | 3C 459 | 3.932 | 0.033 | 0.8 | 400 | 2.7 |
∗Values derived using a width of 30 km s-1 and 3 noise level.
a VLA data
For all galaxies we have derived both the peak optical depth and the integrated column density of the H I (or the limit to that) and the results are given in Table 3. A more detailed description of the detected objects is given in the notes to the sources. The measured depth of the H I absorption line, , depends on both the optical depth and the covering factor as: where S is the continuum flux density. The peak optical depths (column 6 in Table 3), , are estimated using the flux (core or total depending on the size of the source) derived from the continuum image obtained from the line-free channels in our observations (see column 4 of Table 3 for the flux density of the nucleus). For our calculations the covering factor has been assumed to be and we will not be able to put constrains on this value until we can image the absorption using VLBI. Thus, the derived optical depths (and the column densities) can be considered as lower limits. The values of the peak optical depth go from 0.5% for 3C 459 and 3% for PKS 1318–43 and PKS 1549–79, up to 11% for 3C 353 and 21% for PKS 1814–63. The full width of the H I profiles measured at 20% of the peak profile intensity () are given in column 7 of Table 3.
The integrated column density (column 8 in Table 3) has been estimated as: , where is the spin temperature in Kelvin.
The spin temperature is a very uncertain parameter in deriving the column densities. The value of the spin temperature is essentially unknown for extragalactic sources, so typical Galactic values (between 100 and 1000 K, Heiles & Kulkarni 1988) are often assumed. However, the presence of a strong continuum source near the H I gas may significantly increase the spin temperature because the radiative excitation of the H I hyperfine state can dominate the usually more important collisional excitation (see e.g. Bahcall & Ekers 1969). If the gas producing the H I absorption is in a circumnuclear torus (i.e. at a distance pc from the nucleus), it will be irradiated by the hard X-ray emission from the nucleus. According to Maloney et al. (1996, and references therein), purely atomic gas in these conditions has a stable equilibrium temperature of 8000 K.
For the undetected galaxies, a 3 limit to the peak optical depth was estimated and is given in Table 3. For these galaxies, the upper limits to the column density (also given in Table 3) were calculated by assuming a profile width of 30 km s-1. The upper limits to the optical depth are typically between 0.5 and a few %, with the extreme values of 9% for 3C 278 and 3C 403 – objects with particularly weak cores. Some of the upper limits are due to observations not being deep enough, but many are significant upper limits indicating that in those objects no H I absorption is observed at the level at which it is typically observed in the other radio galaxies.
Below we give some more details about the objects in the sample detected in H I absorption.
3.1 PKS 1318–43 (NGC 5090)
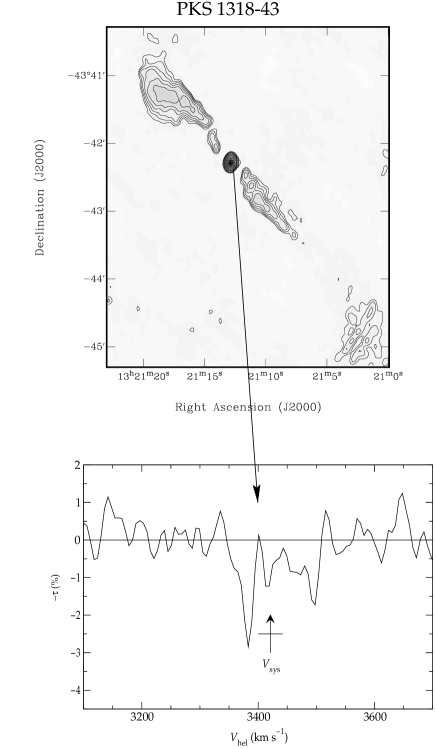
This is a typical FR-I radio galaxy as can be seen from the radio images presented in Morganti et al. (1993) and Lloyd, Jones & Haynes (1996). In Fig. 1 we present the continuum image obtained from our data as described above. NGC 5090 is believed to be part of an interacting system together with a nearby spiral galaxy NGC 5091 (Smith & Bicknell 1986).
H I absorption is detected against the core (see Fig. 1). The H I profile appears double peaked, although the relatively high noise level does not allows us to say much about its shape. The full width at 20% of the peak is 150 km/s. The H I velocity derived as arithmetic mean of the velocities at 20% of the peak intensity of the H I profile is 3425 km s-1. This is very close to the systemic velocity of the galaxy (3421 km s-1, Tadhunter et al. 1993). The peak optical depth is about 3% and the integrated column density cm-2.
3.2 PKS 1549–79
PKS 1549–79 is a core-jet radio source of 400 pc (about 120 mas) in size and has been studied in detail at radio frequencies by King (1994) and King et al. (1996) using the southern VLBI network. Overall it has quite a flat spectral index because the flux is dominated by the core component (about 3 Jy at 2.3 GHz and spectral index ).
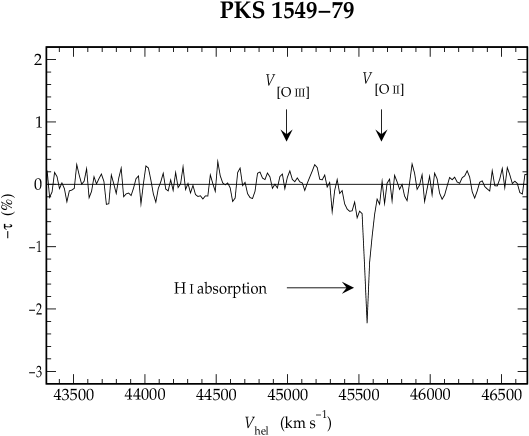
The H I absorption detected (see Fig. 2) appears to be formed by a narrow component ( 100 km s-1) peaked at 45580 km s-1, although a broader component ( 250 km s-1), mainly on the blue side of the narrow component, is possibly detected. The peak optical depth of the narrow component is about 2.5%. The integrated column density (including the broad absorption) is cm-2.
A new optical spectrum was obtained for this galaxy with the 3.6-m ESO telescope. A detailed discussion of the optical characteristics of PKS 1549-79 will be presented in Tadhunter et al. (2000). For the interpretation of the H I absorption the finding that the low and high ionization lines ([O II] and [O III] respectively) give quite different values for the redshift is particularly relevant. From the [O III] line a value of (or km s-1) is derived, while from the [O II] line we obtain (or km s-1). An other interesting characteristic is that the [O III] line has a width of 1345 km s-1 FWHM. This is one of the largest widths measured in radio galaxies. The [O II] has a smaller width (about 650 km s-1 FWHM). Thus, we believe that much of the [O III] is emitted by an inner narrow line region, which is undergoing outflow from the nucleus, whereas the [O II] emission is likely to come from a outer region (less affected by the outflow). This result is further discussed in §5.
An other interesting feature of this galaxy is that indications of ongoing star-formation have been found by carefully fitting the optical spectrum (Dickson 1997). This is quite rare for powerful radio galaxies. PKS 1549–79 is also strong in the IR: despite the high redshift it has been detected by IRAS with a IR luminosity of if we use the 100 upper limit as a detection. This derived luminosity is high for a radio galaxy.
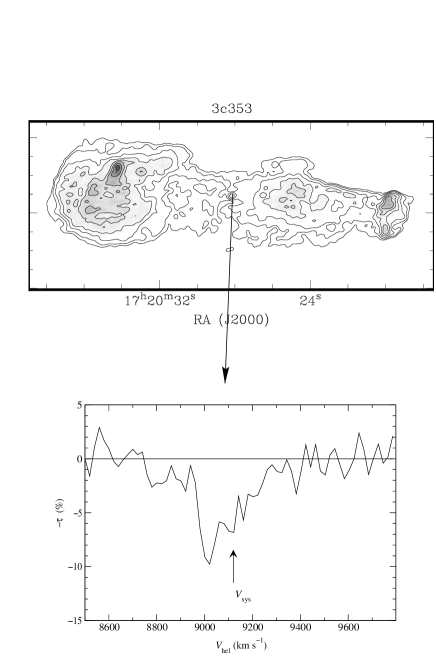
3.3 PKS 1717–00 (3C 353)
PKS 1717–00 is a strong radio galaxy with a FR-II morphology. The radio structure is shown in the continuum image in Fig.3 and a detailed study of the structure of this source, and in particular of the well collimated jet (and counter-jet), has been done by Swain, Bridle & Baum (1999). Despite being a powerful radio galaxy, only weak [O III] and H emission lines have been detected in the spectrum of this object (Tadhunter et al. 1993). The optical continuum of this object is very red (Simpson et al. 1996).
At the position of the radio core we detect H I absorption (see Fig. 3) with an optical depth of 11% and a width of km s-1(but this is very uncertain due to the poor signal-to-noise). The integrated column density is quite high: cm-2
The systemic velocity is km s-1 (or ) from the RC3 (De Vaucouleurs et al. 1991), very close to the peak of the H I absorption.
3.4 PKS 1814–63
PKS 1814–63 is a Compact Steep Spectrum (CSS) source with a basic double-lobed structure oriented almost north-south (Tzioumis et al. 1996). Because VLBI radio continuum observations are available for this galaxy at only one frequency (2.3 GHz), no information is available on which of these structures (if any) correspond to the core. The overall extent of the source is 410 mas corresponding to 328 pc.

In PKS 1814–63 deep H I absorption is detected. Véron-Cetty et al. (2000) have also independently detected H I absorption in this galaxy. The profile can be seen in Fig.4 and it shows deep absorption together with a broad shallow feature. The former component is centred on km s-1 (corresponding to ), has 75 km s-1 and a peak optical depth of 20%. The broad component has km s-1 centered on km s-1, and has an optical depth of a few percent, more similar to what usually found in other galaxies. The integrated column density of the deep component is cm-2. Including also the broad component the column density is cm-2.
We have re-analyzed the optical spectrum presented in Tadhunter et al. (1993). Because of the presence of a bright star near the object, the quality of the spectrum is low. However, by doing a more careful extraction of the spectrum, we have now detected the emission line at higher S/N, and, consequently, have been able to determine a more accurate redshift. We derive a new value for the redshift of the galaxy of , corresponding to km s-1. This is different from the previously derived redshift. Although this new redshift will require further confirmation with better data, the H I absorption appears now mostly blueshifted respect to the new systemic velocity.
3.5 PKS 2314+03 (3C 459)
In this galaxy the optical continuum spectrum is bluer than that of a typical early-type galaxy, and absorption features suggestive of young stellar populations have been detected (Miller 1981). The emission-line spectrum indicates moderate ionization.
The radio morphology shows a strong nuclear component and two very asymmetric lobes (Ulvestad 1985 and Morganti et al. 1999). The size of the radio emission is only 10 arcsec (corresponding to 48 kpc). The central component detected in the VLA image (see e.g. Morganti et al. 1999) has been found by higher resolution Merlin observations (P. Thomasson private communication) to be resolved in two components, both with a steep spectral index.
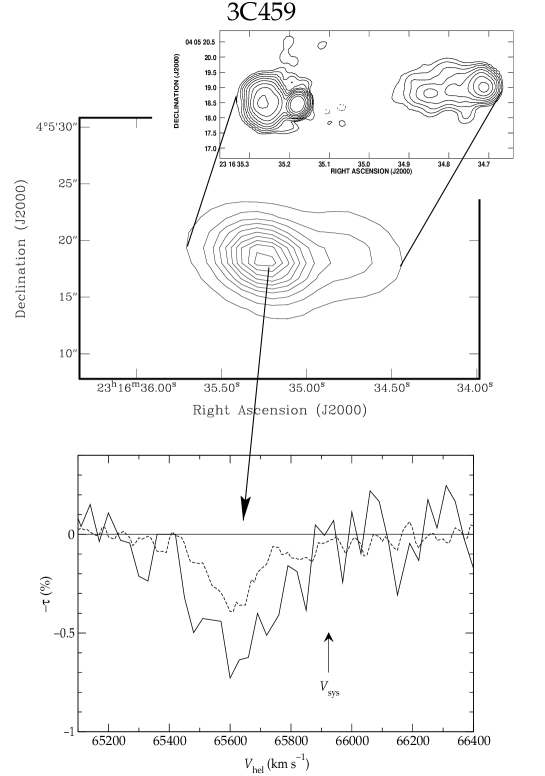
At the resolution of the WSRT data the continuum emission from 3C 459 is unresolved, while at the resolution of the VLA the continuum emission is slightly resolved (see Fig. 5).
The peak optical depth is only about 0.7% in the VLA data and even lower (0.4%) in the WSRT data. The difference between the two is most likely due to a dilution effect: the WSRT data include the continuum flux from the entire source while from the VLA data it is clear that the absorption is coming from the core and/or eastern lobe. Only higher resolution observations will tell us whether the absorption is really against the core or more against the lobe. The FWHM of the absorption appears to be quite broad in our VLA data (400 km s-1) and is confirmed by the higher quality WSRT profile shown in Fig. 5. The absorption is centered on km s-1. The systemic velocity is 65924 km s-1 (corresponding to a redshift of 0.2199, Spinrad et al. 1985).
The integrated column density derived from the VLA data is similar to those found for most other radio galaxies: cm-2.
4 Occurrence of H I absorption and the relationship with other characteristics
H I absorption is detected in 5 galaxies of the 23 observed. The detection rate is between 20 and 30% depending whether we also consider the data available in the literature. Among the latter, 7 galaxies were observed and 5 detected: these numbers are likely to be biased toward detection (it is less likely that non-detections are published!). A similar detection rate was found in the only other systematic search for H I absorption (van Gorkom et al. 1989).
We can now investigate how the detection rate is distributed among galaxies with different optical and radio properties.
-
1.
Of the 10 Fanaroff-Riley type-I radio sources observed (including also the intermediate galaxy 3C 15), we detect absorption in only one galaxy (PKS 1318–43). A few more cases can be included if the data from the literature are considered (e.g. Hydra A, Centaurus A and NGC 4261). Nevertheless, the fraction of detections remains small.
-
2.
So far, no H I absorption has been detected in any broad line radio galaxy in our sample (see also below).
-
3.
In both compact powerful radio galaxies (PKS 1814–63, PKS 1549–79) observed by us, H I absorption is detected. 3C 459 is also a relatively small object and has a compact steep spectrum core (that has been interpreted as an indication of objects embedded in gas-rich environments, van Breugel et al. 1984) and it also shows H I absorption. Two more compact sources in the sample were observed with the WSRT (Pihlström et al. in prep.). Only in one of the two H I absorption was detected (PKS 0023–26). However, it is worth mentioning that the undetected source (PKS 2135–20) is likely to be a broad line radio galaxy. Broad wings have been detected in the Mg II line of this galaxy (Shaw et al. 1995). This would be consistent with the trend for BLRGs described above.
-
4.
In the recently completed spectroscopic survey of 20 southern 2-Jy radio galaxies (, Tadhunter et al. in prep.) only two galaxies (3C 459 and PKS 1549–79) are clearly dominated by starbursts at optical/UV wavelengths, and these two objects are also the only two in our sample to be detected by IRAS at 60 m. It is remarkable that H I absorption is detected in both of these galaxies.
-
5.
H I absorption is detected in a FR-II radio galaxy with weak emission lines: PKS 1717–00 (3C 353). Although the upper limits for the other two galaxies of this kind (3C 88 and PKS 1637–77) are quite high, they do not show H I absorption at the level detected in PKS 1717–00.
-
6.
no H I absorption is detected in the BL Lac object, PKS 0521–36.
A discussion of the origin of the H I absorption will be made in §6.
5 The problem of the systemic velocity
An important issue for understanding the origin of the H I absorption is how the systemic velocity of the galaxy compares with the velocity of the H I. This can be a complicated (and often underestimated) problem and therefore it is worthwhile to emphasize the uncertainties connected with the values of the systemic velocities. It was already pointed out by Mirabel (1989) how the systemic velocities derived from emission lines can be both uncertain and biased by motions of the emitting gas. As discussed in the notes above, two of our galaxies detected in H I illustrate these problems.
In PKS 1549–79 the old redshift available in the literature (Tadhunter et al. 1993) and derived from [O III] emission lines (as for the majority of radio galaxies) suggested the H I being strongly redshifted. However, as discussed above, from a newly obtained optical spectrum we find that the [O II] lines give a radial velocity about 660 km s-1 higher compared to that derived from the [O III] line, and a velocity more consistent with the H I absorption (see Fig. 1). What should we consider as systemic velocity of the galaxy? The [O III] line appears to be very broad, one of the broadest observed in radio galaxies, suggesting that this line comes from a region where the gas is very disturbed. This region could be closer to the nucleus, in agreement with the suggestion made by Hes et al. (1993), while the [O II] lines would originate farther away from the nucleus and from a less disturbed region. Thus, the value derived from the [O II] lines is likely to be closer to the real systemic velocity of this galaxy.
PKS 1549–79 is not the only object in which this effect is observed. Grandi (1977) pointed out that in 4C12.50 (PKS 1345+12) two redshift systems were found: one containing the high-ionization lines and the other (at +240 km s-1 with respect to the first one) containing the low-ionization lines. Moreover, although a large uncertainty is present, the redshift of the H I absorption features appears to be the same as that of the low-ionization emission lines, therefore supporting this as the systemic velocity. We will come back to the similarities between PKS 1549–79 and 4C 12.50 in §6.2.3.
In the case of the other compact object (PKS 1814–637), a more accurate redshift has been derived by better separating the emission from the AGN from the nearby star. The H I absorption appears now to be mainly blue-shifted with only part of the shallow absorption observed at the systemic velocity (unlike what was obtained using the old value for the systemic velocity) as shown in Fig. 4.
In summary, the results we have obtained from our attempt to derive a more detailed value for the redshift suggest that:
1) the redshift derived from the [O III] line can sometimes be unreliable. The [O III] emission line can be more affected by outflow than low ionization lines like [O II] because the former may be coming from an inner region, closer to AGN, in agreement with what was claimed by Hes et al. (1993).
2) some of the redshifts available in the literature are too uncertain for a meaningful comparison with the H I absorption and in particular to derive reliable conclusions on the motion of the neutral gas with respect to the galaxy.
In the case of our detected objects (and with the redshift available so far) we find that in two cases (PKS 1318–43 and PKS 1717–00) the H I absorption is at the systemic velocity and in two objects (PKS 1814–63 and 2314+03) all or most of the H I absorption is blueshifted compared to the systemic.
However, better quality spectra will be necessary to confirm this result in particular for 2314+03. Finally, in the case of PKS 1549–79, the H I absorption has a velocity about 100 km s-1 lower than that derived from the [O II], therefore, considering the errors, is only marginally blueshifted.
6 The origin of the H I absorption
As mentioned in the Introduction, circumnuclear disks or tori are believed to be the most likely causes of H I absorption in radio galaxies. Thick or warped disks surrounding the central regions are required by unified schemes in the case of FR-II radio galaxies to explain the large column densities seen in X-ray observations, the broad lines seen in reflected light and the far-infrared colours. On the other hand, while the unification of BL Lacs and FR-I requires relativistic beaming, the presence of such a thick disk in such objects is still a matter of discussion (Urry & Padovani 1995). In particular, while in BL Lacs broad lines have been detected (Vermeulen et al. 1995, Corbett et al. 1996) the situation is still unclear for FR-Is. Thus, for these radio galaxies the presence of thick disks surrounding the central black hole is not required to explain the existing observations in term of the unified schemes.
Because of this possible difference between the two types of radio galaxies, let us consider them separately.
6.1 Thin nuclear disks in low luminosity radio galaxies?
We have detected H I absorption in only one of the FR-I radio galaxies of the 23 sources observed. The absorption in this case appears to be at the systemic velocity with a width of 150 km s-1and a relatively low column density (2.7 cm-2). The absorption line could be due to a nuclear disk as is suggested for some of the other FR-I galaxies of the 2-Jy available the in literature (e.g. Hydra A, NGC 4261). This is in contrast with the narrow profiles observed in galaxies like Centaurus A which were interpreted in term of single clouds in front of the radio continuum.
At a first glance, the low detection rate of H I absorption in FR-I galaxies is somewhat surprising given that, as shown from recent HST images, gas and dust, in particular circumnuclear dust-lanes, are commonly present in low-luminosity radio galaxies (see e.g. de Koff et al. 1996, Chiaberge et al. 1999, Capetti et al. 2000).

One possibility to explain the low detection rate is that the selection of the objects is biased: because only the objects with a relatively strong core could be observed, we may have biased the sample to objects more beamed toward us. This is very likely to be the case for some objects: for example in the case of 3C 78, the image taken by the Hubble Space Telescope (HST) shows point-like nuclear emission (Chiaberge et al. 1999) and there is evidence for the presence of an un-absorbed, nuclear X-ray source, (Trussoni et al. 1999) both supporting the lack of nuclear obscuration as related to the particular viewing angle. Similar conclusions have been drawn from X-ray observations of PKS 0625–35 (Trussoni et al. 1999).
To check how much such a bias may have affected our sample, we have compared the distribution of for the FR-I radio galaxies of the 2Jy sample observed in H I (either from this work or from the literature) with the values of for the remaining FR-I galaxies (i.e. not yet observed in H I).
The two distributions are presented in Fig. 6. The values of of the two distributions cover a similar range, with only two cases (Fornax A and Hercules A) of very low values of among the objects not observed in H I. Indeed, they were not observed because of the very low values of their core flux. Thus, the galaxies observed in H I do not appear to be strongly biased toward high values. Moreover, we note that Hydra A, one of the FR-I in the sample with a relatively low value of (), shows H I absorption at 50% level (Dwarakanath et al. 1995) and even higher in the VLBI observations while other objects with similar value of are undetected at the 1% level.
Another possibility to explain the lack of H I absorption is therefore to assume that the nuclear disks, if present in these objects, are thin. The presence of a thin disk has been claimed, e.g., in the case of NGC 4261 (Jaffe & McNamara 1994, van Langevelde et al. 2000). For this object, the VLBI data suggest that the H I absorption is due to a disk of 1.3 pc high projected against the counter-jet.
Moreover, despite the presence of the dusty structures, optical studies show that the nuclei of FR-I galaxies appear basically unobscured. Chiaberge et al. (1999) find Central Compact Cores (CCC) in 85 % of the FR-I galaxies selected from the 3CR catalogue and observed with HST. Thus, their fraction of unobscured objects is comparable to the fraction of galaxies undetected in H I absorption. Based on the CCC detection rate, they derive a thickness over size ratio . If we take the values derived for NGC 4261 (a circular velocity of 610 km s-1 for a radius of 5 pc and velocity dispersion km s-1) and using the thin disk relation (i.e. the thickness of the disk is ) we find that this gives a 10% probability of H I absorption from the disk against the nucleus, thus similar to the detection rate in the FRI sample as a whole.
In summary, our results for FR-I galaxies support the idea the most of the H I absorption in these objects comes from a thin nuclear disk as is found for other galaxies of this type (NGC 4261 and Hydra A). However, they do not provide the definitive evidence against a thick torus because, e.g. a thick pc scale torus could be molecular especially given that the quasar component in FRIs, if present, may be weak, so that there may be less photo-dissociated molecular gas. Nevertheless, the low detection rate of H I absorption is consistent with that derived from optical work (Chiaberge et al., 1999), i.e. the “standard” pc scale, geometrically thick torus is not present in low-luminosity radio galaxies.
6.2 Powerful radio galaxies: thick disks & effects of the ISM?
For FR-II radio galaxies, the presence of a thick nuclear disk is a vital ingredient in the unified schemes hypothesis. Broad line radio galaxies are supposed to be seen pole-on and therefore obscuration from the torus should not occur. Narrow-line radio galaxies (NLRG) are viewed more edge-on, and it might be expected that H I absorption would be more common in such objects. We will discuss this in some more detail.
6.2.1 Broad Line radio galaxies
H I absorption seems indeed absent in BLRGs, although the statistics are still limited. For 3C 445 we only have a relatively high upper limit to the optical depth: 4%. However, the remaining three have a tighter upper limit to the optical depth of 1%. An even lower limit of 0.5% has been derived in the compact radio galaxy PKS 2135-20 (Pihlström et al. in prep.): this is in clear contrast with the detections found for the other compact sources in the sample. It appears that our data are consistent with the assumptions that BLRGs are viewed pole-on and the absorption is related to an obscuring torus.
The limiting column density derived for these objects ranges from cm-2 down to cm-2 . Regardless of the value of assumed, the derived column densities for the BLRGs are quite low. These low column densities are consistent with those derived from X-ray observations in the case of the two BLRGs (PKS 2152–69 and Pictor A) for which X-ray observations have shown that no soft X-ray absorption is present (Padovani et al. 1999). On the other hand, in 3C 445 soft X-ray absorption has been detected indicating a column density of cm-2 (Sambruna et al. 1998). The upper limit to the column density derived from the H I is cm-2 and even assuming a spin temperature of K, as discussed in §3, the column density will remain lower than the one derived from the X-ray data. A similar discrepancy has been found between the column densities derived from IR/optical data and X-ray data, with the former much lower than the latter.
In this case, the discrepancy between these values can be explained by assuming that the radio-emitting jets in 3C445 are more spatially extended than the region emitting the X-rays. Therefore they are less likely to be affected by HI absorption associated with dense material close to the central AGN.
6.2.2 Narrow line radio galaxies
Of the four narrow line radio galaxies observed by us, all but one are detected and the undetected (3C 403) has a very high limit to the optical depth due to the weakness of the radio core. The column densities found in our sample go from cm-2 for PKS 1547–79 and 3C 459 up to a few times cm-2 for PKS 1814–63. The latter value is similar to the value found in the prototype FR-II radio galaxy Cygnus A (Conway & Blanco 1995). Two more objects (PKS 0023–26 and PKS 1934-63) have been observed by other groups (see §2) and both detected. The higher detection rate in NLRGs compared to that in BLRGs is what is expected for unified schemes. However, other factors may also play a role.
Due to the selection criteria, the NLRGs observed in our sample are mainly compact or small objects. As pointed out by Heckman et al. (1983), a radio source of sub- or at most galactic size represents an optimum background against which galactic H I might be seen in absorption, in particular if the radio continuum is confined to a scale comparable to the likely dimensions of a possible nuclear disk. Indeed, Conway (1996) found a high detection rate of H I absorption in compact objects. Also from this study we confirm that compact radio sources with narrow emission lines have a high chance of being detected. Of the 6 compact/small radio galaxies in the sample (including the two galaxies observed by Pihlström et al.), the only one undetected is likely to be a broad line radio galaxy (PKS 2135–20, Pihlström et al.).
Let us look in more detail to the three objects detected in this study. 3C 459 shows a broad profile, at the resolution of our observations, but we cannot be completely sure whether the absorption is against the nuclear region or the eastern lobe. Moreover, even assuming that the absorption is against the former, it appears that the arcsec nuclear region is actually formed by two steep spectrum components. Thus, VLBI observations will be required to clarify the real structure of the absorption. The absorption is not at the systemic velocity (although a more accurated redshift will be required to confirm this) but appears to be blueshifted. Thus the torus, if present, is misaligned with respect to the radio axis (and this would explain why velocities different from the systemic are projectd against the core). An alternative explanation is that an outflow of the neutral gas is present.
The situation in PKS 1814–63 is similar. Although the double continuum structure in PKS 1814–63 is larger than that usually observed in Compact Symmetric Object (CSO), the morphology is very similar. H I absorption is very often detected is CSOs (see e.g. Peck & Taylor 2000). The likely size of the atomic torus observed in other objects has a thickness between 50 and 100 pc at a distance of about 50-100 pc from the centre. So if the absorption is due to such a torus, it should appear only against one of the component. Preliminary VLBI results (Morganti et al. 2000b) show that this is not the case and H I absorption is actually detected against both lobes (or part of them). Moreover, only part of the absorption, i.e. part of the shallow component, is at the systemic velocity (assuming the new redshift reported in §3.4). Most of the H I absorption, including the very deep component, appears to be blueshifted. Thus, unless again the geometry of the disk respect to the radio axis is peculiar, or the systemic redshift substantially in error, this part of the absorption will not be easy to reconcile with a torus and could be instead gas associated with an expanding gas cocoon around the radio source.
PKS 1549–79 seems to be a different kind of object. This galaxy has a core-jet radio structure and no counter-jet is observed at the resolution of the VLBI ( mas, pc, King et al.). The detected H I absorption has a lower column density and a narrower profile compared to the other two galaxies. With its core/jet VLBI morphology, it is difficult to reconcile the absorption as due to a torus: in that case the absorption would be expected against the counter-jet. The characteristics of the H I absorption in this object are more easy to reconcile with a cloud of neutral hydrogen in front of the nucleus.
In summary, on one hand the fact that the H I absorption is detected in NLRGs and not in the BLRGs seems to suggest that a thick disk is indeed the cause of absorption. However, the above analysis shows that such a model does not explain all the features of the H I absorption in all NLRGs. The blueshifted absorption does indicate outflow and the possible correlation of the detection of H I absorption with the presence of a particularly rich ISM (see below) suggests that in some cases the absorption is related to an interaction between the radio plasma and the ISM. It is conceivable that this is connected to the fact that all the detected sources are compact or small. H I absorption related to gas outflow has been clearly seen already in other objects such as the Seyfert galaxy IC 5063 (Oosterloo et al. 2000), possibly the superluminal source 3C 216 (Pihlström et al. 1999) and 3C 326 (Conway et al. in prep). Thus, it is not unlikely that a similar situations can be present in some of our detected objects.
6.2.3 Starburst and far-IR bright galaxies
As mentioned in §4, only two galaxies (3C 459 and PKS 1549–79) out of the 20 powerful and intermediate redshift () radio galaxies of the 2-Jy sample are dominated by a starburst at optical/UV wavelengths (Tadhunter 1999) and these two objects are the only two in the sample detected by IRAS at 60m. It is therefore very interesting to see that in both these objects H I absorption has been detected.
Although a contribution to the far-IR emission from quasar heating cannot be completely excluded, it is generally assumed that the far-IR excess represents reprocessed starlight. This points to a strong link between the star formation activity and the far-IR, and to an overall richer interstellar medium present in these galaxies.
In order to test if the rich ISM could have some correlation with detection of H I absorption, we have searched the literature to investigate if this trend would hold for a larger number of objects. As far as we could find, three other starburst/far-IR bright galaxies were observed in H I and all are detected in absorption. Apart from the already mentioned 4C 12.50 (Mirabel 1989), detections of H I absorption have been reported for 3C 433 (Mirabel 1989) and 3C 321 (Mirabel 1990). These all happen to be among the most powerful far-IR sources (for their range of radio power) and they all show strong signs of starburst activity in the optical. For example, 3C 433 is the object which shows the clearest evidence for optical/UV starburst activity and is also the most powerful object at far-IR wavelengths in a survey of a complete sample of 9 low redshift () 3CR radio galaxies (Wills et al. in prep.). Thus, although we do not have unbiased statistics, there seems to be an effect related to the presence of a rich ISM that makes the detection of H I in absorption more likely.
As already pointed out by Mirabel (1982), there could be a link between radio-IR spirals (like the starburst Arp 220) and radio galaxies in the early stage of their evolution, like 4C 12.50. In the formation of radio galaxies and QSRs, the ultraluminous infrared galaxies (ULIRG) like Arp 220 are believed to play an important role (see Sanders and Mirabel 1996 for a review). They may represent the early stage in a sequence of merging spiral galaxies evolving through a starburst phase to eventually becoming QSOs and powerful radio galaxies. Thus, the starburst, far-IR galaxies that we are considering could represent the result of such a process. They should be either young radio galaxies, as suggested by the fact that many of them are compact and have a steep radio spectrum, or galaxies with re-started activity (like 3C 321 which has a steep spectrum core or obvious mergers as 3C 433). A number of ULIRGs have been detected in H I absorption. Their typical H I column density is cm-2 for = 100 K. Their broad H I profiles indicate rotation plus large amounts of unusually turbulent neutral hydrogen (Mirabel 1982, Sanders & Mirabel 1996).
7 Conclusions
We have presented H I observations for 23 radio galaxies selected from the 2-Jy sample. H I absorption has been detected in 5 objects. We have investigated how the detection rate is distributed among galaxies with different optical and radio properties.
For FR-I galaxies our data support the idea that most of the H I absorption in these objects comes from a thin nuclear disk, similar to those found in other galaxies of this type (NGC 4261 and Hydra A). Thus, this is consistent with the HST imaging observations (Chiaberge et al. 1999) which do not require the presence of pc scale, geometrically thick torus in low-luminosity radio galaxies.
The non-detection of H I absorption in BLRGs is, to first order, consistent with the unified schemes. Broad line radio galaxies are in fact supposed to be galaxies seen pole-on and therefore obscuration from the torus should not occur.
The fact that the H I absorption is detected in NLRGs and not in the BLRGs seems to suggest that a thick disk is indeed a cause of absorption. However, it does not seem to explain all the observed characteristics of the absorption. For example, the detection of H I absorption in far-IR bright, starburst galaxies seems to indicate that there is also an effect related to the presence of a rich ISM that makes detection of H I in absorption more likely. We cannot say if the H I is in a disk, but certainly in some objects the situation seems to be more complicated than that. In particular, PKS 1814–63 and 3C 459 seem to have blueshifted absorption, possibly related to some outflow. PKS 1549–79 is likely to be a very young radio source and the material around the nucleus has not yet been swept out by the expanding radio source and/or quasar-induced winds.
It is clear that both high resolution VLBI data as well as accurate redshifts are required for a more complete picture of what is producing the H I absorption.
8 Acknowledgements
We wish to acknowledge Rene Vermeulen and Ylva Pihlström for comunicating their results before publication.
References
- [1] Capetti A., de Ruiter H.R., Fanti R., Morganti R., Parma P., Ulrich M.-H. 2000, A&A in press
- [2] Bahcall J. N. & Ekers R. D. 1969, ApJ 157, 1055
- [3] Chiaberge M., Capetti A., Celotti A., 1999, A&A 349, 77
- [4] Conway J. E. & Blanco P. R. 1995, ApJ 449, L131
- [5] Conway J.E. 1996, in The second Workshop on Gigahertz Peaked Spectrum and Compact Steep Spectrum Radio Sources, Eds. Snellen, Schilizzi et al. M.N. Publ JIVE, Leiden p.198
- [6] Conway J.E. 1998 in Highly redshifted radio lines, Carilli C.L., Radford S.J.E., Menten K.M., Langston G.I. eds., ASP Conf. Series 156, 259
- [7] Corbett E. A., Robinson A., Axon D. J., Hough J. H., Jeffries R. D., Thurston M. R., Young S. 1995, MNRAS 281, 737
- [8] de Koff et al. 1996, ApJS 107, 621
- [9] Dickson R. 1997, Ph.D. Thesis Sheffield University
- [10] Dwarakanath K. S., Owen F. N. & van Gorkom J. H. 1995, ApJ 442, L1
- [11] Gallimore J., Baum S., O’Dea C., Pedlar A., Brinks E. 1999, ApJ 524, 684
- [12] Grandi S.A. 1977, 215, 446
- [13] Heckman T.M., Balick B., van Breugel W.J.M., Miley G.K. 1983, AJ 88, 583
- [14] Heiles C. & Kulkarni S. 1988 in “Galactic and Extragalactic Radio Astronomy”, ed. K. Kellerman & G. Verschuur (Belin: Kluwer), p. 95
- [15] Hes R., Barthel P. D., Fosbury, R. A. E., 1993, Nature 362, 326
- [16] Jaffe W. 1991, A&A 250, 67
- [17] Jaffe W. & McNamara B. 1994, ApJ, 434, 110
- [18] Llyod B.D., Jones P.A., Haynes R.F. 1996, MNRAS 279, 1197
- [19] King E., 1994, PhD Thesis, University of Tasmania
- [20] King E. et al. 1996 in “Extragalactic Radio Sources, IAU 175, Ekers, Padrielli, Fanti eds. p.75
- [21] Maloney P.R., Hollenbach D.J., Tielens A.G.G.M. 1996, ApJ 466, 561
- [22] Miller J.S. 1981, Publ. A. S. P., 93, 681
- [23] Mirabel I.F. 1982, ApJ 260, 75
- [24] Mirabel I.F. 1989, ApJ 340, L13
- [25] Mirabel I.F. 1990, ApJ 352, L37
- [26] Morganti R., Killeen N. & Tadhunter C.N., 1993, MNRAS, 263, 1023
- [27] Morganti R., Oosterloo T.A., Reynolds J., Tadhunter C.N. & Migenes V., 1997, MNRAS 284, 541
- [28] Morganti R., Oosterloo T.A. & Tzvetanov Z., 1998, AJ 115, 915
- [29] Morganti R., Oosterloo T.A., Tadhunter C.N., Aiudi R., Jones P., Villar-Martin 1999, A&A Suppl. 140, 355
- [30] Morganti R., Oosterloo T., Tadhunter C.N., Wills K.A. 2000a, in ”Gas and galaxy evolution”, eds. J. Hibbard, M. Rupen & J. van Gorkom, ASP Conference Series in press (astro-ph/0009091)
- [31] Morganti R., Oosterloo T., Tadhunter C.N., Wills K.A., Tzioumis A., Reynolds J. 2000b, in “Proceedings of the 5th EVN Symposium”, Eds. J. Conway, A. Polatidis & R. Booth, Onsala Space Observatory, Chalmers Technical University, Gothenburg (Sweden), in press (astro-ph/0010482)
- [32] Oosterloo T.A., Morganti R., Tzioumis A., Reynolds J., King E., McCulloch P., Tsvetanov Z. 2000, AJ 119, 2085
- [33] Padovani P., Morganti R., Siebert J., Cimatti A., Vagnetti F. 1999, MNRAS 304, 829
- [34] Peck A.B., Taylor G.B. 2000, in “ Lifecycles of Radio Galaxies”, eds. J. Biretta et al., New Astronomy Reviews in press
- [35] Pihlström Y.M., Vermeulen R.C., Taylor G.B., Conway J.E. 1999, ApJ 525, L13
- [36] Reynolds J.E. 1996 in “Australia Telescope Compact Array, Users’s Guide” eds. W.M. Walsh & D.J.McKay
- [37] Sambruna R.M., George I.M., Mushotzky R.F., Nandra K., Turner T.J. 1998, ApJ 495, 749
- [38] Sanders D.B. & Mirabel I.F. 1996, ARA&A 34, 749
- [39] Sault, R.J., Teuben, P.J., Wright, M.C.H. 1995 in “Astronomical Data Analysis Software and Systems IV”, eds. R. Shaw, H.E. Payne and J.J.E. Hayes, Astronomical Society of the Pacific Conference Series, 77, 433
- [40] Shaw M., Tadhunter C., Dickson R., Morganti R. 1995, MNRAS 275, 703
- [41] Simpson C., Ward M., Clements D.L. & Rawlings S., 1996, MNRAS 281, 509
- [42] Smith R.M., Bicknell G.V. 1986, ApJ 308, 36
- [43] Swain M., Bridle A. and Baum S., 1998, Astrophysical Journal, 507, L29-L33
- [44] Spinrad H., Djorgovski S., Marr J., Aguilar L. 1985, Publ.A.S.P., vol. 97 p. 932-961
- [45] Tadhunter C.N., Morganti R., di Serego Alighieri S., Fosbury R. & Danziger J., 1993, MNRAS 263, 999
- [46] Tadhunter C.N., Morganti R., Robinson A., Dickson R., Villar-Martin M. & Fosbury R.A.E., 1998, MNRAS 298, 1035
- [47] Tadhunter C.N. 1999 In: Proceedings of the KNAW Colloquium on The Most Distant Galaxies, Röttgering et al. (eds.), Amsterdam, p.185
- [48] Tadhunter C.N., Wills K., Morganti R., Oosterloo T. Dickson R. 2000, MNRAS submitted
- [49] Taylor G.B. 1996, ApJ 470, 394
- [50] Trussoni E., Vagnetti F., Massaglia S., Feretti L., Parma P., Morganti R., Fanti R., Padovani P. 1999, A&A 348,437
- [51] Tzioumis A., Morganti R., Tadhunter C. et al. 1996, in ‘Extragalactic Radio Sources’, Ekers R.D., Fanti C. and Padrielli L. eds., p.73
- [52] Ulvestad J.S., 1985, ApJ 288, 514
- [53] Urry C.M. & Padovani P. 1995, PASP 107, 803
- [54] De Vaucouleurs G., De Vaucouleurs A., Corwin Jr. H.G., Buta R. J., Paturel G. and Fouque P. 1991, Third Reference Catalogue of Bright Galaxies, Version 3.9
- [55] van Gorkom J.H., Knapp G.R., Raimond E., Faber S.M., Gallager J.S. 1986, AJ 91, 791
- [56] van Gorkom J.H., Knapp G.R., Ekers R.D., Ekers D.D., Laing R.A. & Polk K., 1989, AJ 97, 708
- [57] van Breugel W., Miley G., Heckman T. 1984, AJ, 89, 5
- [58] van der Hulst J.M., Golish W.F. & Haschick A.D. 1983, AJ 264, L37
- [59] van Langevelde H.J., Pihlström Y.M., Conway J.E., Jaffe W., Schilizzi R.T. 2000, A&A 354, 45
- [60] Vermeulen R. C., Ogle P. M., Tran H. D., Browne I. W. A., Cohen M. H., Readhead A. C. S., Taylor G. B., Goodrich R. W. 1995, ApJ 452, L5
- [61] Véron-Cetty M.-P., Woltjer L., Staveley-Smith L., Ekers R.D. 2000, A& A submitted
- [62] Wall, J.V. & Peacock, J.A. 1985, MNRAS 216, 173.