Simultaneous BeppoSAX and RXTE observations of the X-ray burst sources GX 3+1 and Ser X-1
Abstract
We have obtained spectral and timing data on GX 3+1 and Ser X-1. Both sources were observed simultaneously with BeppoSAX and RXTE. The RXTE data is used to provide power spectra and colour-colour diagrams in order to constrain the state (and thus track ) the sources are in. The BeppoSAX data provide the broad-band spectra. The spectra of both sources are reasonably well-fit using a model consisting of a disk-blackbody, a comptonized component and a Fe line, absorbed by interstellar absorption. The electron temperature (kTe) of the Comptonizing plasma is in both cases 2.5 keV. This implies that no strong high-energy tail from the Comptonized component is present in either of the sources. We discuss the similarities between these burst sources and the luminous X-ray sources located in globular clusters. We find that the spectral parameters of the comptonized component provide information about the mass-accretion rate, which agrees well with estimates from the timing and spectral variations.
Key Words.:
Accretion, accretion disks – Stars: GX 3+1, Ser X-1 – Stars: neutron – – X-rays: bursts – X-rays: general1 Introduction
The sources GX 3+1 and Ser X-1 are both bright X-ray burst sources. Ser X-1 was discovered in 1965 (Friedmann et al. 1967), and X-ray bursts from this source were first detected by Swank et al. (1976). GX 3+1 was discovered by Bradt et al. (1968), and the first X-ray bursts were detected by Makishima et al. (m:83 (1983)).
These sources, containing neutron stars, are studied with BeppoSAX in order to quantify their spectrum in the 0.1–30 keV energy range. It is now well established that hard X-ray emission (above 30 keV) is not an unique feature of black hole systems as indicated by detections of several X-ray binaries at high (100 keV) energies (e.g., Barret & Vedrenne 1994). Following the detections of neutron star systems at high energies van Paradijs & van der Klis (vpvdk:94 (1994)) concluded from data collected from the HEAO 1 A-4 catalogue that the 10–80 keV spectra of accreting neutron stars with low magnetic fields get progressively harder when the source gets dimmer. Historically observations with Ginga and nearly simultaneous with BATSE of 4U 1608-522 (Yoshida et al. y:93 (1993), Zhang et al. z:96 (1996)) have shown hard spectra from a neutron star when it is in a low state. A recent example of a neutron star showing a high energy-tail in its spectrum is 4U 0614+091 (Piraino et al. psfk:99 (1999))
However, quantative differences might exist between the two types of compact objects. For example Churazov et al. (c:95 (1995)) suggest that the power-law components of black-hole candidates are systematically harder than those of low-luminosity neutron star accretors.
The two sources are observed in a program aimed at determining and quantifying the spectral properties in the 0.1–30 keV band. Results on data obtained with RXTE on four different X-ray bursters have been reported by Barret et al. (2000). They find that the spectra of sources in a low state (0.05–0.1 LEdd) can be described by thermal Comptonization with an electron temperature of 25–30 keV and (in general) an underlying soft component. When the sources are in a higher state (0.35 LEdd) there is no significant hard tail, while the Comptonized component can be described by a much lower electron temperature, kTe (3 keV).
We use (quasi-)simultaneous RXTE data to constrain the state of the sources. According to Hasinger & van der Klis (hk:89 (1989)) “Atoll” sources trace out a distinct pattern in a colour-colour diagram, while their power spectra show distinct changes when moving through these states. This will allow us to obtain an estimate of the immediate mass-accretion rate of these sources. Using the simultaneous data obtained by two different satellites allow us to use the complementary properties of both satellites.
2 Observations
Results from the Low-Energy Concentrator Spectrometer (LECS; 0.1–10 keV; Parmar et al. 1997), the Medium-Energy Concentrator Spectrometer (MECS; 1.8–10 keV; Boella et al. 1997), the High Pressure Gas Scintillation Proportional Counter (HPGSPC; 5–120 keV; Manzo et al. 1997) and the Phoswich Detection System (PDS; 15–300 keV; Frontera et al. 1997) on-board BeppoSAX are presented. All these instruments are coaligned and collectively referred to as the Narrow Field Instruments, or NFI. The MECS consists of two grazing incidence telescopes with imaging gas scintillation proportional counters in their focal planes. The LECS uses an identical concentrator system as the MECS, but utilized an ultra-thin entrance window and a driftless configuration to extend the low-energy response to 0.1 keV.
The non-imaging HPGSPC consists of a single unit with a collimator that remained on-source during the entire observation. The non-imaging PDS consists of four independent units arranged in pairs each having a seperate collimator. Each collimator was alternatively rocked on- and 210′ off-source every 96 s during the observation.
The region of sky containing Ser X-1 was observed by BeppoSAX on 1999 September 05 2:46 UTC to September 05 20:15 UTC, while GX 3+1 was observed on 1999 August 30 18:33 UTC to August 31 11:41 UTC. Good data were selected from intervals when the instrument configuration was nominal, using the SAXDAS 2.0.0 data analysis package. LECS and MECS data were extracted centered on the position of the sources using radii of 8′ and 4′, respectively. The exposures in the LECS, MECS, HPGSPC, and PDS instruments are 8.9 ks, 30.8 ks, 30.3 ks, and 14.0 ks for GX 3+1, while Ser X-1 was observed for 15.7 ks, 31.7 ks, 31.3 ks, and 15.4 ks, respectively.
Background subtraction for the imaging instruments was performed using standard files, but is not critical for such bright sources. Background subtraction for the HPGSPC was carried out using data obtained when the instrument was looking at the dark Earth and for the PDS using data obtained during intervals when the collimators were offset from the source (see also Sect. 3 for some details regarding GX 3+1).
RXTE observation of Ser X-1 were obtained between 1999 September 05 3:33 UTC and September 05 14:06 UTC, while the observations of GX 3+1 were obtained on 1999 August 30 18:41 UTC to August 31 07:15 UTC. Only data obtained with the Proportional Counter Array (PCA, Bradt et al. b:93 (1993)) were analysed. Most of the data were obtained with 4 or 3 proportional counter units on, with time resolutions ranging from 16 s (129 photon energy channels, effectively covering 2–60 keV) down to 16s using various timing modes covering the 2–60 keV range.
3 Results
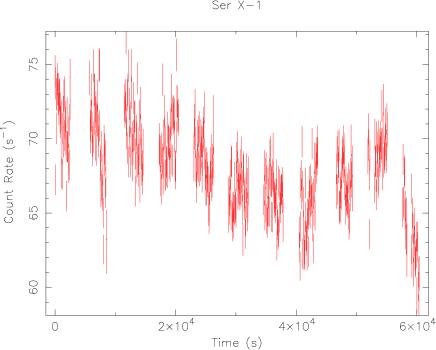
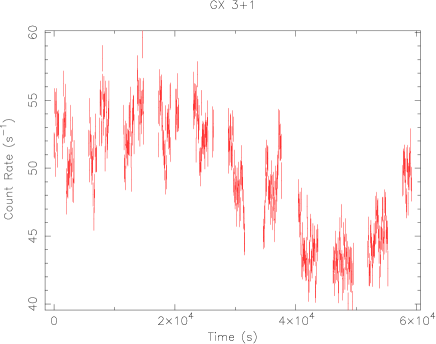
The lightcurves of both sources were plotted and inspected: no bursts are detected. The MECS count rate of Ser X-1 is 68 counts s-1, while the count rate of GX 3+1 varied between 42 and 56 counts s-1 (see Fig. 1).
Using the default pipeline products the PDS spectrum of GX 3+1 shows serious discrepancies (it was a factor 2–3 lower) with the HPGSPC spectrum in the overlapping energy range. We found that the offset spectra (which are used for the background spectrum) are obtained while the PDS-detectors were observing a region of the sky containing the two bright X-ray sources SLX 1744-300 and SLX 1744-299 in the negative offset direction. We repeated the analysis using only the positive offset direction and obtaining a spectrum which agrees much better with the HPGSPC spectrum in the overlapping energy range. However, the agreement is still not perfect; this is explained by the fact that there are quite a few fainter sources in, or close to, the field of view of the PDS in the positive offset-position. This is unsurprising since GX 3+1 is very close to the galactic center. Additionally, it might be expected that the gradient in the galactic ridge emission might be important in the background subtraction. This means that the high-energy background subtraction of GX 3+1 is rather uncertain. For this reason we have excluded the PDS spectrum of GX 3+1 for most of the analysis mentioned below. We note that, since the spectrum is soft, not much information is lost by excluding the PDS spectrum from the analysis. There are no such problems for the Ser X-1 PDS spectrum (which is unsurprising since Ser X-1 is located at a higher galactic latitude, no known bright sources are present in the offset positions of the PDS).
Additionally the galactic ridge emission might contribute to the HPGSPC spectrum, since dark-earth data is used for the subtraction. We have taken the spectral shape and normalization for the galactic ridge emission from Valinia & Marshall (vm:98 (1998)) and find that for GX3+1 the contribution from the galactic ridge emission is 1% at 10 keV and 3% at 20 keV (the upper boundary of the HPGSPC energy range used), while the statistical uncertainty is 6% at 20 keV. We conclude that, because of the brightness of the source, this galactic ridge emission is not a problem in the background subtraction. For Ser X-1 the situation is even better, since the source is somewhat brighter, and more importantly, located at a higher galactic lattitude.
We have checked for the presence of source in the FOV of the HPGSPC and PDS and found that no sources brighter than 0.4% of the intensity of the sources of interest are present. Also no sources affecting the analysis are present in the data of the imaging (LECS/MECS) instruments.
3.1 RXTE results
3.1.1 GX 3+1
RXTE data on GX 3+1 have been obtained starting at roughly the same time and ending about 4 hours earlier than the BeppoSAX data (see Sect. 2).
We have obtained the power spectrum by making FFTs using the event data (E_16us_64M_0_1s) over the entire energy range with an original time resolution of 16s. We used 131072 points per FFT, resampling the event data at a time resolution of 1/4096 s (corresponding to a of 2048 Hz), which results in one power spectrum every 32 s. We checked the power spectra for strong variations as a function of time. We found none and analyzed the average power spectrum. We find that this spectrum can be adequately described with the “Atoll” model, which consist of very low-frequency noise (VLFN; described by a power-law) and high-frequency noise (HFN, described by a cutoff-powerlaw, see e.g. van der Klis vdk:95 (1995)). The obtained fit to the average power spectrum results in a rms VLFN-strength of 7.5% (0.01–1 Hz) described by a power-law index, , of 1.6, HFN rms (1–100 Hz) 3.5% ( -1.20, Hz), see Fig. 2. Those values (especially the presence of the VLFN) are typical of Atoll sources in the lower banana state (e.g. Hasinger & van der Klis hk:89 (1989)). We have not detected kilohertz QPO with an upper limit (at 95%) to the variability of 2.6% rms.
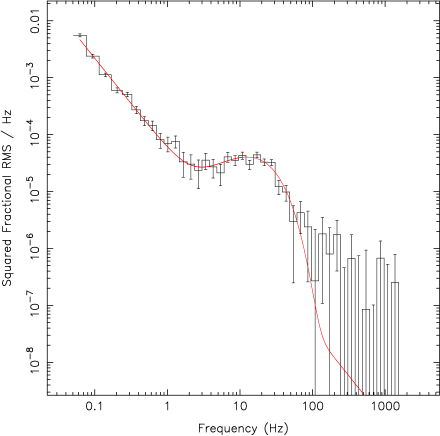
Using the Standard 2f data we made a colour-colour diagram using time bins of 16 s. This colour-colour diagram resembles the banana state (high inferred mass accretion rate) of an “Atoll” source (which is consistent with the power spectrum), since significant variations occur in the soft colour (positively correlated with hard colour variations). We therefore conclude that GX 3+1 was in a lower banana state during the time of the RXTE and BeppoSAX observations.
We have extracted RXTE spectra and fitted these with the same diskBB + compTT model as used for the BeppoSAX data. Only Layer 1 data were analyzed (since the source is relatively soft) for PCU 0,1, and 2. The response matrix was generated for this choice of detectors and layers using ftools 5.0. All obtained fit parameters are consistent with the BeppoSAX-derived parameters within their uncertainties.
3.1.2 Ser X-1
RXTE data on Ser X-1 have been obtained starting 1 hour after the start of the BeppoSAX observations and ending 6 hours before the end of the BeppoSAX observations (see Sect. 2).
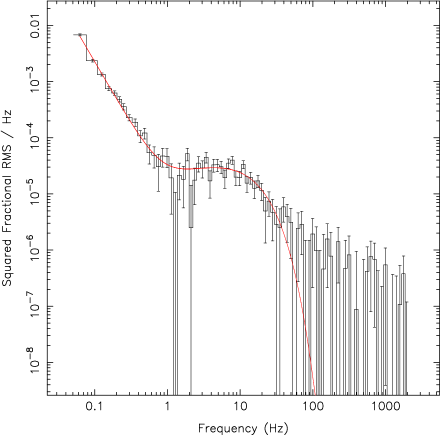
For Ser X-1 we used a similar procedure with event data obtained in mode E_125us_64M_0_1s, but using the same resampling and length of the FFTs. We find that the power spectrum (Fig. 3) can be well fitted using the same “Atoll”-model, while the obtained parameters are: VLFN rms of 23% (0.01–1 Hz), 2.2, HFN rms (1–100 Hz) 2.3% ( -0.5, Hz). The colour-colour diagram indicates that the source was in the banana state (high inferred mass accretion rate), probably closer to the upper banana state, since the HFN-strength is relatively low (see e.g. van der Klis vdk:95 (1995)). No kilohertz QPO were detected with an upper limit to the rms variability of 2.0%

We have also determined the energy dependence of the HFN strength as a function of energy for Ser X-1. We find that the HFN rms increases from 2% at 3 keV to 9% at 15 keV (see Fig. 4). We note that the increase in HFN noise strength is roughly consistent with the larger contribution of the Comptonized component to the total spectrum (i.e. the HFN noise gets diluted at lower energies by the presence of the soft component). Due to the lower count rate (and thus the poorer statistics) a similar plot for GX 3+1 looks noisier; however, it is consistent with the plot obtained for Ser X-1.
We have extracted RXTE spectra and fitted these with the same diskBB + compTT model as used for the BeppoSAX data. Only Layer 1 data were analyzed (since the source is relatively soft). The choice of PCUs and the method of generation of the response matrix was the same as for GX 3+1. The best-fit RXTE values are consistent with the values (and uncertainties) determined from the BeppoSAX data. The only parameter in which an appreciable difference was found was the seed temperature of the electrons (). The best-fit nominal value from the RXTE data was 0.32 keV, but this parameter is poorly constrained (due to the lack of low-energy response of the PCA) and is therefore consistent with the value obtained from the BeppoSAX spectra.
3.2 BeppoSAX spectral analysis
The overall spectra of GX 3+1 and Ser X-1 were first investigated by simultaneously fitting data from all the BeppoSAX NFI. The LECS and MECS spectra were rebinned to oversample the full width half maximum of the energy resolution by a factor 3 and to have additionally a minimum of 20 counts per bin to allow use of the statistic. LECS response matrices appropriate for the position and count rates of the sources were generated and used. The HPGSPC and PDS (for Ser X-1 only) spectra were rebinned using the standard techniques in SAXDAS. Data were selected in the energy ranges 0.5–10.0 keV (LECS), 1.8–10 keV (MECS), 8.0–20 keV (HPGSPC), and 15–100 keV (PDS) where the instrument responses are well determined and sufficient counts obtained. Due to the high NH we have not used data below 0.5 keV, since this does not add a significant number of source counts. The photoelectric absorption cross sections of Morisson & McCammon (mm:83 (1983)) and the solar abundances of Anders & Grevesse (a:89 (1989)) are used throughout.
| Model | Ser X-1 | GX 3+1 |
|---|---|---|
| pow + diskBB + Gauss | 11.9 | 1.85 |
| pow*highe + diskBB + Gauss | 2.35 | 1.50 |
| cutoff + diskBB + Gauss | 1.57 | 1.04 |
| compTT + diskBB + Gauss | 1.54 | 0.99 |
| compTT + diskBB | 3.52 | 1.88 |
| compTT + BB + Gauss | 1.51 | 0.99 |
| compST + diskBB + Gauss | 1.73 | 1.23 |
| compST + BB + Gauss | 1.55 | 1.12 |
| pexrav + diskBB + Gauss | 1.49 | 1.47 |
Initially, simple models were tried, including absorbed power-law, and cutoff power-law models, but these models gave a poor description to the obtained data. Factors were included in the spectral fitting to allow for normalization uncertainties between the instruments. These factors were constrained to be within their usual ranges during the fitting.

| Parameter | Ser X-1 | GX 3+1 |
|---|---|---|
| 102 atom cm-2 | 0.50 | 1.59 |
| (keV) | 0.15 | 0.49 |
| (keV) | 2.52 0.07 | 2.71 |
| 9.7 | 6.1 | |
| (keV) | 1.46 0.05 | 1.95 |
| (km) | 6.8 | 2.8 |
| Fe E (keV) | 6.46 | 6.1 |
| Fe (keV) | 0.98 | 1.00 |
| Fe EW (eV) | 275 | 200 |
| /dof | 152.8/99 | 88.1/89 |
| Flux (2–10 keV) | 5.4 | 4.7 |
| Flux (10–50 keV) | 1.2 | 0.9 |
| Flux (1–20 keV) | 7.9 | 5.0 |
| Flux (20–200 keV) | 0.08 | 0.06 |
| FDBB/Ftotal (0.1–10 keV) | 0.54 | 0.40 |
| Assumed distance to GX 3+1 is 4.5 kpc (Kuulkers & van | ||
| der Klis 2000). | ||
| for Ser X-1 is expressed in D10kpc | ||
| Flux is in units of 10-9 erg s-1 cm-2 and unabsorbed | ||
| All uncertainties have been obtained by | ||
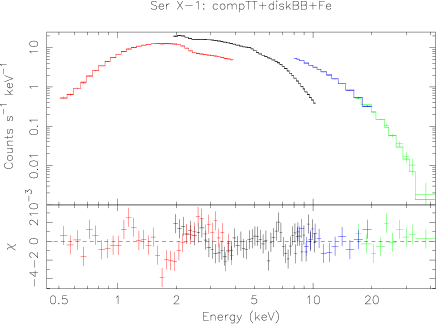
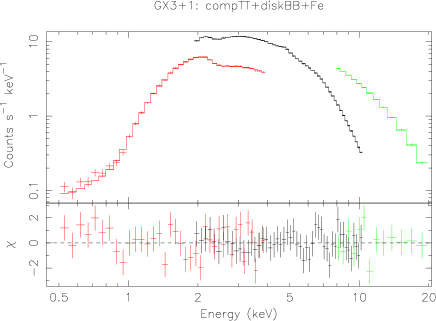
A model consisting of a thermal component (dominating the bulk of the emission below 1 keV) and a thermal Comptonization “tail” provides an acceptable description of the broadband spectrum in both sources (as typically observed in bursters; Guainazzi et al. 1998; in’t Zand et al. 1999; Barret et al. 2000). Positive residuals around 6.5 keV are suggestive of the presence of fluorescent iron emission line, which is detected for the first time in these sources. The thermal component can be described either by a single temperature blackbody or by a multi-temperature disk blackbody.
The difference in between disk-blackbody and blackbody models is rather small. The models do not provide a statistically acceptable . However, after adding a 2% systematical uncertainty to the LECS and MECS data, the is much closer to one. Therefore the question whether the best-fitting models give a good statistical description to the data is hard to answer, but we can say that the 2% systematical uncertainties are roughly in-line with the calibration uncertainties for bright sources of the BeppoSAX instruments. Additionally, some spectrals changes might be expected as a function of intensity, which might contribute to the high (however, the intensity selected spectra of GX 3+1 do not show strong evidence for this effect). All quoted values and uncertainties in the text and Tables refer to values obtained with the 2% systematic uncertainty included. Most of the contribution to the high is coming from the 4-7 keV region in the MECS, and looks highly structured. We note that this region includes the instrumental Xenon L-edge and the Fe line, which might be poorly modeled. We believe that the structured shape of the residuals argues against the possibility that the continuum has been modeled incorrectly (e.g., due to the presence of a reflected component), since this would tend to give more smoothly varying residuals.
In order to compare the spectra of the sources we have used for the detailed fitting the models which gives, on average, the best fit to both spectra. This model is the compTT + diskBB + Gaussian model. The choice between blackbody and diskBB is arbitrary. Additionally the obtained values for the inner disk radius () are rather small. However, following Merloni et al. (m:00 (2000)), we believe that the obtained value is not a reliable estimate (but an underestimate) of the true inner radius of the disk. Similar results were obtained by Barret et al. (b:00 (2000)) for KS 1731–260.
Note that the best-fit model to the Ser X-1 spectrum contains a pexrav model component (see Table 1 and Sect. 4). However, the difference in with respect to the model consisting of a disk blackbody and compTT component is not statistically significant. The obtained value for the “relative reflection” is 1.280.03 (with inclination fixed to the default value of 0.45), which implies a rather high contribution of the reflected component.
Since the variations in intensity and colours are more pronounced for GX 3+1 than for Ser X-1, we have attempted to study the spectra obtained at high and low intensities. We have obtained a spectrum at “low” count rates (49 cts s-1 in the MECS) and “high” count rates (49 cts s-1), using time bins of 256 s. There seems to be a small, but significant, difference between these spectra of GX 3+1 obtained at low and high count rates (within the BeppoSAX observation), which is also reflected in the colours. However, the spectral fitting results in parameters which are, within their uncertainties, the same between the two spectra. The spectral differences between the two spectra are very small, and at the limit which can be resolved by BeppoSAX. Additonally no large change in the observed was obtained. This justifies using the average spectrum for the purpose of determining the broad-band shape of the continuum. Therefore we have not attempted a similar approach to Ser X-1 (where the differences in colours and count rates are even less than in GX 3+1).
The observed Equivalent Widths (EW) of the Fe line is 200 eV for GX 3+1. Especially in the case of GX 3+1 the energy and the width of the iron line is not well constrained. We note that that a broad Fe line gives a significantly better fit to the spectra for both Ser X-1 and GX 3+1: for Ser X-1 the /degrees of freedom (dof) decreases from 238.7/100 (for a zero-width line) to 152.9/99 (for a broad line), while for GX 3+1 the change is from are 114.2/90 to 88.1/89. The decreases in are highly significant. It is rather likely that the shape of the Fe line is more complex than a simple Gaussian (i.e. blend of different energies, presence of an edge, or broadening by Comptonization). The fits tend to favour a broad line (see Table 2), which might be caused by Comptonization. However, this possible complexity is not well constrained by our data.
4 Discussion
We have observed GX 3+1 and Ser X-1 in the 0.1–30 keV energy range using BeppoSAX. We find that the spectra are best described by a combination of a compTT model and blackbody-like model (either a blackbody or a multi-colour blackbody model diskBB). From the RXTE timing and colour-colour diagram we infer that GX 3+1 is in the lower banana state, implying a of around 0.15 LEdd, while Ser X-1 is in the upper banana state, implying a slightly higher mass accretion rate. The absence of kilohertz QPO is consistent with the fact that kilohertz QPO are not normally seen in the banana-type state in other sources (for a list of similar upper limits see van Straaten et al. 2000).
Comparison of the spectra of the two sources discussed here with the spectra of various low-mass X-ray binaries (see Barret et al. b:00 (2000)), reveals a striking resemblance in terms of fit-parameters with KS1731-260. This is not suprising, since this source was also in the banana state during the RXTE observations. The obtained fit-parameters are very similar. Comparing our two sources with another well-studied atoll-source like 4U 1820–30 we see that the spectral parameters are compatible when 4U 1820–30 is rather bright (e.g. the observation reported in Piraino et al. p:98 (1998)). Interestingly 4U 1820–30 is not detected at high (100 keV) X-ray energies (see e.g. Bloser et al. bloser:00 (2000)), even at its lowest accretion rates.
The observations presented here provide additional evidence for a strong relation between the luminosity and the presence of a hard tail which can be modeled by thermal Comptonization with an electron temperature ranging from 30 keV at the lowest accretion rates to 2.5 keV at higher accretion rates (0.15 LEdd). Thus the broad-band spectral properties of X-ray burst sources seem to be governed, to first order, by the mass accretion rate and appear to be very similar between sources.
The observed optical depth (), electron temperature and the diskblackbody spectral parameters are rather similar to X1820-303, the brightest source in the sample of globular cluster sources as discussed in Guainazzi et al. (2000). This is consistent with the observed relation between luminosity and e.g. (Guainazzi et al. 2000) and the fact that these sources are expected to accrete at a 10–30% of the Eddington limit. Using the correlation between the observed and accretion rate expressed in Eddington luminosity (Fig. 4 in Guainazzi et al. 2000) we can estimate the Eddington luminosity of Ser X-1 and hence its distance. The observed would put it a luminosity of 0.15 LEdd, which would place Ser X-1 at a distance of 6 kpc. A similar exercise, using the observed , would place GX 3+1 at a distance of 5 kpc, in remarkable agreement with the distance of 4.5 kpc determined by Kuulkers & van der Klis (2000) using a unique radius-expansion burst from this source. However, this remarkable agreement may be fortuitous, since a more complete sample of globular cluster sources (Sidoli et al. s:00 (2000)) shows a less clear correlation between luminosity and than in Guainazzi et al. (2000).
Alternatively the observed from the spectrum of GX 3+1 can be used to estimate the luminosity in terms of LEdd, using the correlation in Guainazzi et al. (2000). We found a luminosity of 0.1 LEdd. This value, when the source is in the lower banana state is in line with current thoughts about the mass-accretion rate in this state (van der Klis vdk:95 (1995)). For Ser X-1 we infer a slightly higher , since it probably is higher “up” the banana-curve, which is consistent with the inferred luminosity of 0.15 LEdd from .
The energy dependence of the rms variability of the high-frequency noise (Fig. 4) shows that the HFN is “hard”, i.e. the variability increases towards higher energies. This has been observed before in e.g. 1E1742.5–3045 (Olive et al. o:98 (1998), in the island state), GX 3+1 (Makishima et al. m:89 (1989)), and 4U 1820–30 (Dotani et al. d:89 (1989)). The energy dependence is roughly consistent with a 8% variability in the Comptonized component, which, at lower energies, progressively gets diluted by the soft component (the (disk-)blackbody). However the spectral decomposition is not unique and the statistical quality of the rms variability as a function of energy is not good enough to associate the variability uniquely with one spectral component. e.g. it is conceivable that (an energy-dependent) part of the disk-blackbody component also contributes to the variability.
It is interesting to interpret the spectrum in terms of the boundary layer model (e.g. Popham & Sunyaev ps:00 (2000); earlier work by e.g. Kluzniak & Wilson k:91 (1992)). In this model the dominant source of high-energy photons is expected to be the boundary layer where the accretion disk meets the (weakly magnetized) neutron star. Roughly speaking this model predicts a Comptonized component together with a thermal component. Our results (and those of e.g. Barret et al. b:00 (2000)) are in global agreement with the predictions of this model. Also the fact that the observed variability of the high-frequency noise is consistent with most of the variability originating in the Comptonized component, argues in favour of the model.
The observed Fe line energy is consistent with neutral or moderately ionized iron. However, care should be taken when interpreting the energy of the Fe line, since the addition of an edge significantly shifts the energy (to a value consistent with higly ionized Fe i.e. 6.7 keV). Following the discussion in Barret et al. (b:00 (2000)) the most likely location of the material emitting the Fe line is in the accretion disk. A strong Fe line should then be accompanied by a Compton reflected spectrum. It is indeed the case that a fit with a reflected component gives a better fit (although it is not significantly better than the disk blackbody + compTT fit) to the Ser X-1 spectrum (where the Fe line is strong, 275 eV). However, the quality of our data does not allow us to draw any definitive conclusions about the presence or absence of reflection. The obtained width () of the Fe line is significantly higher than 0. This might be caused by Comptonization of the Fe line photons, or by other effects which cause broadening of the Fe line.
Summarizing we have observed two burst sources (GX 3+1 and Ser X-1) with similar spectral parameters (temperature of Comptonizing plasma 2.5 keV with a large (6–10) optical depth). This is in contrast with low state spectra of burst sources which have a much higher temperature (30 keV) and a smaller optical depth.
Acknowledgements.
The BeppoSAX satellite is a joint Italian-Dutch programme. We thank the BeppoSAX and RXTE planners (Donatella Ricci and Evan Smith) for making the simultaneous observations possible. We thank Arvind Parmar for a careful reading of the manuscript. Jean Swank is thanked for making the RXTE observations possible. We thank the referee, Phil Kaaret, for very useful comments.References
- (1) Anders E., Grevesse N., 1989, Geochimica et Cosmochimica Acta 53, 197
- (2) Barret D., Olive J.F, Boiron L., et al., 2000, ApJ 553, 329
- (3) Barret D., Vedrenne G., 1994, ApJS 92, 505
- (4) Bloser P.F., Grindlay J.E., Kaaret P., et al., 2000, ApJ submitted (astro-ph/0005496)
- (5) Boella G., Chiappetti L., Conti G., et al., 1997, A&AS 122, 327
- (6) Bradt H.V., Rothschild R.E., Swank J.H., 1993, A&AS 97, 355
- (7) Bradt H., Naranan S., Rappaport S., Spada G., 1968, ApJ 152, 1005
- (8) Churazov E., Gilfanov M., Sunyaev R., et al., 1995, ApJ 443, 341
- (9) Dotani T., Mitsuda K., Makishima K., Jones M.H., 1989, PASJ 41, 577
- (10) Friedman H., Byram E., Chubb T., 1967, Science 156, 374
- (11) Frontera F., Costa E., Dal Fiume D., et al., 1997, A&AS 122, 371
- (12) Guainazzi. M., Parmar A.N., Oosterbroek T., et al., 1998, A&A, 339, 802
- (13) Guainazzi M., Parmar A.N., Oosterbroek T., 2000, Astr. Lett. & Comm., submitted
- (14) Hasinger G., van der Klis M., 1989, A&A 225, 79
- (15) in’t Zand J., Verbunt F., Strohmayer T.E., et al., 1999, A&A, 345, 100
- (16) Kluźniak W., Wilson J.R., 1991, ApJ 372, L87
- (17) Kuulkers E., van der Klis M., 2000, A&A 356, L45
- (18) Magdziarz P., Zdziarski A.A., 1995, MNRAS 273, 837
- (19) Makishima K., Mitsuda K., Inoue H., et al., 1983, ApJ 267, 310
- (20) Makishima K., Ishida M., Ohashi T., et al. 1989, PASJ, 41, 531
- (21) Manzo G., Guarrusso S., Santangelo A., et al., 1997, A&AS 122, 341
- (22) Merloni A., Fabian A.C., Ross R.R., 2000, MNRAS 313, 193
- (23) Mitsuda K., Inoue H., Koyama K., 1984, PASJ 36, 741
- (24) Morisson D., McCammon D., 1983, ApJ 270, 119
- (25) Olive J.F, Barret D., Boirin L., et al., 1998, A&A 333, 942
- (26) Parmar A.N., Martin D.D.E., Bavdaz M., et al., 1997, A&AS 122, 309
- (27) Piraino S., Santangelo A., Ford E.C., Kaaret P., 1998, Proc. 19th Texas Symp. Eds.: J. Paul, T. Montmerle, E. Aubourg
- (28) Piraino S., Santangelo A., Ford E.C., Kaaret P., 1999, A&A 349, L77
- (29) Popham R., Sunyaev R., 2000, ApJ submitted, astro-ph/0004017
- (30) Sidoli L., Parmar A.N., Oosterbroek T., et al., 2000, A&A submitted
- (31) Sunyaev R.A., Titarchuk L.G., 1980, A&A 86, 121
- (32) Swank J., Becker R., Pravdo S., Serlemitsos P., 1976, IAU Circ. 2963
- (33) Titarchuk L., 1994, ApJ 434, 313
- (34) Valinia A., Marshall F.E., 1998, ApJ 505, 134
- (35) van der Klis M., 1995, X-ray Binaries, Eds. W.H.G. Lewin, J. van Paradijs, E.P.J. van den Heuvel, Cambridge University Press
- (36) van Paradijs J., van der Klis M., 1994, A&A 281, L17
- (37) van Straaten S., Ford E.C., van der Klis M., Méndez M., Kaaret P., 2000, ApJ submitted, astro-ph/0001480
- (38) Yoshida K., Mitsuda K., Ebisawa K., et al., 1993, PASJ 45, 605
- (39) Wijnands R., van der Klis M., 1999, ApJ 514, 939
- (40) Zhang S.N, Harmon B.A., Paciesas W.S., et al. 1996, A&AS 120, 179