EUV and X-ray observations of Abell 2199: a three-phase intracluster medium with a massive warm component
Abstract
Various independent ways of constraining key cosmological parameters yielded a consensus range of values which indicates that at the present epoch the bulk of the universe’s baryons is in the form of a warm ( 106 K) gas - a temperature regime which renders them difficult to detect. The discovery of EUV and soft X-ray excess emission from clusters of galaxies was originally interpreted as the first direct evidence for the large scale presence of such a warm component. We present results from an EUVE Deep Survey (DS) observation of the rich cluster Abell 2199 in the Lex/B (69 - 190 eV) filter passband. The soft excess radial trend (SERT), shown by a plot against cluster radius of the percentage EUV emission observed above the level expected from the hot intracluster medium (ICM), behaves as a simple function of which decreases monotonically towards ; it smoothly turns negative at 6 arcmin, inwards of this radius the EUV is absorbed by cold matter with a line-of-sight column density of 2.7 1019 cm-2. The centre of absorption is offset from that of the emission by 1 arcmin, and the area involved is much larger than that of the cooling flow. These facts together provide strong evidence for a centrally concentrated but cluster-wide distribution of clumps of cold gas which co-exist with warm gas of similar spatial properties. Further, the simultaneous modeling of EUV and X-ray data requires a warm component even within the region of absorption. The phenomenon demonstrates a three phase ICM, with the warm phase estimated to be 5-10 times more massive than the hot.
Key Words.:
Galaxies: intergalactic medium, cooling flowsAbell 2199 is a well-studied X-ray bright cluster of galaxies (e.g. Siddiqui et al. 1998). In a recent study (Lieu et al. 1999a; LBM99) we presented a first observation of the cluster with the Extreme Ultraviolet Explorer (EUVE; Bowyer & Malina 1991); the cluster showed clear evidence of excess emission in the DS Lex/B filter ( 65-190 eV passband) above the thermal contribution from the hot intra-cluster medium (ICM). The A2199 sky area was re-observed by EUVE for 57 ksec in February 1999 (see Lieu et al. 1999b; L99). The program featured an in situ background measurement by pointing at small offset from the cluster, which asserted the correctness of the original method of determining (and subtracting) the background from an asymptotically flat region of the radial profile. Complementary data in the X-ray (0.2 - 2.0 keV) passband, as gathered by a ROSAT PSPC observation which took place in July 1990, with an exposure of 8.5 ksec, were extracted from the public archive 111See the High Energy Astrophysics Archive available at http://heasarc.gsfc.nasa.gov/docs/rosat/archive.html. Same PSPC observation (RP number 150083) as in L99 and LBM99 was consulted for the present work.. For correct comparison between the EUV and X-ray emissions, the Galactic HI column density was measured at NH = (8.3 1.0) 1019 cm-2 by a dedicated observation at Green Bank (Kaastra et al. 1999), and was found to be spatially smooth. The EUV and X-ray data were simultaneously modeled with a thin plasma emission code (Mewe et al. 1985; Mewe et al. 1986) and appropriate line-of-sight Galactic absorption (Morrison & McCammon 1983) for the above value of NH. At a given radius the hot ICM was assumed to be isothermal, with the abundance fixed at 0.3 solar apart from the cooling flow region where the parameter became part of the data fitting in order to account for any possible abundance gradient within this region (a different way of handling the abundance does not sensitively affect the results presented in this work).
The forementioned model, when applied to the PSPC spectra at all radii, generally leads to acceptable fits. At low energies the EUV measurements gave crucial new information. The overall effect is a soft excess as reported previously. A plot of the SERT indicates, however, that the percentage EUV excess at a given radius is less at the centre. In fact, the trend takes the form of a negative central excess (i.e. absorption, see Fig. 1), which steadily rises with radius until the 6 arcmin point, beyond that the fractional excess turns positive and continues to increase until the limiting radius of EUV detection ( 20 arcmin, Lieu et al. 1999b). In the present paper we interpret the results physically, and demonstrate that such a trend, together with the spectral data, provide compelling reasons for a three phase model of the ICM, with the warm intermediate phase as origin for the soft excess.
We first address the outer parts of the cluster, where the data present formidable difficulties to the non-thermal interpretation of the soft excess which postulates a large population of intracluster relativistic electrons undergoing inverse-Compton (IC) interaction with the cosmic microwave background (CMB, see Ensslin & Biermann 1999, Sarazin & Lieu 1998). Fig. 2 shows a composite plot of the EUV and X-ray data for the 12 - 15 arcmin annulus. The prominent EUV excess, unaccompanied by any similar effect in soft X-rays, implies that the bulk of the relativistic electrons have energies below 200 MeV, a cut-off which is most obviously understood as due to aging (i.e. synchrotron and inverse-Compton losses): the electrons are at least 3 109 years old. However, in order to account for the large EUV excess the highly evolved electron spectrum at the present epoch must still include sufficient particles ahead of the cut-off. This means that for the region of concern, at injection (when the power-law differential number index is assumed to be 2.5, in accordance with our Galactic cosmic ray index) the relativistic electron pressure would have exceeded that of the hot ICM by a factor of 4, leading to a major confinement problem for the hot gas. The inclusion of cosmic ray protons exaggerates the difficulty, as protons carry 10 - 100 times more pressure than electrons. Thus the only other viable alternative, viz. the originally proposed thermal (warm) gas scenario (Lieu et al. 1996), must now be considered seriously. This is especially so in the light of the recent constraints on cosmological parameters, which point to the existence of a warm and massive baryonic component (Cen & Ostriker 1999, Maloney & Bland-Hawthorn 1999).
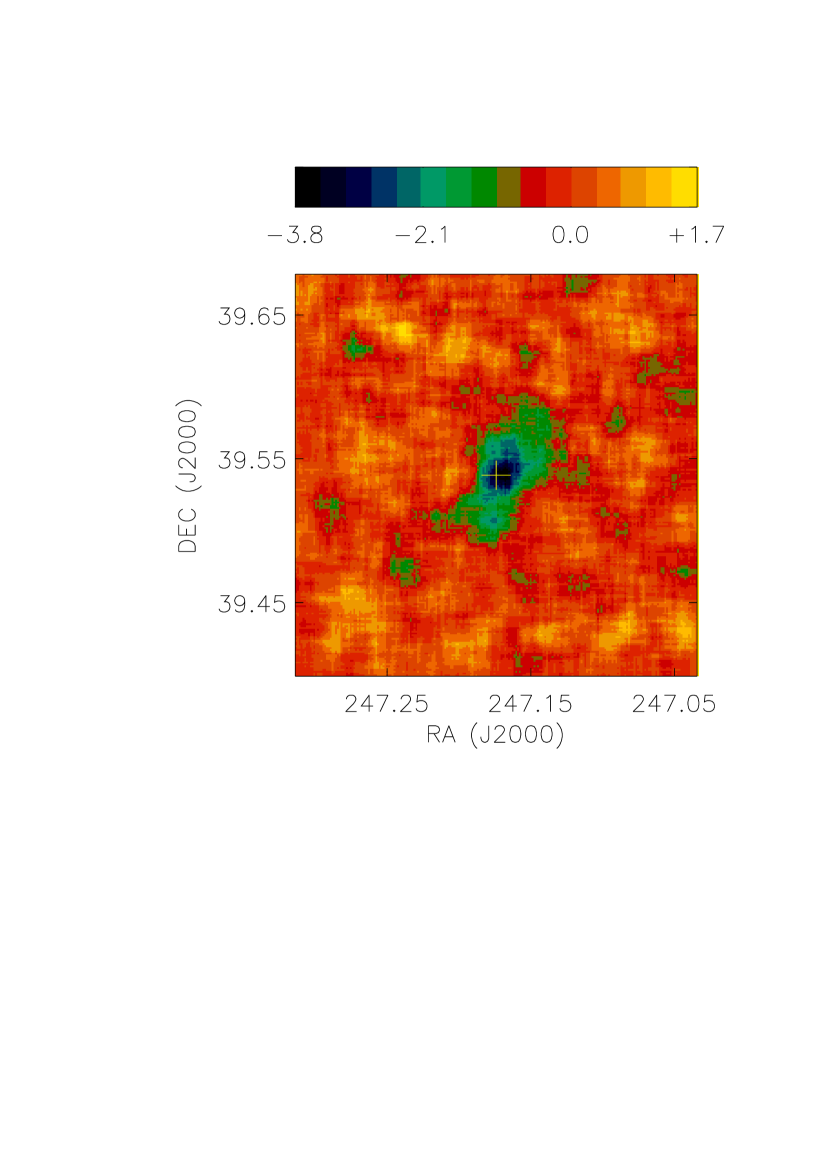
Turning to the core of the cluster, one sees in Fig. 1 that the EUV is absorbed. For more details, in Fig. 3 is shown an image of the brightness of the EUV excess. The data suggest an intermixed model (Jacobsen & Kahn 1986) of the ICM: the lack of soft excess at small radii is due entirely to the larger amount of cold absorbing matter collected in this region. Our inference of the state of the ICM is reinforced by the behavior of the SERT: the trend depicted in Fig. 1 follows a simple parametric profile which applies equally satisfactorily to the absorption and soft excess regions, with no change of behavior at the transition radius of 6 arcmin. In fact, there is no particular significance in this radius (it is much larger than the cooling flow radius of 2 arcmin; Siddiqui et al. 1998). The observation is naturally interpreted as the combined effect of clumped emission regions containing a warm component, absorbed by clouds of cold gas (neutral H at T K) in between them (statistical quality of the data can not well constrain the size of the clouds. However, if pressure equipartition with the hot gas is assumed, the HI mass estimates derived in the following convert to an approximate cloud radius of 1-10 kpc). Both the warm and the cold gas distributions are cluster-wide and centrally condensed, but with increasing radius the lines-of-sight are more transparent to EUV photons created at locations along them. For comparable intrinsic emission profiles of the soft excess and the hot ICM, the result is an outwardly rising SERT.
The argument for an intermixed ICM also rests upon direct evidence for the presence of soft excess even in the absorbed regions. We show in Fig. 4 a core spectrum, where it can be seen that by the time intrinsic absorption accounts for the EUV decrement, an excess is seen in soft X-rays (which are less absorbed). This clearly indicates a complex ICM where the various gas phases co-exist. The apparent negative soft excess within the absorption radius is simply due to an abundance of cold clouds masking EUV emissions from the warm and hot components.
The thermal origin of the EUV is compelling for another reason: the widespread absorption reported here implies the existence of a cold phase in the midst of the well known hot phase, and then the question naturally arises concerning why a warm phase is absent, and is not the cause of the soft excess. At the very least, mixing layers on the surface of the cold clouds would suffice to produce the intermediate phase (Fabian 1997).
The mass budgets of the three ICM components in consideration are estimated as follows. The intrinsic HI column density as inferred from the central EUV absorption converts to a density of cold clouds of 5 1010 M⊙ Mpc-3. This gives a mass ratio of 1:2000 between the cold and hot gas along the line-of-sight. Any estimate of the mass of warm gas at the centre is likely to be inaccurate, since the soft emission is significantly absorbed. We therefore considered the 12 - 15 arcmin region where this complication is not as severe as in the centre. The extreme softness of the emission (Fig. 2) limits the gas temperature to kT 100 eV (or T 106 K), with a correspondingly large mass estimate of 1.25 1014 M⊙ 222Errors are estimated from the statistical uncertainties in the determination of the warm gas emission measure, as obtained by spectral modelling with XSPEC 10.0., under the assumption of 100 % filling factor of the warm gas in the spherical shell of concern; this is 43 times more massive than the hot ICM in this region, as obtained from the hot gas density of Siddiqui et al. (1998). The 1- lower limit ratio implies 3 times more missing baryons than expected (Cen & Ostriker 1999), although it must be emphasized that both the mass and bolometric luminosity can be substantially reduced if the gas turns out to be warmer. This can be realized by adopting alternative emission models for the warm phase, especially those which involve an underionized gas, since the EUV emission efficiency is then enhanced, and the gas can be warmer than the above temperature constraint. Plasma in such an ionization state is easily produced by mixing layers or shock heating.
References
Balucinska-Church M., McCammon, D. 1992, ApJ 400, 699.
Bowyer S., Malina R.F. 1991, in EUV Astronomy,
eds. R.F. Malina, S. Bowyer (new York:Pergamon), 397.
Cen R., Ostriker J.P. 1999, ApJ 514, 1-6.
Maloney P.R., Bland-Hawthorn J. 1999, ApJ 522, L81-84.
Ensslin T.A., Biermann, P.L. 1998, A&A 330,
90–98.
Fabian A.C. 1997, Science 275, 48–49.
Jakobsen P., Kahn, S.M. 1986, ApJ 309, 682 .
Kaastra J.S. 1992 in An X-Ray Spectral Code for Optically Thin Plasmas
(Internal SRON-Leiden Report, updated version 2.0).
Kaastra J.S., Lieu R.,
Mittaz, J.P.D. et al.
1999, ApJ 519, L119.
Lieu R., Mittaz J.P.D., Bowyer S. et al.
1996, Science, 274,1335–1338.
Lieu R., Bonamente M., Mittaz
1999a, ApJ 517, L91.
Lieu R., Bonamente M., Mittaz et al.
1999b, ApJ 527, L77.
Mewe R., Gronenschild E.H.B.M., van den Oord G.H.J. 1985, A&A 62, 197 .
Mewe R., Lemen J.R., van den Oord G.H.J. 1986, A&A 65, 511.
Morrison R., McCammon, D. 1983, ApJ 270, 119.
Sarazin C.L., Lieu R. 1998, ApJ 494, L177.
Siddiqui H., Stewart G.C., Johnston, R.M. 1998,
A&A, 334, 71.
Snowden S.L., McCammon D., Burrows D.N., Mendenhall, J.A. 1994,
ApJ 424, 714.