XMM-Newton observations of NGC~253: Resolving the emission components in the disk and nuclear area††thanks: Based on observations with XMM-Newton, an ESA Science Mission with instruments and contributions directly funded by ESA Member States and the USA (NASA).
We describe the first XMM-Newton observations of the starburst galaxy NGC~253. As known from previous X-ray observations, NGC~253 shows a mixture of extended (disk and halo) and point-source emission. The high XMM-Newton throughput allows a detailed investigation of the spatial, spectral and variability properties of these components simultaneously. We characterize the brightest sources by their hardness ratios, detect a bright X-ray transient 70″ SSW of the nucleus, and show the spectrum and light curve of the brightest point source (30″ S of the nucleus, most likely a black-hole X-ray binary, BHXRB). The unresolved emission of two disk regions can be modeled by two thin thermal plasma components (temperatures of 0.13 and 0.4 keV) plus residual harder emission, with the lower temperature component originating from above the disk. The nuclear spectrum can be modeled by a three temperature plasma ( 0.6, 0.9, and 6 keV) with the higher temperatures increasingly absorbed. The high temperature component most likely originates from the starburst nucleus, as no non-thermal component, that would point at a significant contribution from an active nucleus (AGN), is needed. Assuming that type IIa supernova remnants (SNRs) are mostly responsible for the E4 keV emission, the detection with EPIC of the 6.7 keV line allows us to estimate a supernova rate within the nuclear starburst of 0.2 yr-1. The unprecedented combination of RGS and EPIC also sheds new light on the emission of the complex nuclear region, the X-ray plume and the disk diffuse emission. In particular, EPIC images reveal that the limb-brightening of the plume is mostly seen in higher ionization emission lines, while in the lower ionization lines, and below 0.5 keV, the plume is more homogeneously structured. The plume spectrum can again be modeled by a three temperature thermal plasma containing the two low temperature nuclear components (though less absorbed) plus an unabsorbed 0.15 keV component similar to the disk spectra. This points to new interpretations as to the make up of the starburst-driven outflow.
Key Words.:
X-rays: galaxies – Galaxies: individual: NGC~253 – Galaxies: spiral – Galaxies: starburst – Interstellar medium: jets and outflows1 Introduction
X-ray emission from starburst galaxies is known to be complex, revealing both point sources and diffuse X-ray emission in abundance. X-ray binaries, supernovae, supernova remnants and nuclear sources dominate the point-like source contribution, while the hot phases of the interstellar medium (ISM), in the form of hot outflows (or winds), more bound coronal features and diffuse emission within the disk, make up the diffuse, gaseous component.
The nearby edge-on galaxy NGC~253 is perhaps the classic example (along with M82) of a starburst galaxy, and as such, has received a great deal of attention from X-ray observatories over the years. Initial Einstein observations (Fabbiano & Trinchieri fab84 (1984); Fabbiano fab88 (1988)), along with seeing several bright point-like disk sources, discovered large plumes of diffuse emission extending above and below the disk of the galaxy. This emission is thought to be due to “mass-loading” of a hotter wind with cooler ambient gas, i.e. shock heated and accelerated cooler interstellar and circumnuclear gas (Heckman et al. hec90 (1990); Strickland et al. str00 (2000)).
Several studies were made of NGC~253 with ROSAT. Both the PSPC and HRI data were presented by Read et al. (rea97 (1997)) and Dahlem et al. (dahlem (1998)). An extensive ROSAT point source catalogue of NGC~253 by Vogler & Pietsch (vog99 (1999)) made it possible to separate the point source and diffuse X-ray emission, allowing insights into the spatial, spectral and timing properties of the many point sources within NGC~253. The ‘nuclear’, likely starburst-associated source appeared to be extended, and the brightest point-like source, lying some 30″ south of the nucleus, at the border of a plume of diffuse emission, was thought to be a plausible BHXRB candidate. Structure in the diffuse emission could now be studied in detail, Pietsch et al. (pie00 (2000)) reporting different diffuse emission components in the nucleus, disk and halo. Especially of note was the discovery of coronal diffuse emission bubbling out of the disk, via galactic fountains and chimneys (essentially formed by localized high-activity star-forming regions within the disk), then falling ballistically back to the plane (e.g. Norman & Ikeuchi nor89 (1989)). Also observed was a hollow-cone shaped diffuse plume of emission extending up to 700 pc along the SE minor axis, thought to be due to the interaction of the galactic superwind and the dense disk ISM.
More recent high spectral resolution observations with ASCA (Ptak et al. pta97 (1997)) have revealed strong O, Ne, Fe, Mg, S and Si emission lines in the integrated NGC~253 spectrum, and these results have been backed up by BeppoSAX observations (Cappi et al. cappi (1999)), where for the first time, the 6.7 keV Fe K line has been detected (Persic et al. per98 (1998)). Chandra observations allowed for the first time a detailed study of the SE plume, tentatively examined with ROSAT, and showed it to be a well-collimated, limb-brightened kpc-scale conical outflow, which closely follows in morphology the known H outflow. Furthermore, several point sources are seen, the nuclear feature being partly separated into a number of distinct sources (Strickland et al. str00 (2000)).
In this letter we report the results of the performance verification phase observation of NGC~253 to demonstrate XMM-Newton’s capabilities of spatially resolved spectroscopy in a mixture of point sources and diffuse emission.
2 Observations and data analysis
| E | Det. | Filter | Mode | Dur. | LB |
|---|---|---|---|---|---|
| (s) | (s) | ||||
| 1 | RGS1 | SPECTR + Q | 60 613 | 47 313 | |
| RGS2 | SPECTR + Q | 60 593 | 47 293 | ||
| MOS1 | Medium | PRI FULL | 38 498 | 34 492 | |
| MOS2 | Thin | PRI FULL | 38 498 | 34 489 | |
| PN | Medium | PRI FULL | 39 000 | 35 767 | |
| 2 | RGS1 | SPECTR + Q | 17 402 | 6 102 | |
| RGS2 | SPECTR + Q | 17 406 | 6 106 | ||
| MOS1 | Medium | PRI FULL | 13 593 | 7 190 | |
| MOS2 | Thin | PRI FULL | 13 597 | 7 188 | |
| PN | Thin | PRI FULL | 13 999 | 7 400 |
NGC~253 was observed with the European X-ray observatory XMM-Newton (Jansen et al. jan01 (2001)) during orbit 89 on July 3rd and 4th 2000 for two exposures each of the European Photon Imaging Camera instruments (EPIC, Turner et al. tur01 (2001); Strüder et al. strue01 (2001)) and the Reflection Grating Spectrometer (RGS, den Herder et al. her01 (2001)). For details of the instrument setups and exposure durations for the different instruments see Table 1. The position angle of the observation (55°) was close to the position angle of the galaxy (52°), and so, to minimize the effect of the EPIC PN CCD boundaries on the plume and disk emission, the nominal on-axis pointing position was offset by 65″ to the SE of the NGC~253 nucleus along the galaxy’s minor axis.
The standard reduction of the EPIC and RGS data was performed using the latest version of the Science Analysis System (SAS). This involved the subtraction of hot, dead or flickering pixels, removal of events due to electronic noise and, for the EPIC detectors, correction of event energies for charge transfer losses. Also, times of high background were excluded to maximize sensitivity to low surface brightness emission. While exposure 1 was interrupted by just a short background flare, a major part of exposure 2 suffered from high background (see duration of low background (LB) per exposure in Table 1). Source searching was performed on the cleaned MOS1, MOS2 and PN datasets separately. After comparing these source lists, the MOS datasets were transformed to the PN positions, whereupon, merging of the cleaned, aligned EPIC datasets took place. A final transformation of the EPIC merged dataset to ROSAT positions was then performed.
For fitting PN spectra and for defining spectral model lines in the hardness ratio colour-colour plots we used response matrices provided by the EPIC instrument team (PN_jul00 and for MOS v3.14).
For the RGS, source events from the total observation were first extracted using a 1′ spatial mask in the cross-dispersion direction (i.e. along the minor axis centered on the bright nuclear area), and subsequently with a dispersion/pulse-height mask to select the first-order photons. The background spectrum was estimated using the same observation from regions 1′ from the nucleus, which may contain events from the galaxy’s diffuse emission. Data from the two RGS’s are combined and divided by the exposure and the effective area of the instrument.
3 X-ray emission from the disk
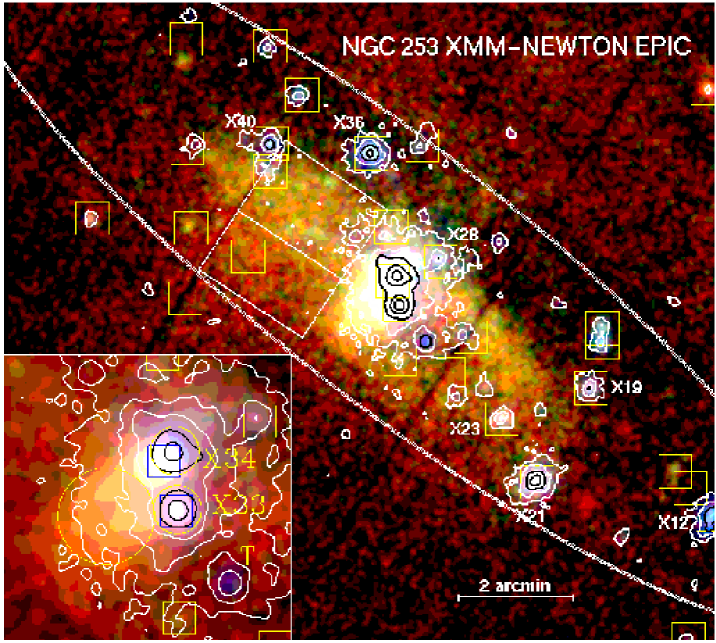
The EPIC data clearly reveal more point sources than the deep ROSAT observations and allow the mapping of diffuse emission in the disk (Fig. 1). The underlying surface brightness at an energy of 1 keV increases by factors of 10 between disk, plume and extended nucleus. In the following we concentrate on the ten brightest NGC~253 sources and present a brief analysis of the diffuse emission in the disk.
3.1 Point sources
| Src. | Count rate | EPIC hardness ratios | |||
| MOS1+2 PN | HR1 HR2 HR3 | (1037 | |||
| (ct ks-1) | erg s-1) | ||||
| X34 | 445(23) 470(24) | 1.00(0) -0.49(1) -0.40(1) | 120 49 | ||
| X33 | 303(15) 293(15) | 1.00(0) -0.12(1) -0.57(1) | 95 32 | ||
| X21 | 169( 4) | 50 20 | |||
| X36 | 86( 2) 111( 3) | 0.94(1) -0.39(1) -0.75(2) | 23 9.5 | ||
| X12 | 81( 2) 99( 3) | 0.97(1) -0.16(2) -0.67(2) | 25 7.5 | ||
| T | 28( 2) 26( 2) | 0.88(2) -0.10(3) -0.33(3) | 14 2.1 | ||
| X40 | 27( 1) | 9.2 2.8 | |||
| X19 | 19( 1) 26( 1) | 0.80(3) -0.41(3) -0.46(5) | 5.5 1.8 | ||
| X28 | 17( 1) 24( 1) | 0.86(2) -0.54(2) -0.61(5) | 4.7 1.5 | ||
| X23 | 17( 1) 22( 1) | 0.53(3) -0.57(3) -0.47(7) | 4.6 2.3 | ||
We searched for the ten brightest on-galaxy sources detected with the highest maximum likelihood in the summed low background MOS1 and MOS2 images to find new NGC~253 X-ray transients (Table 2). Where available we use the source numbers introduced for the ROSAT NGC~253 point-like sources (Vogler & Pietsch vog99 (1999)). This list was confirmed by a visual inspection, and source X28 was added (detected by PN only, though obviously real). For two sources (X21 and X40) the PN count rates and hardness ratios are not given as they lie close to the chip gaps. The sources X17/X18 (two adjacent boxed sources north of X19 in Fig. 1) could not be distinguished by the SAS detection algorithms, and hence will be discussed in a later full point source analysis of NGC~253.
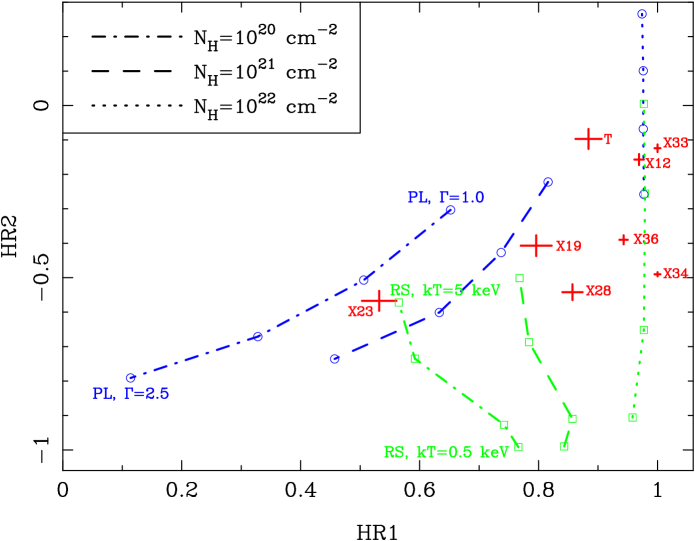
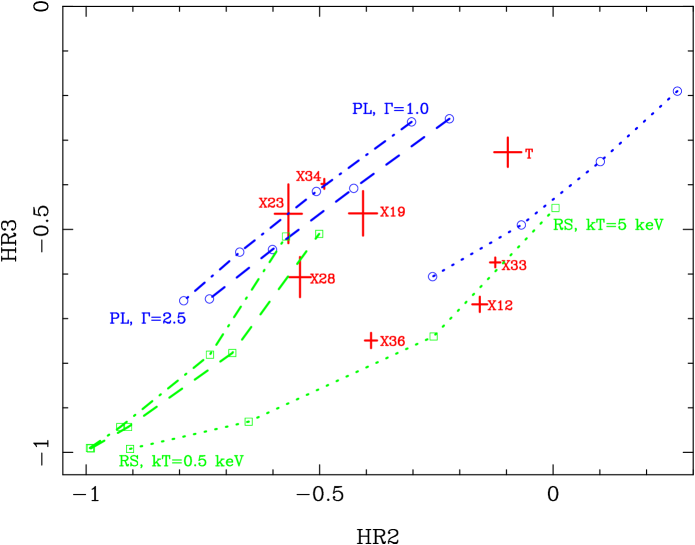
Count rates were calculated using the total source count output in the (0.2–10) keV band from the SAS source detection software. Due to the complex background, the 4 sources closest to the nucleus (X34, X33, X28 and T) were treated individually. We assumed a systematic error for the count rates of 5% for the 4 near-nuclear sources and 2% for the other sources which dominates the overall error. Hardness ratios (HRs) were determined from 4 bands ( [0.2–0.5] keV, [0.5–2.0] keV, [2.0–4.5] keV, [4.5–10.0] keV) by aperture photometry to get raw counts per source per band on combined low background images from all the detectors and exposures. The HRs have been calculated as hard – soft / hard + soft, with HR1 being (0.2–0.5) keV vs (0.5–2) keV and so on (’soft’ here means the count rate in the [0.2–0.5] keV band etc.) with errors as per Appendix A of Ciliegi et al. (ciliegi (1997)). In Fig. 3 we show the position of the sources in HR colour-colour plots, where we compare them to absorbed power law and absorbed, solar abundance thin thermal plasma models. The model points have been calculated using the observation-specific combinations of EPIC responses, filters and integration times.
All bright persistent sources known from the ROSAT observations are also detected by XMM-Newton. While the EPIC luminosity of most of the sources is similar to that measured by ROSAT, X21 is brighter by a factor of two and X40 fainter by more than a factor of 3. In addition we detect SSW of the nucleus one new bright transient source (T, , ) that already was visible during the Chandra observation half a year earlier (Strickland et al. str00 (2000)). HR1 is mainly an indicator of the absorption depth within NGC~253 under which a source is seen, while HR2 and HR3 further characterize the spectrum. The positions of most of the sources in the two colour-colour plots are consistent with a spectrum dominated by a single component. However, the nuclear source (X34) seems to be highly absorbed in HR1–HR2 and the opposite in HR2–HR3 indicating a complex spectrum, as confirmed by the modeling in Sect. 4.1. The transient (T) is clearly the hardest source in the sample and highly absorbed. X33 and X12 seem to be even more absorbed but have a softer spectrum. Their high X-ray luminosity may indicate that these sources are BHXRBs and the transient may be an X-ray nova such as have been seen in our Galaxy (Tanaka & Shibazaki tan96 (1996)). X19, X23, and X28 are less absorbed and also have softer spectra indicative of low mass X-ray binaries (LMXB). Most of the sources show time variability during the ROSAT and/or XMM-Newton observations, arguing for a LMXB nature. The low HR3 of X36 together with the lack of time variability may point to it being a SNR.
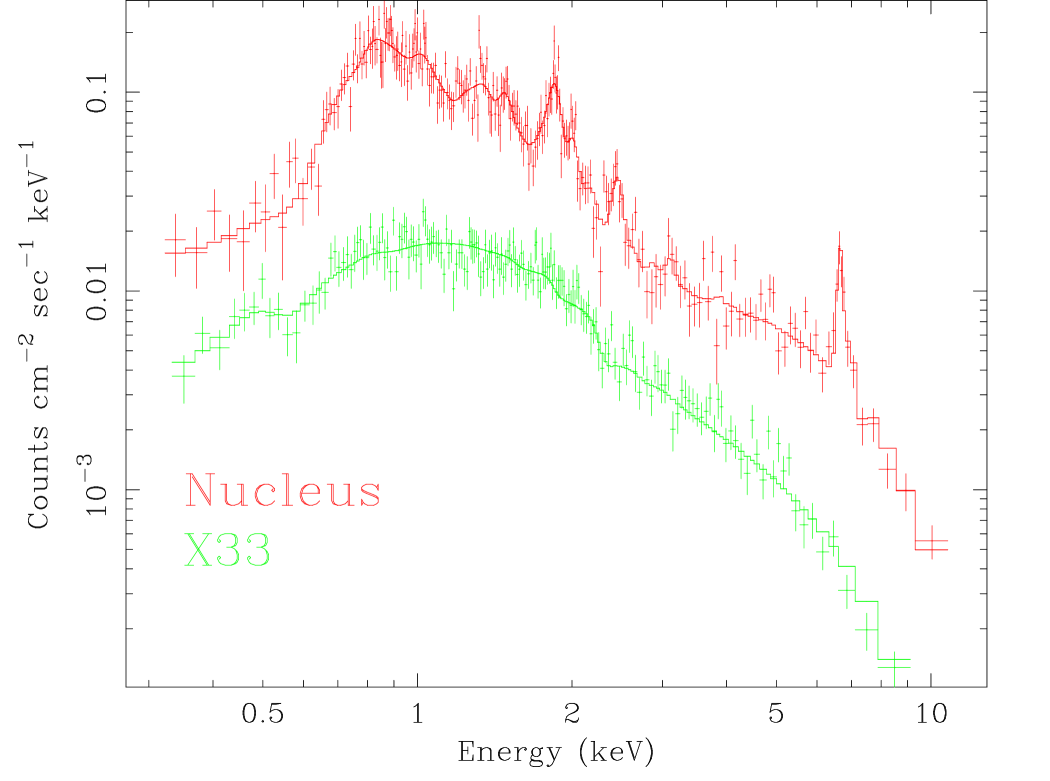
While a detailed spectral and time variability study of all the NGC~253 sources is beyond the scope of the present paper, we demonstrate here the capabilities of the EPIC instrument on the brightest point source, X33. The source (as well as X21) varies by a factor during the XMM-Newton observation (see Fig. 4), however no significant spectral variability is detected. Its spectrum (Fig. 2) can be fit by a thermal bremsstrahlung model, assuming an absorbing column of = () cm-2 and temperature of () keV ( = 0.98 for 180 d.o.f.). The prefered model for BHXRBs (a disk-blackbody plus power law, see e.g. Makishima et al. mak86 (1986)) gives an excellent fit ( = () cm-2, k = keV, (cos )1/2 = km assuming NGC~253 distance, and photon index of , = 0.88 for 178 d.o.f.). The high temperature and low (cos )1/2 when compared to Galactic BHXRBs may be explained by the black hole rotation, which makes the disk get closer to the black hole and hence hotter, as suggested for other ultraluminous compact X-ray sources in nearby spiral galaxies by Makishima et al. (mak00 (2000)).
3.2 Diffuse disk emission
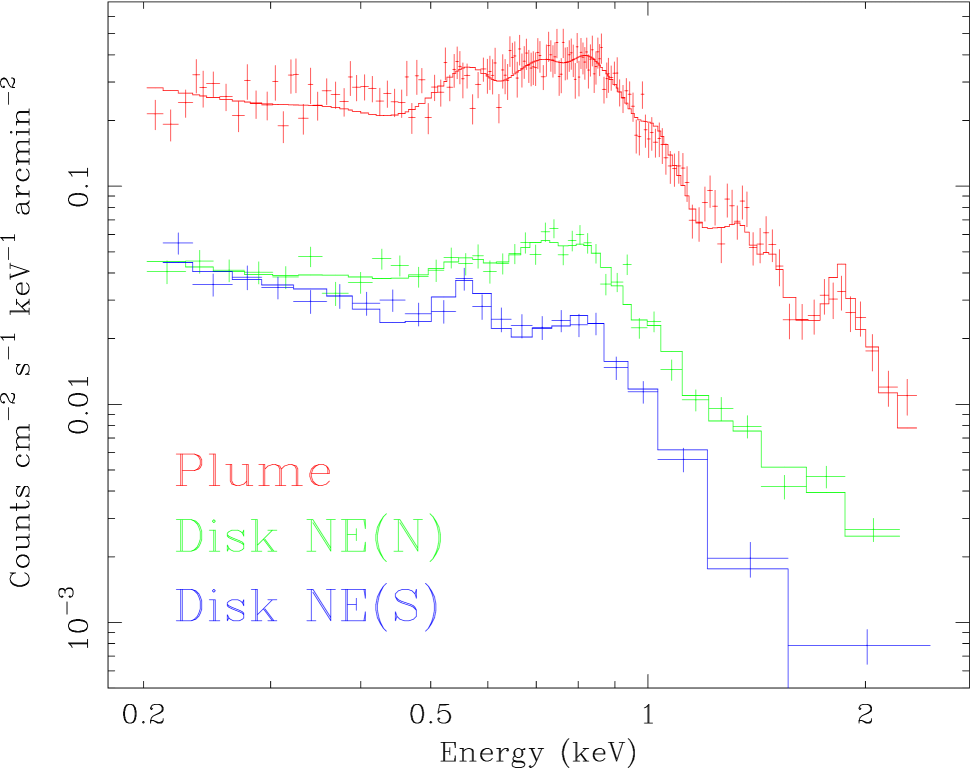
The EPIC image reveals unresolved emission from the inner disk that is harder along the inner spiral arms. We extracted EPIC PN spectra NE of the nucleus, selecting areas of harder emission close to the major axis (N) and softer emission adjacent to the S (yellow greenish and red; see Fig. 1). While the spectra below 0.5 keV are very similar (Fig. 2), the NE(N) shows additional emission extending to energies of 2 keV. They both indicate emission lines from O vii and Fe xvii pointing at major hot plasma origin. We therefore modeled the spectra, assuming ISM components of solar abundance with two temperatures, shining through the ISM, i.e. correcting for the Galactic foreground of = 0.13 cm-2 (Dickey & Lockman 1990) and adding additional absorption within NGC~253. For the NE(N) spectrum, we had to introduce a power law component which may describe contributions from unresolved point sources. Without including systematic errors that one might expect from calibration uncertainties for the large extraction areas, we get reasonable spectral fits to the (0.2–2.5) keV band ( = 1.5 and 1.6 for 30 and 17 d.o.f. for NE(N) and NE(S), respectively). The derived distinct lower and higher temperatures (0.13 keV and 0.5 keV) agree in both areas within the errors, and the cooler component does not need additional absorption within NGC~253, indicating that the emission originates from the halo above the disk. These temperatures, derived over small areas, agree with the ROSAT results derived for the entire disk. More detailed analysis, including all EPIC detectors and exposures, will lead to a temperature map of the NGC~253 disk.
4 Emission from the nuclear region


The nuclear region of NGC~253 (see inlay Fig. 1) is bright enough for a detailed study with both RGS and EPIC. The RGS spectrum (Fig. 5) is dominated by emission lines of hydrogenic and heliumlike charge states of the abundant low Z elements (N, O, Ne, Mg, Si) and the neonlike and fluorinelike charge states of Fe. With the help of EPIC we can further localize the RGS emission components in the nuclear area (e.g. Fig. 7). We have not performed quantitative spectral fits to the RGS data, but several conclusions can be drawn directly from Fig. 5. The strength of the Fe L lines, specifically the Fe xvii line at 15 Å, relative to the K-shell lines suggests that collisional ionization is the dominant soft X-ray emission mechanism. We find no evidence of recombination emission in the RGS band. The inferred temperature ranges from 300 eV (O vii, Fe xvii) to 1.5 keV (Mg xii, Si xiii). The weakness of the longer wavelength lines suggests significant photoelectric absorption with implied column densities in the range 1021–1022 cm-2. The abundances do not appear to be unusual, although accurate abundance estimates will depend on the precise temperature distribution, which has yet to be determined. The general appearance of the spectrum is reminiscent of the spectrum of intermediate age supernova remnant gas, as might be expected for a starburst nucleus and the interaction of the outflowing wind with the cooler gas of the ISM in the plume. The characteristic emission measure in this region is cm-3 (assuming solar abundances), which, given the 30″ extent of the nuclear source, implies a characteristic electron density of cm-3.
4.1 Unresolved X-ray nucleus
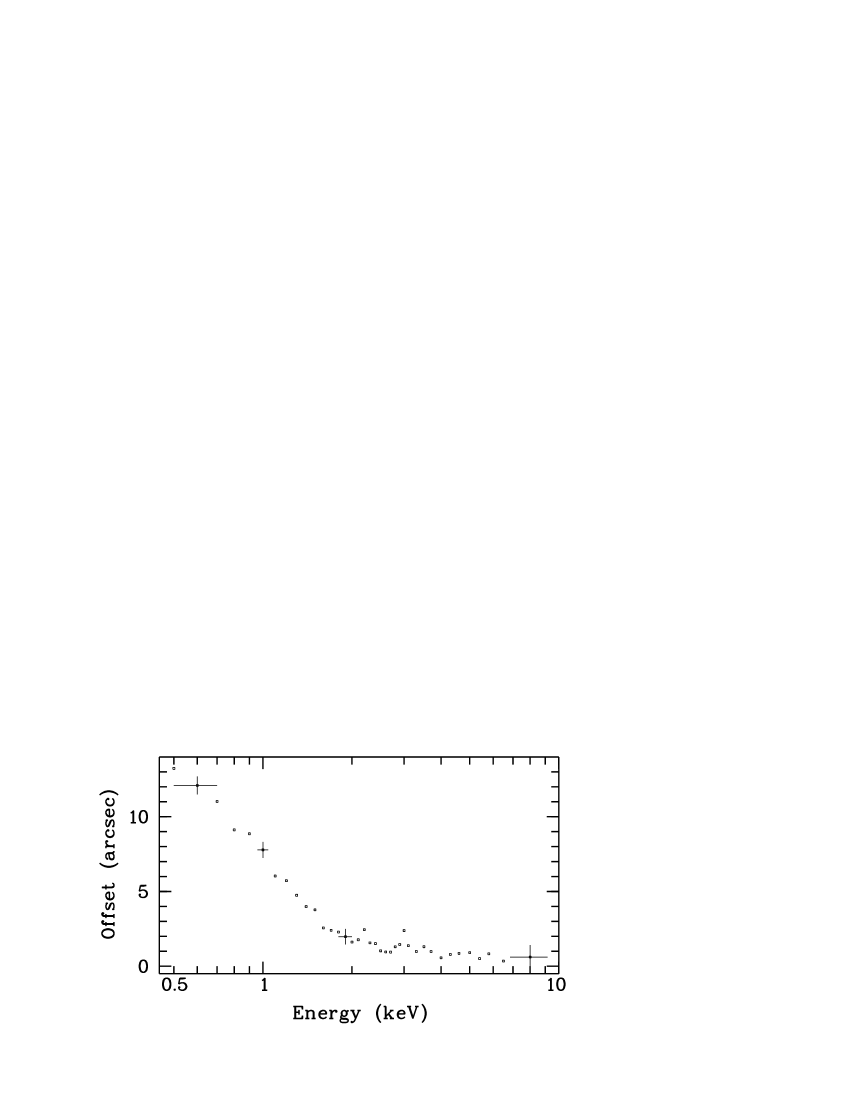
Below 0.5 keV, no significant emission from the unresolved nuclear source (X34) can be seen. As we go to higher energies, the centroid of the X34 emission shifts to the NW along the minor axis (Fig. 6) towards the position of the radio nucleus indicating that only at energies above 4 keV will emission from the nuclear starburst dominate the X-ray spectrum. It is apparent also in the inlay of Fig. 1, that harder (bluer) emission is shifted more to the NW where the black contours of the (2–10) keV emission are centered on the radio nucleus. The natural explanation is that X34 is an unresolved source of similar size to the shift reaching out from the starburst nucleus (i.e. the collection of sources and diffuse emission as seen with Chandra), that is increasingly absorbed towards the galaxy centre in the intervening inner disk of NGC~253.
Strickland et al. (str00 (2000)) report that the Chandra spectrum of the diffuse emission of the nuclear area (their NC) consists of a thermal plasma of temperature 0.66 keV, 4.7 cm-2 absorption plus emission in the (2–8) keV band dominated by point sources. The EPIC spectrum further characterizes the nuclear emission (Fig. 2) without spatially resolving the Chandra point sources. While the spectral resolution is not sufficient to resolve the lines seen by the RGS below 1 keV, lines from Mg xi, Mg xii, Si xiii, Si xiv Ar xvi, and Fe xxv are clearly detected and argue for gas components with temperatures up to 5 keV and above. We modeled the spectrum using thin thermal plasma components of solar abundance with corresponding absorption increasing with the temperature of the plasma component and added a power law component with the lowest absorption value. A model with three temperature components gave an acceptable fit ( = 1.05 for 222 d.o.f.) with = (0.34,1.78,13.2) cm-2, photon index of 1.0, and temperatures of (0.56, 0.92, 6.3) keV, respectively. A model with the same abundance in all three temperature components does not require the power law component and gives for an abundance of 0.7 solar an equally acceptable fit with very similar absorption values and temperatures. The low temperature component is in good agreement with the diffuse Chandra emission. Note that within the nuclear spectrum, no evidence for a significant AGN contribution is detected (which would require a highly absorbed non-thermal component) and the very hard component can therefore be attributed purely to the starburst nucleus. The column density of cm-2 is in good agreement with the predictions from other wavelengths (see discussion in Pietsch et al. pie00 (2000)).
The energy, intensity and equivalent width of the Fe K line are (6.670.05) keV, (7 photons cm-2s-1 and (930300) eV. Similar high-temperature plasma and Fe K lines have been found by XMM-Newton in young type Ib and type IIa SNRs, such as Cas A(age 300 yr) and N 132D (3000 yr) (e.g. Behar et al. beh01 (2001)). Assuming that type IIa SNRs are prevalent within the starburst nucleus of NGC~253, and assuming the Behar et al. Fe line flux observed in N 132D, we estimate that 1000 such SNRs are necessary to explain the Fe K line intensity from NGC~253. Furthermore, assuming that these SNRs are strong iron line emitters for 5000 yr, a supernova rate of 0.2 yr-1 is obtained, consistent with values estimated in other wavebands (e.g. Ulvestad & Antonucci ulv97 (1997); Rieke et al. rie88 (1988)).
Some contribution to the hard X-rays from unresolved absorbed X-ray binaries, a low luminosity AGN and/or extended diffuse emission is not required by the data, but cannot be excluded. If present, this would lower the above estimates.
4.2 X-ray plume emission
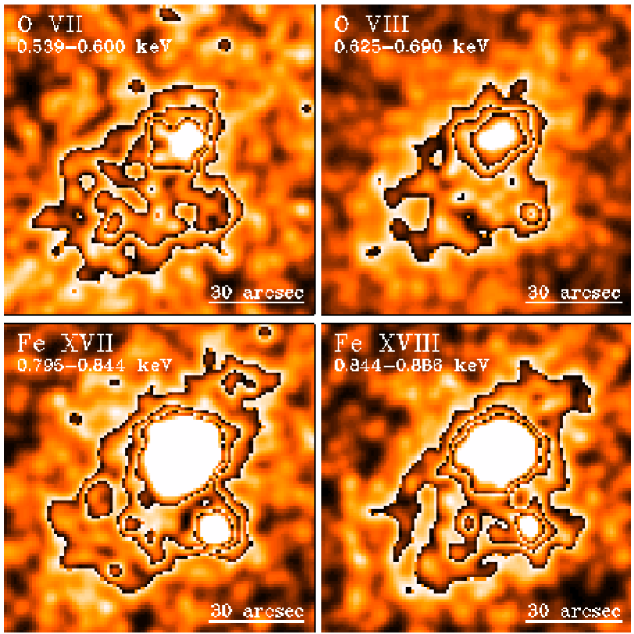
The EPIC images (Fig. 1) trace the bright X-ray plume emission of NGC~253 out to 175 (1300 pc projected distance) from the nucleus along the minor axis of the galaxy disk to the SE into the galaxy halo, much further than possible with earlier observations. To test the energy dependence of the emission we first selected images in broad energy bands. While the limb-brightened structure was not visible below 0.5 keV, it clearly showed up in the (0.5–0.9) keV band. We also tried, using EPIC PN images, to spatially localize the dominant emission regions for the different ionization state ions seen with the RGS. In both the oxygen and the iron case (see Fig. 7), while the low-ionization line image shows the south-eastern plume to be quite uniformly filled, the high-ionization line image shows definite limb-brightening, due to emission predominantly from a shell embedded in the more uniformly filled plume region in other energies. This clearly demonstrates the complexity of the emission processes involved and good spectral fits on spatially integrated spectra can not be expected. Nevertheless, we integrated a spectrum (Fig. 2) covering the region where Strickland et al. (str00 (2000)) derived an acceptable one temperature fit for Chandra (their CLB, k = 0.55 keV with absorption compatible to the Galactic foreground, using subsolar abundances). For EPIC PN, due to the broader energy response, the adding of two additional temperatures (k of [0.15, 0.53, 0.94] keV and absorption within NGC~253 of [0, 0, 1.3] cm-2, using solar abundance) gave an acceptable fit ( = 1.06 for 143 d.o.f.). The soft component resembles the lower temperature of the disk fits (see Sect. 3.2) and the harder components the two softer temperatures of the nuclear fit (see Sect. 4.1). The fact that the harder components seem to be less absorbed than in the nuclear spectrum, matches with the idea that in the plume we are seeing out-flowing plasma mass-loaded close to the starburst nucleus.
From the limb-brightened plume morphology seen by ROSAT and Chandra in overlays on H and in radial plots, Strickland et al. (str00 (2000)) come to the conclusion that “both the X-ray and H emission come from low volume filling factor gas, regions of interactions between a tenuous starburst-driven wind of SN-ejecta and the dense ISM, and not from the wind itself”. This explanation is in agreement with our results for the lines of higher ionization states. However, we observe more uniform morphology for lower ionization states and below 0.5 keV, which suggests that this emission is from a more uniformly distributed mass, shocked and “loaded” by the wind (e.g. Suchkov et al. suc96 (1996)). More detailed modeling will allow us to calculate mass loading factors by comparing the nuclear SNR rate with the mass seen in the plume.
Acknowledgements.
We thank the referee Guiseppina Fabbiano for her comments that helped to improve the manuscript considerably. The XMM-Newton project is supported by the Bundesministerium für Bildung und Forschung / Deutsches Zentrum für Luft- und Raumfahrt (BMBF/DLR), the Max-Planck Society and the Heidenhain-Stiftung.References
- (1) Behar, E., Rasmussen, A., Griffiths, R.G., et al. 2001, A&A, 365 (this issue)
- (2) Cappi, M., Persic, M., Bassani, L., et al. 1999, A&A, 350, 777
- (3) Ciliegi, P., Elvis, M., Wilkes, B.J., Boyle, B.J., McMahon, R.G. 1997, MNRAS, 284, 401
- (4) Dahlem, M., Weaver, K.A., Heckman, T.M. 1998, ApJS, 118, 401
- (5) den Herder, J.-W., Brinkman, A.C., Kahn, S.M., et al. 2001, A&A, 365 (this issue)
- (6) Fabbiano, G. 1988, ApJ, 330, 672
- (7) Fabbiano, G., Trinchieri, G. 1984, ApJ, 286, 491
- (8) Heckman, T.M., Armus, L., Miley, G.K. 1990, ApJS, 74, 833
- (9) Jansen, F., Lumb, D., Altieri, B., et al. 2001, A&A, 365 (this issue)
- (10) Makishima, K., Maejima, Y., Mitsuda, K., et al. 1986, ApJ, 308, 635
- (11) Makishima, K., Kubota, A., Mizuno, T., et al. 2000, ApJ, 535, 632
- (12) Norman, C.A., Ikeuchi, S. 1989, ApJ, 345, 372
- (13) Persic, M., Mariani, S., Cappi, M., et al. 1998, A&A, 339, L33
- (14) Pietsch, W., Vogler, A., Klein, U., Zinnecker, H. 2000, A&A, 360, 24
- (15) Ptak, A., Serlemitsos, P., Yaqoob, T., Mushotzky, R., Tsuru, T. 1997, AJ, 113, 1286
- (16) Read, A.M., Ponman, T.J., Strickland, D.K. 1997, MNRAS, 286, 626
- (17) Rieke, G.H., Lebofsky, M.J., Walker, C.E. 1988, ApJ, 325, 679
- (18) Strickland, D.K., Heckman, T.M., Weaver, K.A., Dahlem, M. 2000, AJ, accepted
- (19) Strüder, L., Briel, U.G., Dennerl, K., et al. 2001, A&A, 365 (this issue)
- (20) Suchkov, A.A., Berman, V.G., Heckman, T.M., Balsara, D.S. 1996, ApJ, 463, 528
- (21) Tanaka, Y., Shibazaki, N. 1996, ARA&A, 34, 607
- (22) Turner, M.J.L., Abbey, A., Arnaud, M., et al. 2001, A&A, 365 (this issue)
- (23) Ulvestad, J.S., Antonucci, R.R.J. 1997, ApJ, 488, 621
- (24) Vogler, A., Pietsch, W. 1999, A&A, 342, 101