Identification of a complete sample of northern ROSAT All-sky Survey X-ray sources
Abstract
In order to derive statistical properties of a complete X-ray selected sample of AGN we used the classification spectra of the RASS Selected Areas-North survey to study the luminosities, redshifts , X-ray/visual flux ratios, line widths, and various correlations between observed parameters of all Seyfert galaxies and QSOs in this sample. On the basis of these data we discuss implications for the current AGN models.
Key Words.:
Galaxies: active – Galaxies: Seyfert – Galaxies: quasars: general – X-rays: galaxies1 Introduction
In two earlier papers (Zickgraf et al. 1997a, Appenzeller et al. 1998, hereafter referred to as “Paper I” and “the Catalog”, respectively) we described and presented the optical identification of a complete sample of X-ray sources discovered in the ROSAT All-sky Survey (RASS, Voges et al. 1999). A statistical analysis of these identifications (which in the literature are also referred to as the “RASS Selected Area-North survey”) has been presented by Krautter et al. (1999). Subsamples of the Catalog have been discussed by by Zickgraf et al. (1998b), Mujica et al. (1999), and Appenzeller et al. (2000). The present paper presents a discussion of the Seyfert galaxies and QSOs listed in the Catalog as main optical counterparts of RASS X-ray sources with an Identification Quality Index or (i.e. reliable identification on the basis of our spectra and/or on the basis of reliable literature data). Since the Catalog lists no Seyfert galaxy and only one QSO with (“uncertain identification”) the present paper covers practically all objects of these types in our survey.
Not included in the following discussion are the BL Lac objects (which are discussed elsewhere), the two LINERs, and the 7 AGN for which due the weakness of the lines or inadequate no subclass could be assigned in the Catalog. Also omitted are 3 Seyfert galaxies and one QSO which - although inside the error circle of an X-ray position - were not regarded to be the main source of the observed X-ray radiation since another (in our opinion dominant or more likely optical counterpart was (also) present at the position in question.
As described in Paper I our identifications and classifications were based on low-resolution spectra obtained with a multi-object spectrometer at a 2.1-m telescope. These spectra were exposed to reach a suitable for a reliable classification and redshift derivation. Originally there were no plans for a quantitative evaluation of these spectra. However, after photometric calibration the great majority of the spectra turned out to be of sufficient quality to measure the basic properties of the AGN spectra, such as line strengths and line widths. Therefore, we made use of the opportunity provided by these data to derive statistical information on a well defined complete sample of X-ray selected AGN.
Throughout this paper Seyfert 1 galaxies and QSOs will be discussed jointly since - according to our classification criteria - these two classes are distinguished only by being below or above a certain (arbitrarily chosen) luminosity level. Included in this group are all AGN with permitted emission lines (or components of the permitted emission lines) measurably broader than the forbidden lines and/or showing Fe ii emission. Hence Seyfert 1.5-1.9 and NLS1 galaxies (as defined by Véron-Cetty and Véron, 2000, following Osterbrock and Pogge, 1985) are part of our Seyfert 1 and QSO sample. The (relatively few) Seyfert 2s in the Catalog are discussed separately in Section 3.
In order to keep the classification criteria uniform for the whole sample, the [O iii]5007Å/H flux ratio (which is measurable in only part of our spectra) was not used as a classification criterion to discriminate between Seyfert 1s and 2s (Osterbrock and Pogge, 1985, Laor, 2000). However, in all spectra containing the [O iii]/H region, the corresponding flux ratio was determined and compared to the critical value 3. While all galaxies classified as Seyfert 1s from their line profiles showed (as expected) [O iii]/H, we found (as described in Section 3) 6 objects classified as Seyfert 2s with [O iii]/H. Because of this small number the classification of these objects has no influence on the statistical conclusions derived for the Seyfert 1s and QSOs. However, as discussed in Section 3, the much smaller Seyfert 2 sample is affected if the [O iii]/H flux ratio is used as classification criterion.
Not discussed in the present paper are AGN number counts, distributions, and the implications of our data for the unresolved X-ray background, since the corresponding results have already been presented by Krautter et al. (1999) and Miyaji et al. (2000). Instead, the present paper will concentrate on conclusions concerning the AGN physics.
2 The QSOs and Seyfert 1 galaxies
2.1 General properties
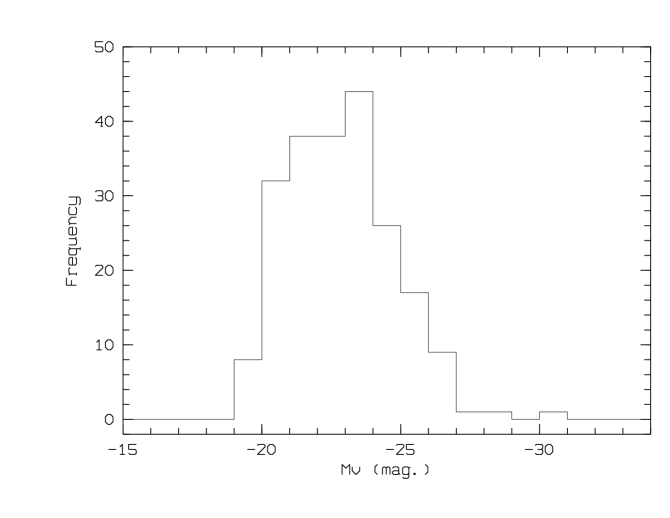
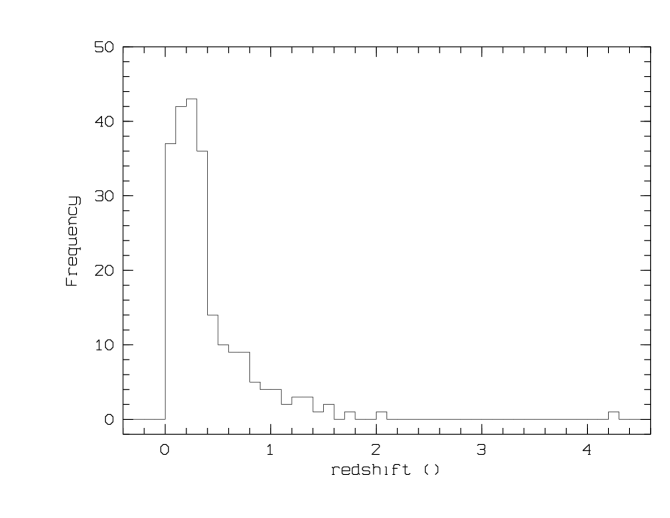
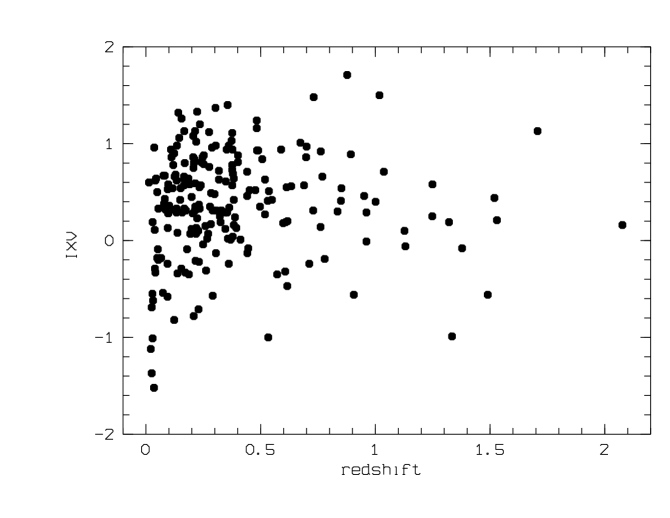
According to Krautter et al. (1999) 228 sources in our Catalog (about 34% of the total) were identified as Seyfert 1s or QSOs. Apart from stars (37%) these objects form the largest subgroup in our sample. In the Catalog we list the X-ray flux , the visual magnitude , the X-ray/visual index and the redshift . From these data we calculated approximate absolute visual magnitudes (assuming , = 0.5, = 0 and negligible interstellar extinction). The distribution of the resulting values is plotted in Fig. 1. The redshift distribution of our Seyfert 1s and QSOs is given in Fig. 2. As shown by the figures, our sample is dominated by moderate-luminosity objects () with an average redshift = 0.40. Only 8% of our Seyfert 1s and QSOs have redshifts 1.0. Only one QSO (RX J1028.6-0844, = 4.28, cf. Zickgraf et al., 1997b) has a redshift 2.2. The shape of the distributions in Figs. 1 and 2 indicate that our sample provides an essentially complete inventory for the local () AGN population while for higher redshifts only the progressively rarer objects with high (X-ray) luminosity are detected by the RASS.
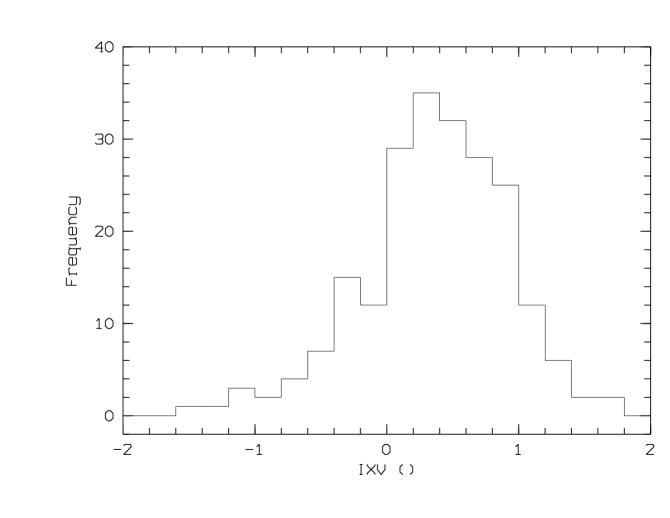
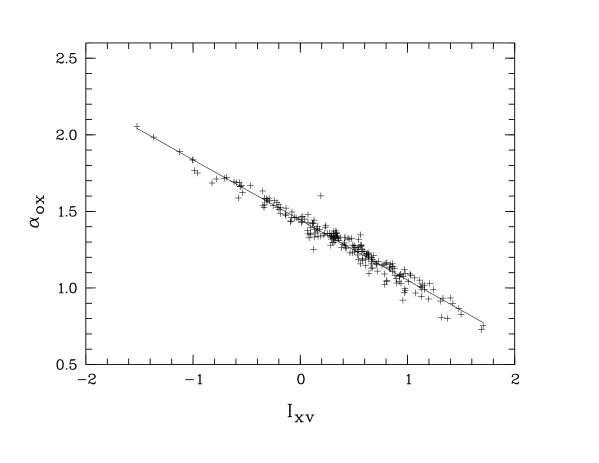
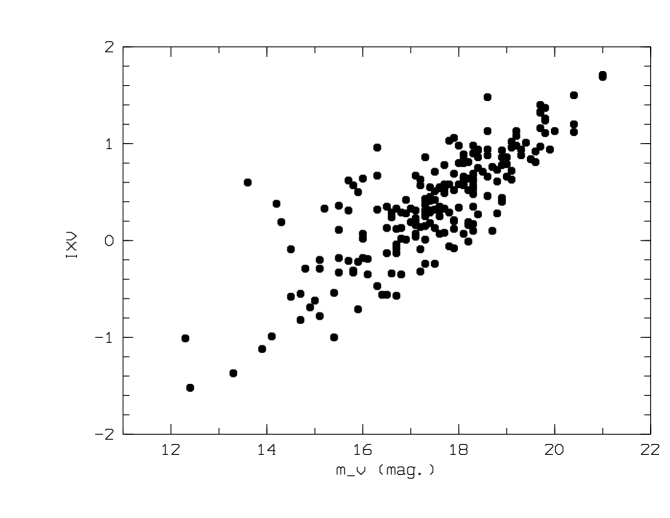
In Fig. 3 we present the distribution of the X-ray-visual index , which provides a measure for the relative strength of the X-ray and visual emission of an object. For AGN is approximately linearly related to the index, which is used for the same purpose in part of the literature (see e.g. Stocke et al. 1991). For our ROSAT data we have with good approximation . The accuracy this relation for our data can be estimated from Fig. 4. Our values are of the same order as those found in other AGN surveys (e.g. Stocke et al., 1991).
Since our sample is X-ray flux-limited, we have to expect a selection effect in the sense that apparently faint objects with low will not be included in our survey and only very high objects are observed at the faint end. As shown in Fig. 5, this selection effect is clearly present. However, as shown by Fig. 6, no such effect is conspicuous in our -redshift relation, since (apart from the very bright objects, which are all at small redshifts) there exists no strong correlation between redshift and apparent brightness in our sample. Therefore, the observed distribution is probably characteristic for the RASS AGN independent of the redshift. (The presence of 3 low-redshift objects with in Fig. 6 is probably caused by an overestimate of the luminosity of these relatively faint AGN due to a contamination of the photometry by their host galaxy light. Hence, these 3 values are probably lower limits only).
The characteristic property of Seyfert 1s and QSOs is the presence of broad (BLR) emission lines . While the instrumental resolution (corresponding to about 750 kms-1) did not allow us to resolve the forbidden line profiles, the BLR profiles were usually well resolved and intrinsic line widths 500 kms-1 could normally detected from the broadened profiles. In the Standard Model of AGN the widths of the BLR lines are assumed to be caused by the motions of the line emitting plasma in the potential of the central black hole. Since the distance of the BLRs to the central continuum source can (in principle) be estimated using reverberation techniques, the line widths and their distributions provide important information on the central masses and mass distributions. A direct comparison of all BLR line widths in our sample is complicated by the redshift range of our spectra. In order to allow a direct and unbiased comparison, we, therefore, had to restrict our analysis to a spectral region which is common to at least most of our spectra. Best suited for this purpose turned out to be the region of the H line.
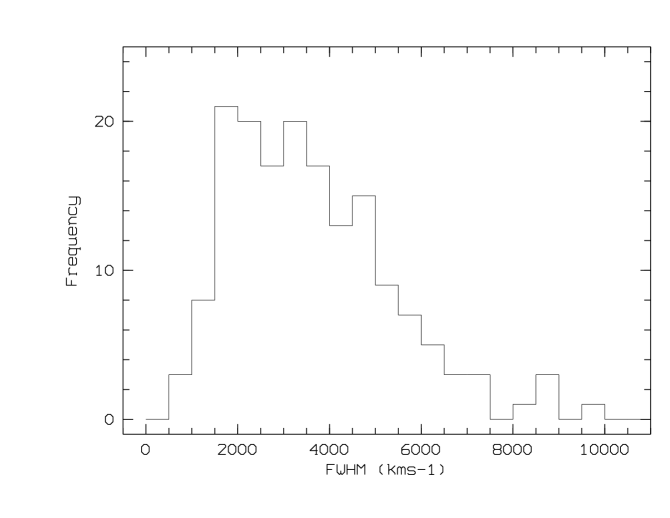
Depending on the position of the object in the field and the of the spectra this line falls into our observed spectral range for redshifts of about 0 0.8. For all objects in this range with spectra of of adequate we measured the FWHM and FWZI line widths of H. Since the quality of our spectra is not sufficient to allow a reliable decomposition of the profiles into various components, the FWHM measurements refer to the full line profiles, including broad and narrow components. (The FWZI widths measure the BLR components only, but, due to difficulties defining the continuum level, FWZI values are normally less reliable). The resulting FWHM distribution is plotted in Fig. 7. (The FWZI distribution is broader by about a factor of 2 but qualitatively similar).
The distribution in Fig. 7 shows a relatively large fraction (18% 3%) of objects with FWHM 2000 km-1. However, a comparison with the literature indicates that this fraction is not unusual for AGN. Stephens (1989) finds for a small () X-ray selected sample 24%. In the optically selected sample of Boroson and Green (1992) the corresponding fraction is 23% 5%, which agrees within the error limits well with our X-ray selected sample. If the 6 narrow-line objects with [O iii]/H mentioned above are added to our Seyfert 1 sample, our FWHM 2000 kms-1 fraction increases to 21% 3%, providing an even better agreement with Boroson and Green. The fact that Puchnarewicz et al. (1992) find in a sample of 17 Seyfert 1s with ultra-soft X-ray spectra 9 objects (53 %) with H FWHM 2000 kms-1 may indicate a relation with the X-ray spectral index. However, because of the limited X-ray spectral information for our objects (see below) this relation cannot be tested with our data. Most of the objects with FWHM 2000 km-1 also have BLR components with larger FWHM. Only three objects classified as Seyfert 1s in our Catalog are NLS1 galaxies without detectable Balmer line components of FWHM 2000 km-1, but with strong Fe ii emission. The presence of many objects with strong narrow Balmer components and weak broad components argues for a smooth transition between the NLS1s and other Seyfert types. (The fact that Engels and Keil (2000) in their analysis of a different sample of X-ray selected AGN find a higher fraction of NLS1s is probably due to different classification or selection criteria).
As shown by Fig. 7, the line widths cover a range exceeding a factor of 10. The broadest H line was observed for the object RX J1021.6-0327 = Akn 241 (FWHM = 9600 km-1, FWZI = 17 900 km-1). The spectrum of this object seems to show some other spectral peculiarities, which have to be studied with better and higher resolution, however.
According to the AGN Standard Model the line width distribution of the broad lines can be caused (a) by variations of the depth of the gravitational potential of the line forming region or (b) by variations of the orientation of the rotation axis relative to the line of sight to the observer. For disklike rotating emission regions with uniform velocities the theory predicts for (b) a distribution with a minimum at low velocities and a maximum and cutoff at the high velocity limit. The distribution in Fig. 7 is obviously very different, indicating that the line widths variations are probably dominated by intrinsic orbital velocity differences (i.e. variations of the potential) of the BLRs.
Except for the hydrogen and helium lines Fe ii multiplets are normally the most conspicuous emission features in the visual spectra of the Seyfert 1s and QSOs. Their strength is normally measured by the Fe ii index (flux ratio) = Fe 4570Å/H. Unfortunately our spectra were normally not of sufficient quality to measure the Fe ii 4570Å blend directly. On the other hand, for 63 objects it was possible to derive the total strength of the Fe ii (37,38) blends near 4570Å and the Fe ii (48,49) blend near 5300Å. Assuming that the relative strength of the Fe ii multiplets is constant, we converted these measurements to approximate values using the well observed (strong-Fe ii) Seyfert 1 galaxy I Zw I (Phillips 1977, Boroson and Green 1992) for calibration. As in other Seyfert 1 samples the great majority (80%) of our values fall into the interval 0.1 - 1.0. Our mean value 0.7 is somewhat higher than the normally quoted average for Seyfert 1s (0.4, Osterbrock 1977, Bergeron and Kunth, 1984), although this difference is not significant in view of our approximate method and and the size of our sample. Nevertheless, the fact that the average Fe ii emission is certainly not lower in our X-ray selected sample than in normal Seyfert 1 galaxies seems to argue against the result of Lawrence et al. 1997, who (on the basis of a smaller sample) find the Fe ii emission to be anticorrelated to the X-ray emission in Seyferts. As pointed out below, we also found no anticorrelation (or correlation) between and and for our sample.
One object in our sample (RX J0757.0+5832) shows (as already noted in the Catalog) exceptionally strong Fe ii emission ( 2.05).
2.2 Correlations
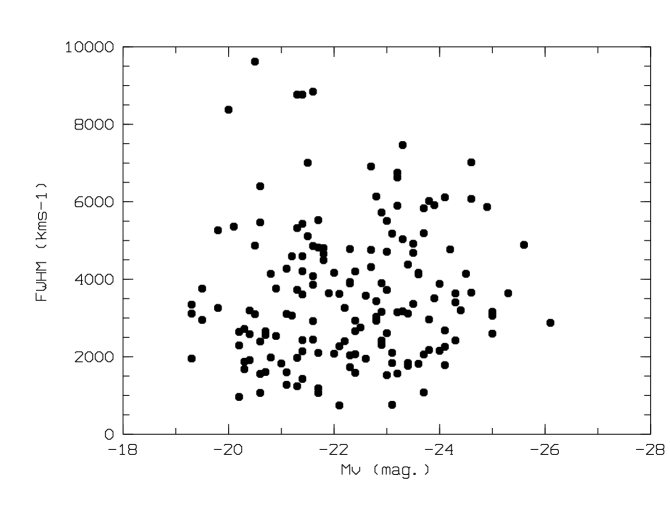
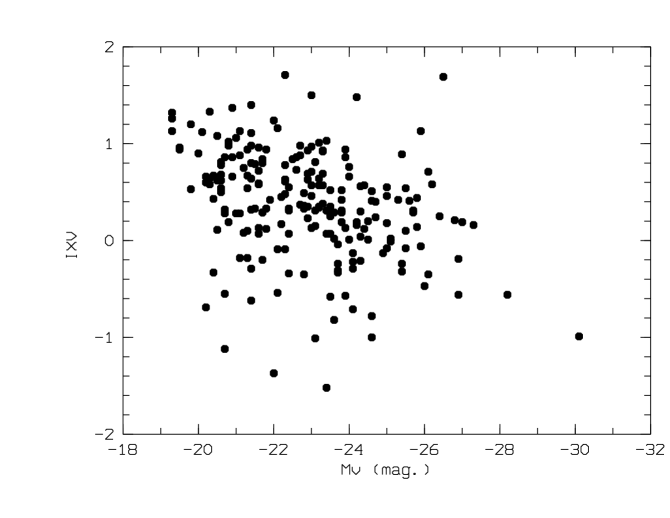
As pointed out e.g. by Dahari and De Robertis (1988) there are few strong correlations between different AGN properties. Hence it was no surprise that we found (apart from trivial relations, such as between FWHM and FWZI) few correlations in our data. In particular we find no significant correlation between the absolute visual brightness and the H line width, although such a correlation seems to be present in other AGN samples (e.g. Miller et al. 1992). Our Fig. 8, showing the observed relation, present essentially a random scatter apart from the fact that the few objects with H FWHM 8000 km-1 all have luminosities below , while the most luminous QSOs show moderate line widths. Within the Unified AGN Model this could perhaps be explained assuming that the high-FWHM objects are likely seen edge-on with the central light source partially obscured by a circumnuclear dust torus. However, in this case we may expect to find redder than average values and different values for the high line width objects. Since this is not observed, we conclude that the high line width of low-luminosity objects in Fig. 8 is probably not caused by an inclination effect.
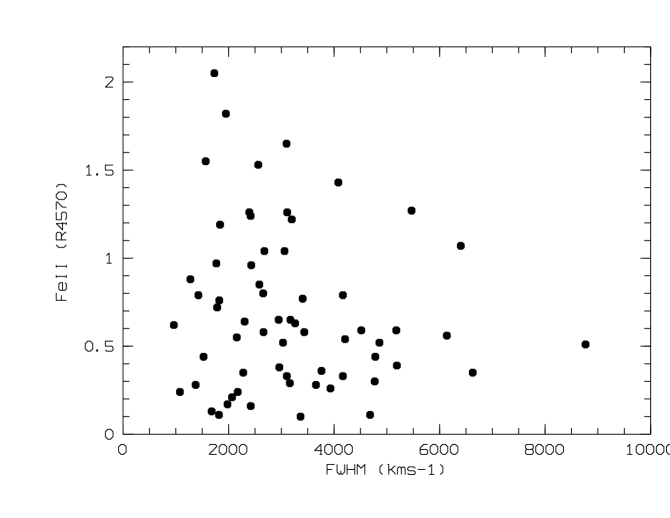
In Fig. 9 we plotted the Fe ii emission strength (expressed in ) as a function of the H FWHM line widths for all those objects where both these quantities could be measured. Our plot confirms the well known anticorrelation between Fe ii emission and BLR line widths for Seyfert 1s and QSOs (see e.g. Zheng and Keel 1991, Wang et al. 1996, Lawrence et al. 1997). On the other hand, in contrast to Lawrence et al. (1997), we found in our sample no indication of any correlation between the Fe ii emission strength and the X-ray loudness (as expressed by ).
As pointed out e.g. by Mushotzky et al. (1993), luminous AGN normally tend to show lower (or steeper ) values than low-luminosity objects. As shown in Fig. 10 this correlation is also indicated in our data. However, apart from the large scatter in our data, the relation derived here is probably affected (i.e. weakened) by the selection effect demonstrated in Fig. 4.
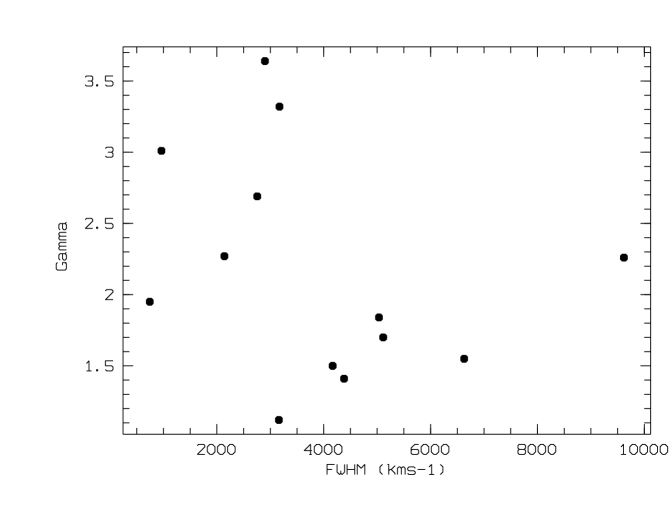
Boller et al. (1996), Laor et al. (1997) Grupe et al. (1999), and others pointed out a correlation between the ROSAT spectral index and the H line width for Seyfert galaxies and QSOs. Our relatively large sample of Seyfert galaxies with ROSAT X-ray data provide in principle a possibility to study this correlation. Therefore, we calculated the ROSAT photon index for all our objects. Unfortunately for most of our objects the photon counts turned out to be much too low to derive with an acceptable accuracy. For only 13 objects with good H data we were able to determine with a mean error 1.0. These data, plotted in Fig. 11, are consistent with the known anticorrelation between the BLR line widths and .
Most of our spectra are not of sufficient quality to detect the weak forbidden high ionization lines (FHILs) or “coronal” lines of the Seyfert spectra. In only 5 objects in our sample the [Fe x] lines were strong enough to be visible on our spectra. Interestingly, two of these 5 objects (RX J0707.2+6435 and RX J1218.4+2948) are also among the 3 objects with , supporting the existence of a correlation between and the FHIL strength, as proposed by Erkens et al. (1997).
3 The Seyfert 2 galaxies
While the Catalog lists 228 Seyfert 1s and QSOs, only 16 Seyfert 2s were identified as a primary optical counterpart of one of the observed X-ray sources. Moreover, our classification criteria for Seyfert 2s (Seyfert spectrum without detectable broad lines or line components and without detectable Fe ii emission) could have resulted in a contamination of the Seyfert 2 sample by Seyfert 1.5-1.9 and NLS1 objects with weak BLR components and weak Fe ii emission (since broad line components and weak Fe ii blends are more strongly affected by a low than narrow spectral features covering fewer pixels). Moreover, while (as pointed out in Section 1) the Seyfert 1 sample is practically unaffected by the definitions used, a Seyfert 1 classification based entirely on the [O iii]/H flux ratio may result in a different Seyfert 2 sample. In order to estimate these potential effects we re-inspected the spectra of all objects classified as Seyfert 2s in our Catalog and derived [O iii]/H flux ratios and approximate limits for the presence of undetected BLR components and Fe ii blends. In this process we found one case (RX J2218.6+0802) which definitely should have been classified differently. New measurements of the corresponding spectrum resulted in FWHM(H) = 1520 120 kms-1, FWHM([O iii]) = 878 200 kms-1 (both uncorrected for the instrumental profile) and [O iii]/H = 2.0. Obviously, this object should have been classified as a NLS1. Five additional objects do not show detectable BLR or Fe ii features but definitely [O iii]/H 3.0. In a classification based on the [O iii]/H ratio alone, these objects would also have to be classified as NLS1s. On the other hand, at least 7 of the objects listed in our Catalog as Seyfert 2s have [O iii]/H 3.0, Balmer BLR contributions 10% and Fe ii 0.2. Hence, we conclude that at least about 50% of the optical counterparts classified as Seyfert 2s in our Catalog are bona fide type 2 objects, independently of the exact classification criteria and a possible contamination with type 1 objects due to the inadequate of some of our spectra.
In view of the uncertainties and ambiguities of the Seyfert 2 sample, in the following all statistical results are listed separately for the full original sample of the Catalog (16 objects) followed [in brackets] by the corresponding value for the minimal sample of 7 reliable objects. Because of the small size of the samples, the discussion will be restricted to statistical means.
Compared to the Seyfert 1 and QSO sample the most obvious difference is the significantly lower mean luminosity (and correspondingly lower mean redshift) of the Seyfert 2s (reflecting also the scarcity of narrow line QSOs). The visual luminosities of our Seyfert 2s covered the range 18.1 22.8 [18.1 22.1] with a median value of , as compared to for the Seyfert 1 and QSO sample. Hence the observed Seyfert 2s have on average only about 1/10 of the visual luminosity of the observed Seyfert 1s and QSOs. The Seyfert 2 redshifts are all below 0.5 with an average of 0.18 [.22]. On the other hand, the distribution of the Seyfert 2s (median value is not significantly different from that of the Seyfert 1s and QSOs ().
For our flux limited sample the (visual and X-ray) Seyfert 2 to 1 luminosity ratio of 1/10 means that the volume in which we observe the Seyfert 2s is only about 3% of that of the Seyfert 1s and QSOs. Since the relative fraction of the Seyfert 2s in our Catalog ([3 %] to 7 %) is rather close to this number the Seyfert 2s detected in the RASS, although on average much fainter, are found to have about the same (or slightly larger) space density than the observed Seyfert 1s. Equal space densities of Seyfert 1s and Seyfert 2s have also been estimated for the general AGN population (Simkin et al., 1980, Véron and Véron-Cetty, 1986). In this respect our X-ray selected AGN obviously show the same behavior as the general AGN population.
4 Implications for the AGN models
As shown in Fig. 1 the luminosity distribution of the X-ray selected AGN has a FWHM of about 5 mag., corresponding to a factor 100. On the other hand Fig. 3 shows a FWHM of the X-ray/visual flux ratio of only a factor of 10. This seems to indicate that the basic physical conditions of the X-ray and visual continuum emitting volumes of the AGN are similar and are not strongly dependent on the luminosity. Moreover, the fact that the X-ray selected Seyfert 1s and 2s have similar mean values supports the assumption of a similar physical structure of all Seyfert nuclei and QSOs.
Assuming that the H FWZI corresponds to about twice the maximum orbital velocity of the BLR plasma, we obtain for our sample velocities of 1000 kms-1. If these values correspond to circular orbits in the potential of a black hole, the observed velocity range can be converted into a radial distance range for the BLRs of (where is the BH’s Schwarzschild radius). The observed particularly high BLR line widths for some low-luminosity Seyfert 1s and the absence of such high velocities for the more luminous QSOs (Fig. 8) could in this case be explained by the fact that the intense radiation field of the luminous QSOs prevents the existence of relatively cool Balmer line emitting BLR gas at low values, while at low luminosities the BLR gas can exist in a large range of distances. Less clear is the interpretation of the NLS1 in this scheme. (For a recent compilation of proposed explanations see Komossa and Janek, 2000). While the assumption of a low central mass being the origin of the absence of broad line components (Boller et al., 1999; Laor, 2000) seems plausible, other explanations cannot be ruled out on the basis of the present data.
Acknowledgements.
We thank Drs. Thomas Boller, Max Camenzind, Stefan Wagner and Ari Laor for critically reading the manuscript and for valuable comments.References
- (1) Appenzeller, I., Thiering, I., Zickgraf, F.-J., et al., 1968, ApJS 117, 319 (The Catalog)
- (2) Appenzeller, I., Kneer, R., Zickgraf, F.-J., Krautter, J., Thiering, I., 2000, in: From Extrasolar Planets to Cosmology, Proc. ESO VLT Opening Symposium, J. Bergeron and A. Renzini eds., Springer 2000, p. 164
- (3) Bergeron, J., Kunth, D., 1984, MNRAS 307, 263
- (4) Boller, T., Brandt, W.N., Fink, H., 1996, A&A 305, 53
- (5) Boroson, T.A., Green, R.F., 1992, ApJS 80, 109
- (6) Dahari, O., De Robertis, M.M., 1988, ApJS 67, 249
- (7) Engels, D., Keil, R., 2000, Proc. Bad Honnef Workshop on Narrow Line Seyfert 1 Galaxies 1999, New Astronomy Reviews 44, 2 (Issue 7-9, Electronic Supplement)
- (8) Erkens, U., Appenzeller, I., Wagner, S., 1997, A&A 323, 707
- (9) Grupe, D., Beuermann, K., Mannheim, K., Thomas, H., 1999, A&A 350, 805
- (10) Komossa, S., Janek, M., 2000, A&A (in press)
- (11) Krautter, J., Zickgraf, F.-J., Appenzeller, I., et al., 1999, A&A 350, 743
- (12) Laor, A., 2000, Proc. Bad Honnef Workshop on Narrow Line Seyfert 1 Galaxies 1999, New Astronomy Reviews (in press), astro-ph/0005144
- (13) Laor, A., Fiore, F., Elvis, M., Wilkes, B.J., McDowell, J.C., 1994, ApJ 435, 611
- (14) Lawrence, A., Elvis, M., Wilkes, B.J., McHardy, I., Brandt, N., 1997, MNRAS 285, 879
- (15) Miyaji, T., Hasinger, G., Schmidt, M., 2000, A&A (in press) (MPE preprint 478)
- (16) Miller, P., Rawlings, S., Saunders, R., Eales, S., 1992, MNRAS 254, 93
- (17) Mujica, R., Zickgraf, F.-J., Appenzeller, I., 1999, in “The BL Lac Phenomenon”, eds. L.O. Takalo, A. Sillanpää , ASP Conf. Ser. 159, 513
- (18) Mushotzky, R.F., Done, C., Pounds, K.A., 1993, ARA&A 31, 717
- (19) Phillips, S., 1977, ApJ 215, 746
- (20) Puchnarewicz, E.M., Mason, K.O., Córdova, F.A., et.al., 1992, MNRAS 256, 589
- (21) Osterbrock, D.E., 1977, ApJ 215, 733
- (22) Osterbrock, D.E., Pogge, R.W., 1985, ApJ 297, 166
- (23) Simkin, S.M., Su, H.J., Schwarz, M.P., 1980, ApJ 237, 404
- (24) Stephens, S.A., 1989, Astr.J. 97, 10
- (25) Stocke, J.T., Morris, S.L., Gioia, I.M., et al., 1991, ApJS 76, 813
- (26) Véron-Cetty, M.P., Véron, P., 2000, Astron. Astrophys. Rev. (in press) (OHP Prepr. 147)
- (27) Véron, P., Véron-Cetty, M.P., 1986, A&A 161, 145
- (28) Voges, W., Aschenbach, B., Boller, Th., et al. 1999, A&A 349, 389
- (29) Wang, T., Brinkmann, W., Bergeron, J., 1996, A&A 309, 81
- (30) Zheng, W., Keel, W.C., 1991, ApJ 382, 121
- (31) Zickgraf, F.-J., Thiering, I., Krautter, J., et al., 1997a, A&AS 123, 103 (Paper I)
- (32) Zickgraf, F.-J., Voges, W., Krautter, J., et al., 1997b, A&A 323, L21
- (33) Zickgraf, F.-J., Alcalá, M., Krautter, J., et al., 1998, A&A 339, 457