The Impact of Resolution on Observed H ii Region Properties from WFPC2 Observations of M101 ††thanks: (Based on observations with the NASA/ESA Hubble Space Telescope, obtained from the data Archive at the Space Telescope Science Institute, which is operated by the Association of Universities for Research in Astronomy, Inc., under NASA contract NAS 5-26555.)
Abstract
Two continuum subtracted HST frames of M101 are used to determine the positions, angular sizes and absolute fluxes of 237 H ii regions using a semi-automated technique. From these we have constructed the luminosity and diameter distribution functions.
We repeat this process on the images after artificially reducing the linear resolution to that typically obtained with ground based imaging. We find substantial differences in the luminosity function and diameter distribution. The measured internal properties, such as central surface brightness and radial gradient are dominated by the PSF at linear resolutions less than roughly 40 pc FWHM. From the ground such resolutions are currently only obtainable for the nearest galaxies.
Further support for the dominant role played by the seeing is provided by simple analytical models. We also study the clustering properties of H ii regions and their effect on the luminosity function by construction of a Minimal Spanning Tree (MST). We find evidence for two regimes of clustering of the H ii regions and diffuse emission. These intrinsic clustering properties in combination with the spatial resolution typically obtainable from ground based observations might be responsible for the break in the H ii region luminosity function which is usually found at erg/s, suggesting two different regimes of star formation in late type spiral galaxies.
From the high resolution HST data we find a luminosity function slope of . We also observe a flattening at luminosities erg/s. For the diameter distribution we find a characteristic scale of pc from an exponential fit. However, a scale free power law with index provides a better fit to the data.
Key Words.:
H ii regions – Galaxies: individual: M101 – Galaxies: spiral1 Introduction
As tracers of recent massive star formation, H ii regions are indispensable. The radiation emitted by the hot gas carries the signature of the young hot stars to which it gave birth. Complementing the detailed spectroscopic work that has been done, are studies on the statistical properties of H ii regions. These global investigations are aimed at gaining an understanding of the connection between the large scale dynamics and the star formation properties of galaxies (e.g. interactions and mergers, bars and spirals, resonances and rings). Most of this work has focused on the luminosity and diameter distribution of the regions imaged over full galactic disks in the line of .
A long standing difficulty with making such measurements has been in the identification of the regions. At low resolutions the blending together of regions can be significant. An initial estimate of this effect was made by Kennicutt et al. (ken89 (1989)), who found that blending effects became important at linear resolutions less than 300 pc. However, at the luminosity limits now obtainable with modern CCDs, a study of resolution effects has not been made.
For the diameter distribution of H ii regions Van den Bergh (van81 (1981)) found the functional form of an exponential law. Hodge (hod87 (1987)) confirmed this form for a sample of spiral galaxies and derived a dependence of characteristic size on absolute magnitude of the galaxy. A wide range of of between 45 and 560 pc was observed for the different galaxies. Nevertheless, in other studies a power law form fit the diameter distribution better than the exponential function (Kennicutt & Hodge ken80 (1980), Elmegreen & Salzer elm99 (1999)). Likewise, Knapen (kna98 (1998)) found a value of for M100 that is 1.5 to 2.2 times smaller than found in previous determinations at lower resolutions. The reliability of available diameter measurements is highly questionable.
A systematic study of the luminosity function (LF) of the H ii regions in disk galaxies was carried out by Kennicutt et al. (ken89 (1989)), using a sample of 30 spiral and irregular galaxies. They found the LF could be represented by a power law with index . A flattening at luminosities below erg/s was found and explained in terms of a transition from single ionizing stars to ionizing stellar clusters (McKee & Williams McK97 (1997) and Oey & Clarke oey98 (1998)). The LF slope was also found to be systematically steeper for earlier Hubble types and the properties of regions in spiral arms differed to those between arms. Theoretical explanations for these variations were given by Oey & Clarke (oey98 (1998)), who showed that evolutionary effects and maximum number of ionizing stars per cluster can account for such differences. Some galaxies also exhibited a break in the LF at about erg/s with a steeper slope at the high luminosity end.
Other surveys were carried out by Banfi et al. (ban93 (1993)) with a sample of 22 spirals located mainly in the virgo cluster and by Delgado & Perez (del97 (1997)) with 27 spiral galaxies. In the later survey 25% of objects were identified as having double slope LFs. More detailed studies have also been performed on single objects. Scowen et al.(sco92 (1992)) have studied M101 and found an index of for a power law fit to the LF. Rand (ran92 (1992)) examined M51, Walterbos & Braun (wal92 (1992)) M31 and Wyder et al. (wyd97 (1997)) M33. Also an example of a barred galaxy, NGC 7479, was studied by Rozas et al. (roz99 (1999)), where evidence for a difference in the properties of the regions located in the bar from that of the overall disk were found.
Studies of the emission in grand design spirals were carried out by Cepa & Beckman (cep89 (1989), cep90 (1990)), Knapen et al. (kna93 (1993)) and continued in a series of four grand design spirals by Rozas et al. (1996a , 1996b , roz98 (1998)). The LFs in all four cases showed a clear slope transition at erg/s accompanied by a local maximum or “glitch”. In addition to the LF break, they also found a break at the same luminosity in the surface brightness gradient of the H ii regions. The gradients of less luminous regions were about constant, whereas the gradients of more luminous regions were steeper and growing with luminosity. Yet another break has been reported at this luminosity in the central surface brightness (Beckman, priv. comm.). These features have been interpreted by Beckman et al. (bec98 (1998)) as representing a physical change in the H ii regions at this characteristic luminosity. Specifically, they contend that a transition from ionization to density bounding occurs at erg/s. They have also proposed the use of this feature as a standard candle.
Related studies of the diffuse ionized interstellar medium (DIG) have been carried out by Walterbos & Braun (wal94 (1994)), Ferguson et al. (fer96 (1996)) and Greenawalt et al. (gre97 (1997)). The diffuse emission was found to be spatially associated with the H ii regions and exhibited a variety of different morphologies. The fraction of emission coming from this diffuse component was estimated at 20–50% (Ferguson et al. fer96 (1996)). Leaking photons from H ii regions, turbulent mixing and shock ionization have been suggested as possible ionization mechanisms.
This paper presents statistics on the H ii regions in M101 from HST observations. The very high resolution of the images will allow us to investigate in detail the role played by resolution. We will find that the linear resolution required to perform reliable measurements of central surface brightness, radial gradients, and diameters is quite stringent and can be accomplished from the ground without the aid of adaptive optics for only the nearest galaxies. The effects of blending on the luminosity function will also be found to be significant, with the diffuse emission making an important contribution.
Also examined is the intrinsic clustering characteristics of the regions and diffuse emission and the role this plays in shaping the behavior of the blending. Evidence for a possible break at a characteristic clustering regime will be presented, which when combined with blending effects may provide a mechanism for producing the LF discontinuity along with it’s relative stability in luminosity.
In Sec. 2 of this paper we present the data and reduction methods. A description of the methods used to measure the properties of the H ii regions is given in Sec. 3. The results and comparisons to some simple analytic models are then given in Sec. 4, followed in Sec. 5 by a discussion of their implications.
2 Observations
The galaxy studied here is the nearby grand design Sc galaxy M101. It was chosen because it is nearly face on and lies at the relatively close distance of about 7.4 Mpc (Kelson et al. kel96 (1996)). These properties limit problems due to projection effects and provide for very high linear spatial resolution.
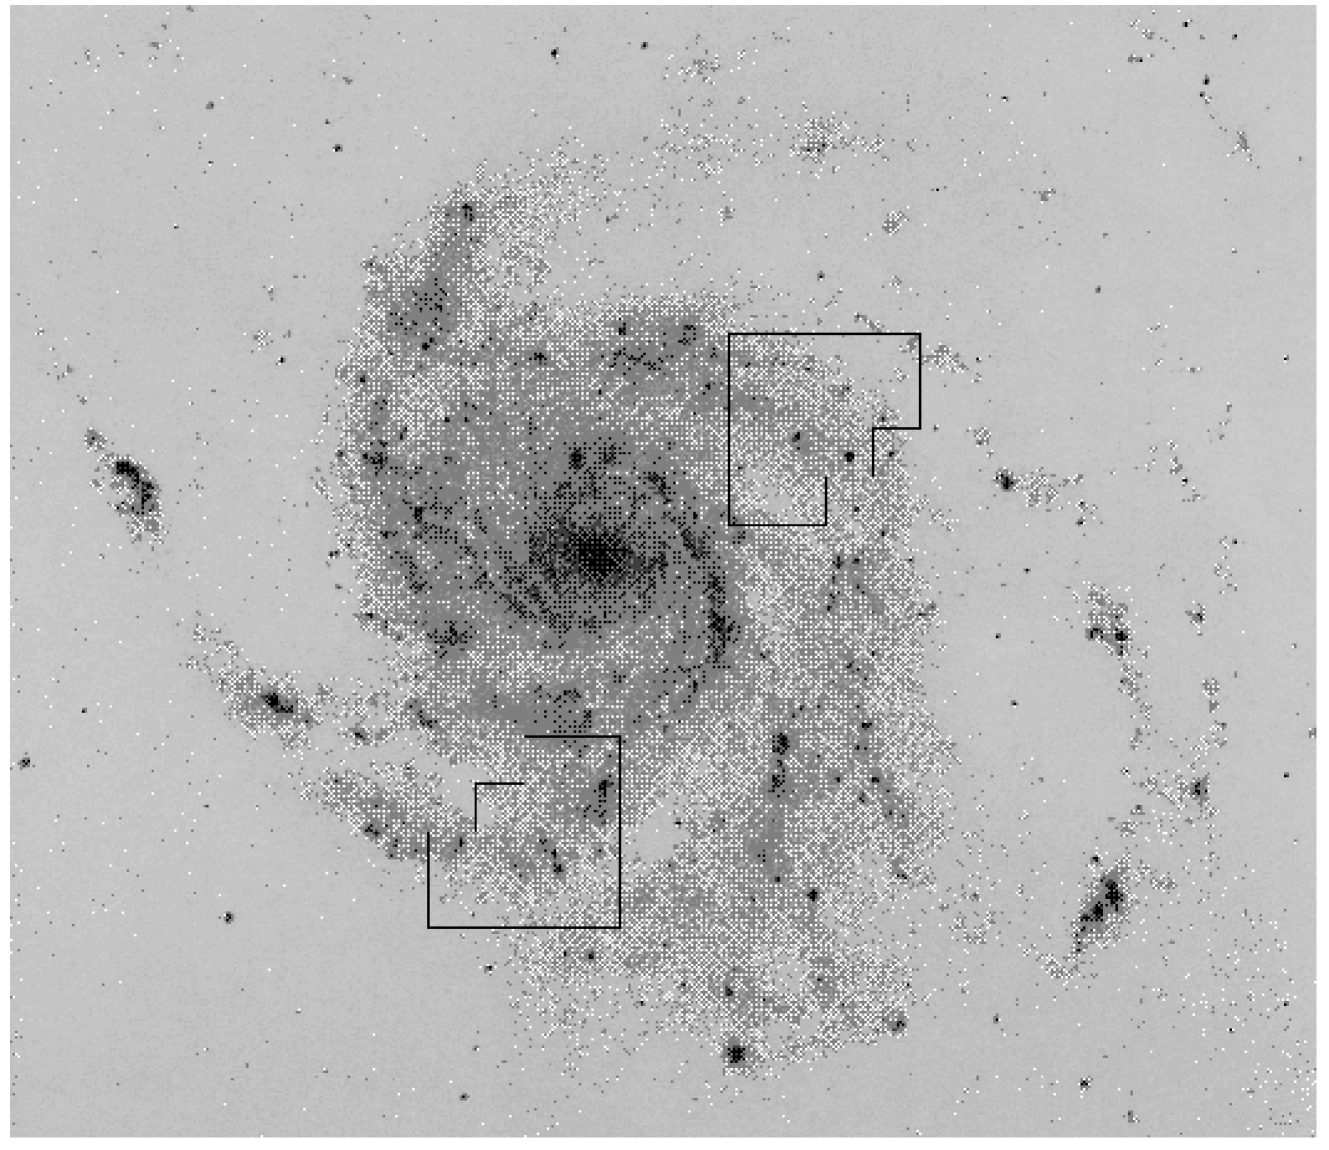
The observations of M101 were obtained with the HST-WFPC2 on the 15th and 16th of September 1994 and on April 4th 1996. Both frames are public and have been retrieved from the HST-archive. Fig. 1 shows their approximate location in the outer spiral arms. The ground based image was taken by Sandage (san61 (1961)) in blue light (3300–5000 Å) at Mt. Palomar.
The pixel size is for the WF-Chips and defines the effective resolution, i.e. the PSF FWHM is smaller. The (F656N non-shifted) data consists of two sets of two exposures. The sets have combined exposure times of 4000 s and 3600 s. Continuum subtraction was carried out either with exposures taken with the wide R-Filter F675W ( s) or with the medium bandwidth V-Filter F547M ( s).
Besides the HST pipeline calibration, we used the data reduction package IRAF and especially the package STSDAS for further processing. Particular care was required to remove the cosmic rays through a multiple step process. All frames were normalized to a count flux of using the method described in Holtzman et al. (hol95 (1995)). Absolute fluxes were calculated using a distance of 7.4 Mpc.
The linear scale of the HST observations with a pixel scale of and distance of 7.4 Mpc is 3.6 pc/pixel. For comparison with typical ground based imaging conditions, we also generated a set of re-pixeled frames based on a distance of 20 Mpc and pixel scale of . This gives a linear scale of 27 pc/pixel and corresponds to a magnification factor of 7.5. The frames were further processed by convolving with a gaussian corresponding to a seeing of FWHM, leading to a resulting linear scale of 77.6 pc FWHM.
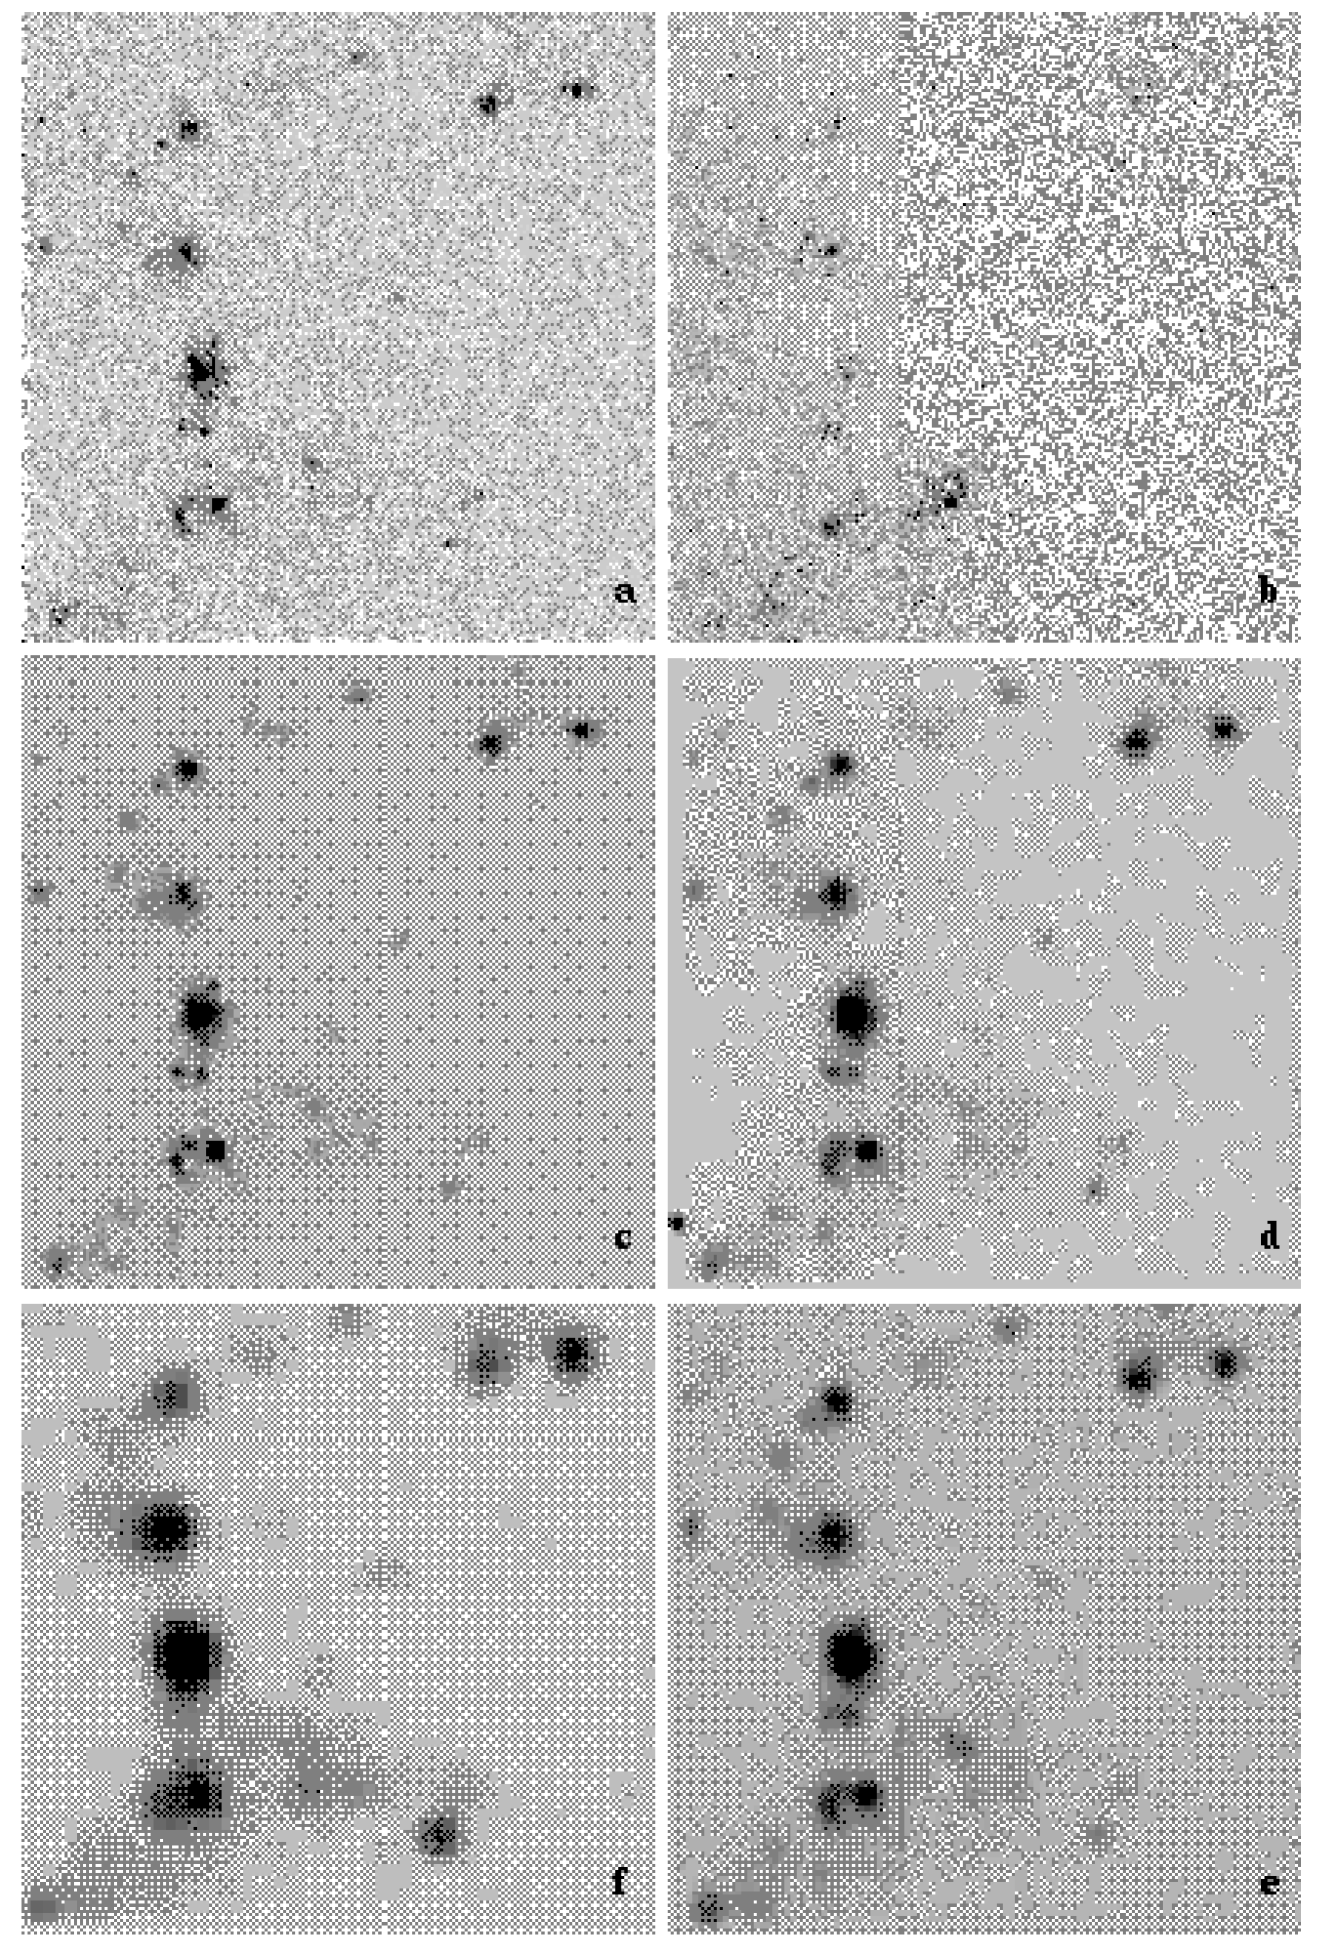
In Fig. 2 is an example of a high resolution and V-Band image, along with several additional frames which have been shifted to varying distances using the above ground based seeing conditions of FWHM. The top left and right panels correspond to the high resolution and V frames, respectively. The lower four panels correspond, in clockwise order, to distances of 10, 15, 20, and 35 Mpc and linear scales of 38.8 pc, 58.2 pc, 77.6 pc and 135.8 pc FWHM, respectively.
3 Methods
3.1 H ii-Region Definition, High Resolution
As the first selection criterion for H ii regions we adopt the requirement that they consist of at least nine contiguous pixels, each with an intensity of at least three times the r.m.s. noise level over the local background, which includes any contribution from local diffuse emission. With an overall r.m.s. of about 2 normalized counts, the minimum luminosity according to this definition is erg/s and the minimum diameter is 10.8 pc.
At high resolution many blobs of diffuse emission with various shapes can be seen which at lower resolution are no longer clearly discernable. These “false” regions must be discriminated from the “true” H ii regions. We therefore adopt a second criterion that every low surface brightness region with clearly unsymmetric morphology must have a central stellar counterpart in the V band. If in a multi-peaked complex we can detect more than one well separated ionizing star cluster, it is separated into multiple regions, otherwise the complex is treated as a single entity.
Small round high surface brightness regions without detectable ionizing star cluster are included in the HII region definition, because we could not exclude the possibility that a central cluster lies below our V band detection limit or is hidden by dust. This definition is more precise than the one of Rand (ran92 (1992)) and Rozas et al. (1996a ), who define every peak of emission as an H ii region. Regions that meet the first criterion, but fail the second one are marked as diffuse regions. Still, these account for only of the detected diffuse emission.
3.2 H ii Region Definition, Low Resolution
For the smeared frames we adopt the same first condition as in the high resolution case regarding size and flux. Therefore, with an overall r.m.s of about 15 normalized counts the minimum luminosity is erg/s and the minimum diameter 81 pc. This time we count every emission peak as an H ii region.
3.3 The REGION Software
To find the statistical properties of the H ii regions we use the REGION software package (Rozas et al. roz99 (1999); Heller et al. hel99 (1999)). This semi-automated technique identifies the H ii regions, determines their position, and measures their area and flux, corrected for the local background. Further processing can be applied manually: deleting, adding, separating, and the combining and rounding of regions that do not meet our definition.
We find 237 and 162 H ii regions, respectively, in the high and low (smeared) resolution frames.
4 Results
4.1 Overall Smearing Effects
A first impression of the effect of resolution can be obtained from Fig. 2, where differences between the high resolution frames and the smeared ones in terms of the H ii region sizes and morphologies are clearly visible.
A first quantitative approach is taken by tabulating the effects that the smearing has on the identified population:
-
1.
An H ii region and diffuse emission are smeared together to form a more luminous region (31%).
-
2.
More than one H ii region and diffuse emission are smeared together to form a more luminous region (28%).
-
3.
Diffuse emission is reshaped by the smearing and detected as an H ii region (41%).
-
4.
Small H ii regions disappear in the noise.
The percentages refer to the number of identified regions in the smeared images. It should be noted that more than 2/3 of the regions in the smeared case actually consist of either multiple regions blended together or are not genuine H ii regions, in that they lack an internal ionizing source.
We also observed in the high resolution frames a class of compact high surface brightness regions which show a very high degree of symmetry. They are often found close to a large irregular region or complex. Because of their distinct morphologies these were considered true H ii regions in the count, even if an internal ionizing source was not observed.
4.2 Diameter Distribution
The integral diameter distribution shown in Fig. 3

demonstrates the clear difference between the resolved and smeared frames. The top panel shows the smeared case, the middle panel the smeared case excluding those regions which are dominated () by diffuse emission, and the bottom panel the resolved case. Whereas the resolved regions show a size distribution from about 10 pc to 220 pc, the range in the smeared case includes regions from roughly 150 pc to greater than 400 pc. Parameters determined by fitting to the exponential form,
| (1) |
(Van den Bergh van81 (1981)) are given in Table 1.
| Data | D0 [pc] | N0 | |
|---|---|---|---|
| a | low resolution | 64.8 | 1285 |
| b | low resolution corrected | 70.0 | 687 |
| c | high resolution | 29.2 | 318 |
A plateau-like structure is seen in the resolved distribution at the high luminosity end. In the high resolution study of Wyder et al. (wyd97 (1997)) a similar distribution is found for M33, as well as a similar range of diameters. However, no obvious corresponding feature is seen in the plot of vs. given in Fig. 4.

The resolved and smeared data can be fit by a power law with indices of 0.39 and 0.25, respectively. Substituting this relationship into the power law luminosity function of Sec. 4.3 gives a power law diameter distribution with an expected index of . An earlier usage of this functional form for the diameter distribution can be found in Kennicutt & Hodge (ken80 (1980)). Fig. 4 demonstrates that the two distributions only approach each other at rather high luminosities, indicating that the measured diameters of regions of all but the highest luminosities are significantly modified at ground based resolutions.
In Fig. 5

we show the corresponding differential diameter distribution along with a power law fit of the form,
| (2) |
with index . The resolved data are clearly better represented by the power law than by the exponential form. This is in contrast to the lower resolution data, where the exponential is a better representation. Therefore resolution effects do not only dramatically change the characteristic diameter , but can affect the apparent functional form of the distribution as well.
4.3 Luminosity Function
The combined luminosity function (LF) for the full set of resolved frames is given in Fig. 6c.

It displays the characteristic power law form along with a flattening at lower luminosities. The flattening may be explained as due to a transition from ionizing stellar clusters to single ionizing stars (Kennicutt et al. ken89 (1989)). It should be noted that due to completness effects most ground based studies find a turn-over instead of a flattening.
If we include the diffuse regions in the LF, we obtain a turnover at lower luminosities rather than a flattening although the power law index changes little. In particular, since there are no diffuse regions with erg/s, the high luminosity part remains unaffected.
| LF | Slope | log Lmin | Regions | |
|---|---|---|---|---|
| a | low resolution | -1.7 | 37.2 | 128 |
| b | low resolution corrected | -1.6 | 37.3 | 67 |
| c | high resolution | -1.74 | 36.8 | 150 |
The LF is consistent with a single slope with exponent in the luminosity range to 39.3 erg/s.
The corresponding LF for the smeared frames are given in Fig. 6a and b. Unlike the resolved frames, the LF for the smeared frames may be fit consistently with either a single or double slope. Unfortunately, the lack of better statistics does not allow us to make a clear determination of whether a break in the LF does actually occur in this case. However two effects can be clearly distinguished: a decrease in the number of regions in the lower luminosity bins and an increase of regions in the intermediate luminosity range. This trend becomes even clearer when regions dominated by diffuse emission (80% in ) are excluded.
The presence of these two resolution effects is more clearly demonstrated in Fig. 7,

where we plot the ratio of the number of regions in the smeared to resolved case for a given luminosity bin. In this way one can easily see where there is an excess or deficit of regions as compared to the resolved numbers. The figure shows a deficit at and an excess between and 38.6, which peaks at . At higher luminosities the resolved and smeared LFs appear to converge, at least within the statistical uncertainties.
These differences, combined with the additional effects discussed in Sec. 4.1, provide a picture of what happens as the resolution is degraded. In general, regions are combined with diffuse emission and other regions, shifting them to higher luminosities. While this process has been discussed by other authors, the degree to which this occurs at typical ground based resolutions has not been fully appreciated.
Furthermore, we propose that a break or significant reduction in this process occurs at luminosities above erg/s. This point is demonstrated in Fig. 8

where we have plotted the luminosity of regions identified in the smeared case against their brightest member as measured from the high resolution frames. Many regions are shifted towards a limit of erg/s due to blending with other regions and diffuse emission. This mechanism may account for a break in the LF often observed around this limiting luminosity.
4.4 Radial Profiles
At high resolution the radial profiles typically display a core-wing structure. The profiles in the smeared case appear gaussian, with some core-wing structure in the brightest regions.
4.5 Surface Brightness Gradient
To compare the surface brightness gradients of the resolved regions with earlier observations (Rozas et al. roz98 (1998)), we need to determine a single gradient based on the profile. We decided to fit a single gaussian to the core/wing profile and define the gradient as the slope at the half maximum radius.
We adopt the same definition for the smeared regions, where it is even more appropriate. We also tried fitting a linear function and found that the difference compared with the gaussian is about 20%, which is much less than the intrinsic dispersion.
The surface brightness gradients of the resolved regions are shown in Fig. 9.

In contrast to the ground based work this distribution does not show a bilinear structure with a break at erg/s. Rather it exhibits a constant upper limit at all luminosities with a lot of scatter toward steeper gradients. No other clear relation is visible.
However, the number of regions with luminosities greater than where the break would be is small, making the identification of a possible break difficult. Because of this we bolster our position with a simple analytic model of the effect of resolution on the gradients. The model consists of 2-dimensional convolution between two gaussians, one representing a resolved profile , the other the point-spread function (PSF) of the effective resolution or seeing,
| (4) | |||||
The surface brightness gradients are then given by,
| (5) | |||||
| (6) |
A reasonable assumption for the model is to take the value for the gradient in the resolved case, , as a constant defined by the upper band of points in Fig. 9. Solving for in Eq. 5 gives,
| (7) |
Substituting this into the smeared profile, Eq. 6, we obtain the luminosity dependent expression,
| (8) |
We adopt a model resolution based on good ground seeing conditions of and a distance of Mpc, giving a value of pc. To find the constant , we fit the relation between measured and luminosity, obtaining a value of .
The results of these calculations are plotted in Fig. 10,

together with the measured gradients for both resolutions. While the statistics are lacking, the overall trend of the gradients in the smeared case follows that found by Rozas et al. (roz98 (1998)). They argue that this is evidence for a transition in the physical properties of the H ii regions. However, the simple model shows that the gradients measured in the smeared frames are in fact completely dominated by the effective seeing at the lower luminosities and do not represent the intrinsic properties of the clouds. The break in the gradients which is seen in lower resolution observations marks the zone of transition where the size of the regions is of the same order as the effective seeing gaussian. The fact that the measured gradients lie above the theoretical curve is likely due to the neglect of the contribution from diffuse emission and blending in our simple model.
In Fig. 11

we plot various model curves representing the resolution effects on the measured surface brightness gradients for different distances at a seeing FWHM of . For the given range of luminosities, all galaxies at distances larger than about 10 Mpc display seeing dominated radial profiles, corresponding to a linear resolution (FWHM) of around 40 pc.
4.6 Central Surface Brightness
In this section we consider the central surface brightness of the H ii regions. Beckman et al. (priv. comm.) find that for regions below , is proportional to , while for regions above this value the central surface brightness rises more steeply and shows a larger scatter.
For a theoretical treatment similar to what we have done with the gradients, a more reliable estimate of the core profile is required. If we use our previous fits to the entire region we would greatly underestimate the central brightness. Therefore we determine from a gaussian profile that is fit only to the core area of each region in both the resolved and smeared frames.
The core profile may be defined as
| (9) |
Next we convolve this core profile with the seeing gaussian as defined in Sec. 4.5,
| (10) | |||||
Substituting the approximate relationship
| (11) |
| (12) |
and
| (13) |
As determined from the resolved data, we take a value for of .
The results of the calculations are plotted against in Fig. 12,

together with the data for both resolutions.
The two datasets exhibit large differences. The smeared data show a nearly constant behavior with little scatter up to , beyond which rises more steeply and shows larger scatter. This behavior closely matches that of ground based data (Beckman, priv. comm.). In contrast, the resolved data exhibit a larger scatter at all luminosities.
Considering the rough approximations used in deriving the theoretical relationship for the smeared regions, the fit to the smeared data is remarkably good. The correspondence could be further improved if the effects of blending and diffuse emission were taken into account.
This simple model provides a reasonable description of the characteristics of the central surface brightness in the lower resolution ground based observations. It demonstrates that resolution effects are important not only for measurements of gradients, but also for the determination of central surface brightness.
In Fig. 13

we plot various model curves representing the resolution effects on the measured central surface brightness for different distances at a seeing FWHM of . Again we find that for galaxies at distances greater than about 10 Mpc the central surface brightness is dominated by the seeing. This corresponds also to a linear scale of about 40 pc (FWHM).
4.7 Minimal Spanning Tree
In order to investigate the clustering properties of the regions we compute a Minimal Spanning Tree (MST) based on the spatial locations of the H ii and diffuse regions (Sec. 3.2). The MST for any given set of points consists of a unique set of edges connecting the points, such that the sum of the edge-lengths is a minimum. The MST provides a reproducible and unbiased graph that contains information on the intrinsic linear associations in the point set. For the analysis of linear features the MST has been found to be superior to other methods, such as the two point correlation function (Barrow et al. bar85 (1985)).
We have chosen to include the diffuse regions in the analysis because they are a good tracer of the spatial distribution of the diffuse emission in general, even though they represent only 8% of the total diffuse flux. A graphical depiction of the region spatial distribution and the corresponding MST are shown in Fig. 14 for the two different WFPC2 fields in the galaxy.
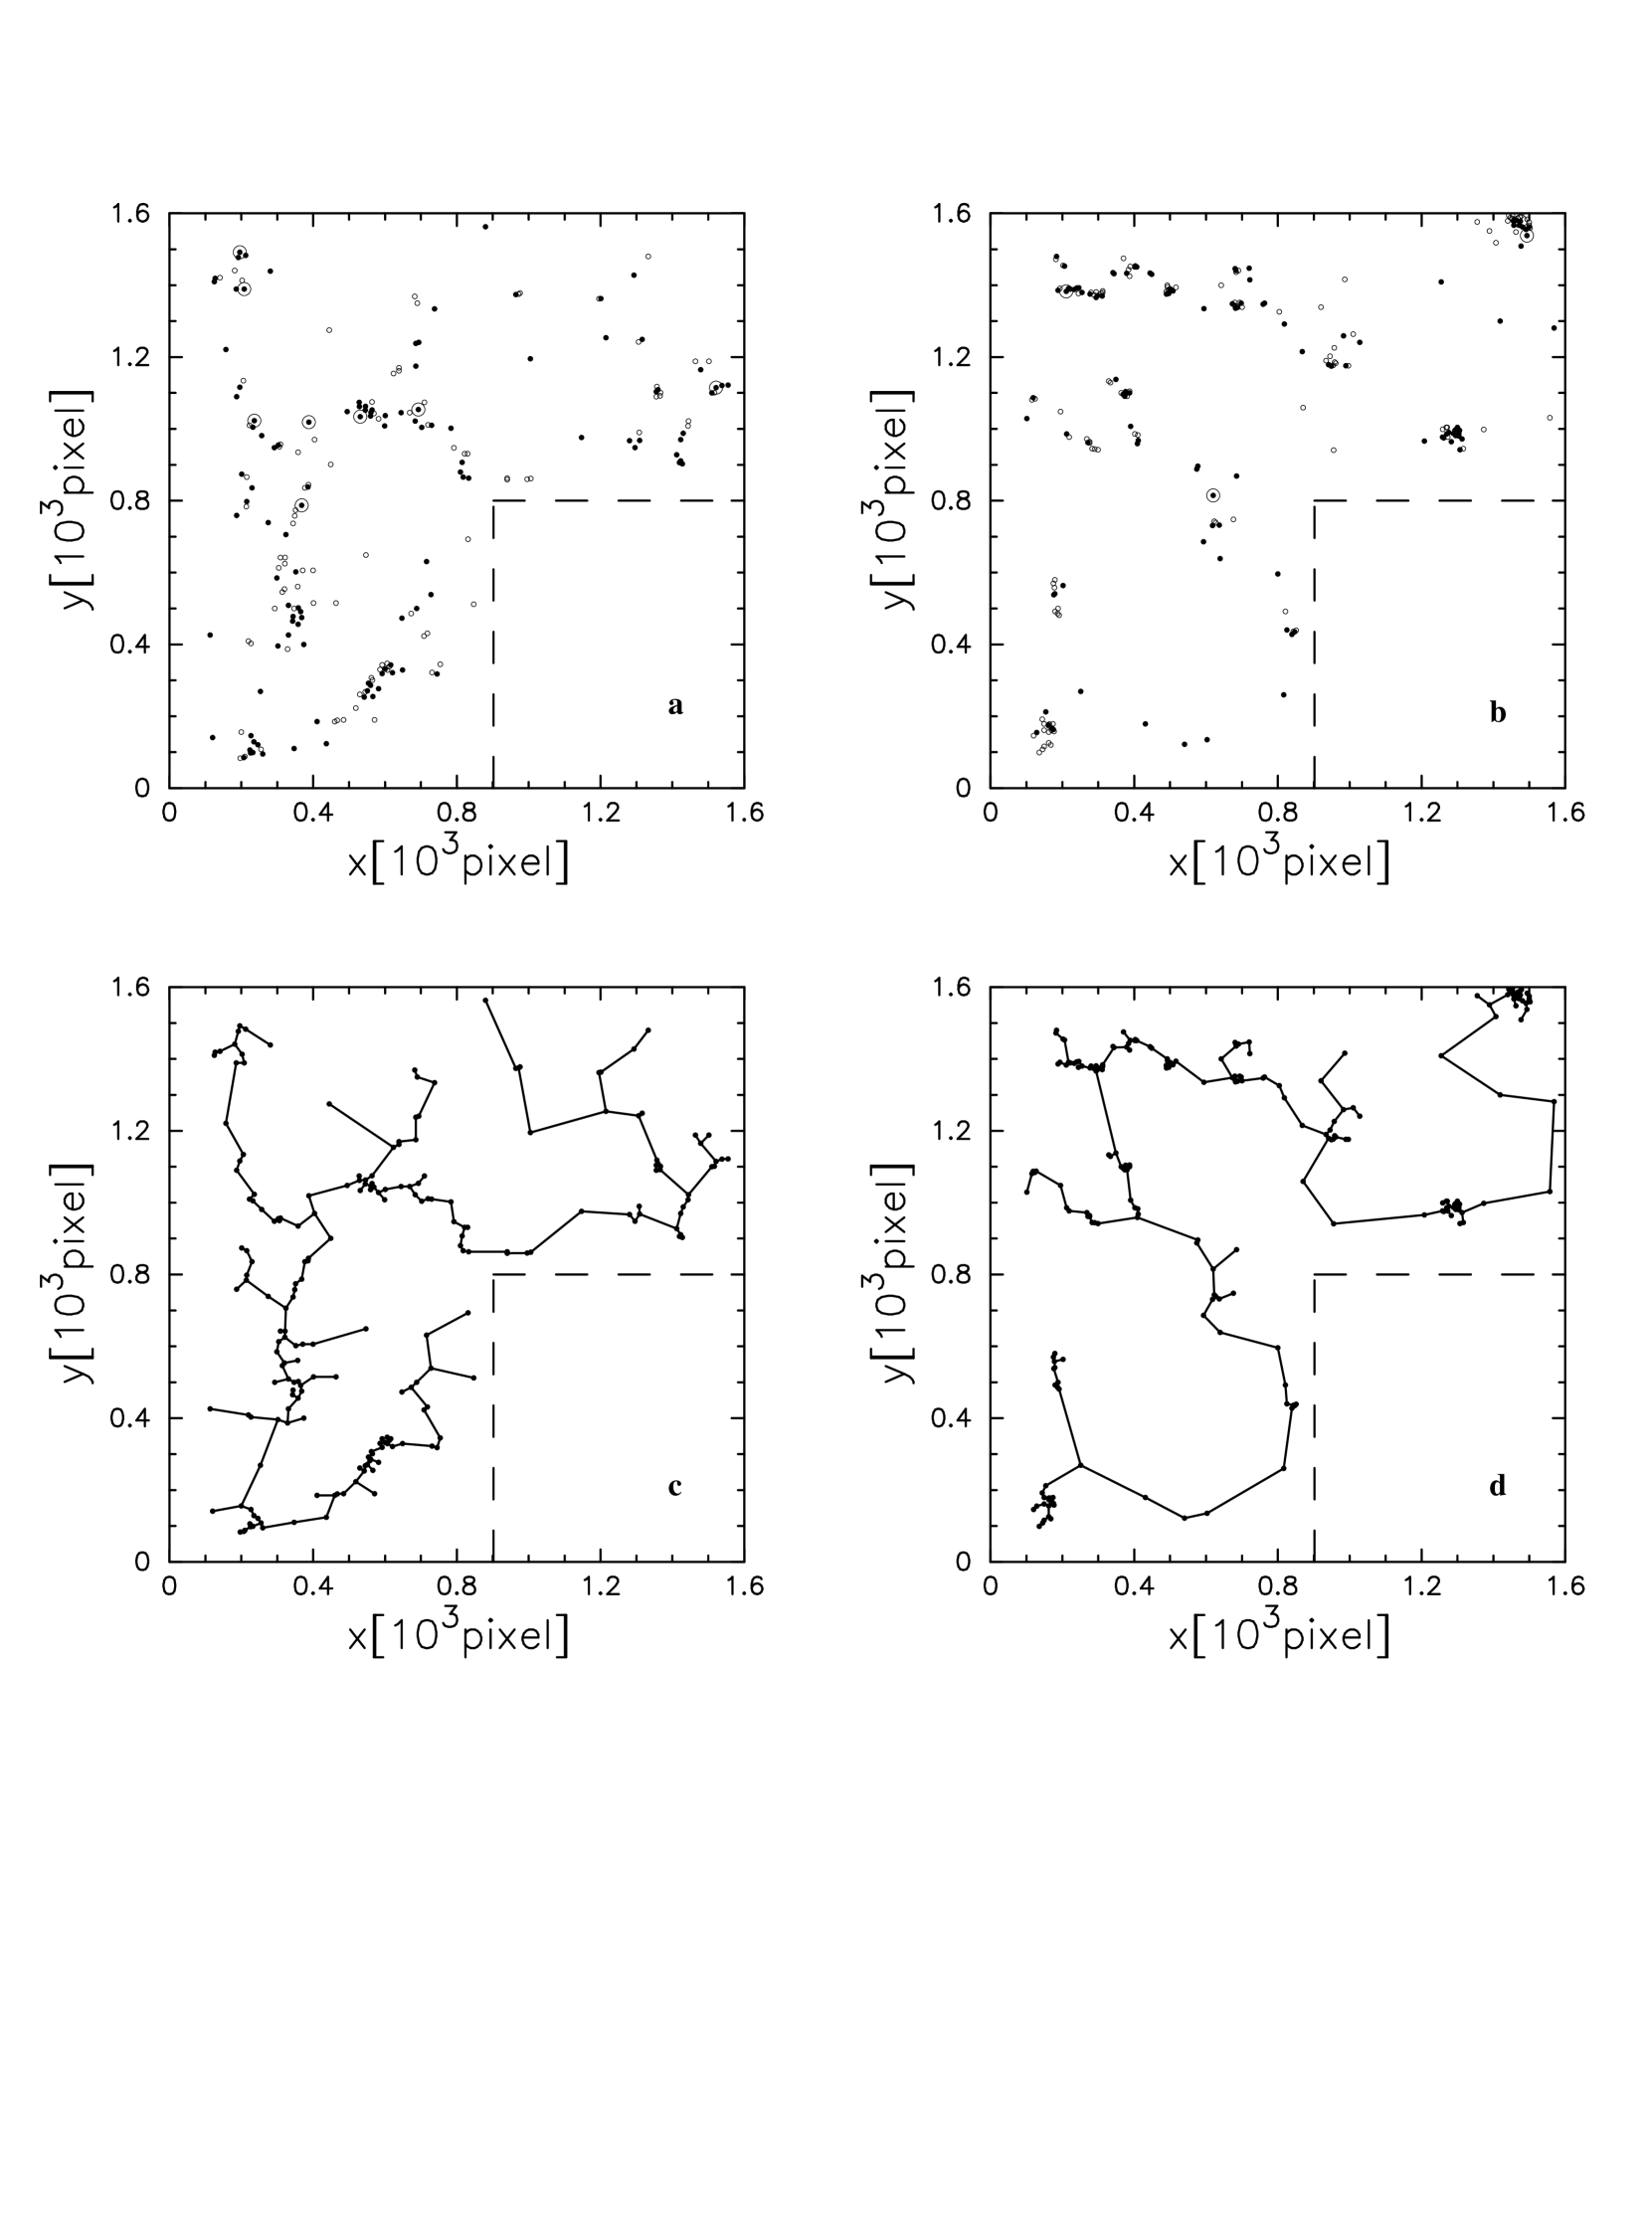
The spatial distributions exhibit some clear features. The regions are not located uniformly over the frames, but rather lie along ring- or bubble-like structures. Furthermore, on the first frame four particularly luminous regions lie along a common edge of two rings. An explanation for this distribution could be induced star formation in an expanding supernovae shell. A rough estimate of the radii of these structures is 0.7–1.0 kpc. This is of the order of the largest HI holes observed in galaxies, the so-called “superbubbles” (Kamphuis et al. kam91 (1991); Oey & Clarke oey97 (1997)). Another possible formation mechanism for the observed features might be through gravitational and thermal instabilities in a differentially rotating disk (Wada & Norman wad99 (1999)).
Similar distribution features are also observed for HI gas. A study of 11 nearby spirals by Braun (bra97 (1997)) has found that between 60–90% of the total HI line flux comes from a network of filamentary features with typical widths of about 150 pc, which is comparable to the region distribution in Fig. 14.
4.7.1 Resolution effects
To model the resolution effects on H ii regions, we adopt a Gaussian profile for the regions similar to Sec. 4.5. For simplicity of the calculations we discuss the effect on two identical region profiles. A simple calculation shows that the peaks of two identical gaussian profiles remain resolvable under convolution with a seeing gaussian if the peaks are originally separated by a distance larger than . Only for the most luminous regions is greater than . Because the luminous regions are not clustered close together (see Fig. 14), we can as a resonable approximation drop . Therefore regions that are closer than two seeing can not be separated. The pixelsize places further constraints on the resolvability of regions. In order to discriminate two emission peaks from each other, they must be separated by at least one pixel of lower flux. Hence the separation between the peaks must be at least two pixels. Our adopted ground based conditions are given by a pixelsize and seeing FWHM of respectively, and , which correspond to . Then the limiting quantity is of , corresponding to a linear dimension of about 66 pc at a distance of 20 Mpc.
The integral edge-length distribution, shown in Fig. 15,

gives directly the fraction of edges which have lengths above a given value. We can see that about 45–50% of all edges cannot be resolved at our adopted ground based resolution, demonstrating the importance of blending. The degree of blending will depend not only on the resolution, but also on the clustering properties of the H ii regions and diffuse emission.
In Fig. 16

we present the differential MST edge-length distribution along with power law fits. The parameters for the fits are given in Table 3.
| field | Slope | log lmin | lmin [pc] |
|---|---|---|---|
| a first | -1.49 | 1.20 | 16 |
| b second | -1.69 | 1.65 | 45 |
| c combined | -1.53 | 1.40 | 25 |
The power law index varies little between the frames (1.5–1.7), but the critical length where the distribution flattens differs substantially (16–45 pc). This could be a hint for a different minimum clustering regime for the two regions in the galaxy. This range of values is below the resolution of 66 pc of our smeared frames.
To further quantify the impact of region clustering combined with insufficient resolution, we simulate the blending of regions by removing the edges that are longer than twice the seeing . The clipping length is now treated as a function of the distance D,
| (14) |
We define a cluster as two or more regions which remain connected by edges following the clipping. With this definition all the regions in a given cluster would be smeared together into a single region at the specified seeing and distance.
Fig. 17

shows the number of clusters as a function of the clipping distance and the equivalent galaxy distance, with an assumed seeing of . The curves first increase rapidly, reach a maximum number of clusters at around a clipping length of 40 pc, and then slowly decrease as the clipping becomes larger. In Fig. 18

the corresponding average number of regions per cluster is given. While differing in detail, the overall clustering characteristics of the two fields are similar, growing approximately linearly with the clipping (smearing). The difference in slopes could be statistical, but also may have a physical origin in differing clustering properties of the two fields.
The clustering behavior may be interpreted in terms of two physical spatial regimes. Regions that are separated by edges lying in the first regime of 40 pc are thrown together by the smearing, creating a large number of clusters. This first regime corresponds to the flat part of the differential edge-length distribution. With increasing cutoff length the clusters, which are now grouped in the second regime, are slowly blended together according to their power law distribution. This behavior can been seen by eye in Fig. 2.
A check may be made by determining the sum of the numbers of clusters and unclustered regions with erg/s at a clipping of 60 pc. This sum should be roughly equal to the number of regions in the smeared frames. This is because a clipping of 60 pc corresponds to a distance of approximately 20 Mpc (Eqn. 14) and the smallest detected regions in the smeared case have luminosities of erg/s. The totals are in fact quite close, with values of 162 and 157, respectively.
If the blending of regions were responsible for the observed break in the luminosity function, with these clustering properties one would expect that the break would first appear at distances of around 10 Mpc ( FWHM) and then only change slowly with increasing distances. The corresponding linear scale again is about pc FWHM.
4.7.2 Physical Clustering
Putting resolution effects aside, we now examine the physical spatial clustering properties of the H ii and diffuse regions. In Fig. 19

we show the separate differential edge-length distributions for the H ii regions and diffuse regions. The slopes of the power law fits are and , respectively. The flattening of the distributions occurs at edge-lengths of about 20 and 32 pc. These values do not differ substantially, indicating a similarity in the clustering properties of the H ii and diffuse regions.
4.8 The Flux
To make a quantitative estimate of the diffuse emission contribution, we subtract the contribution of the H ii regions from the total flux. Since the local background has been removed from the region flux, our measurement of the region contribution corresponds to a lower limit. To obtain an upper limit we subtract the region background fluxes as well. We find that 35–39% of the flux in the resolved frames is attributable to individual H ii regions. For comparison, Ferguson et al. (fer96 (1996)) find values of about 50–70% and Rozas et al. (roz99 (1999)) 40–65%. The remaining flux must come from the diffuse regions and background. If we determine the same ratio for the smeared frames we obtain a somewhat different result. Here 64–74% of the total emission is found to be attributable to H ii regions and only 26–36% to the diffuse part.
A substantial fraction of the total diffuse emission is included in the H ii region luminosities by the effect of smearing. This is another indication of the importance of resolution in the interpretation of H ii region data.
5 Discussion
We have shown in the previous sections that the basic properties of H ii regions determined from high resolution HST frames differ significantly from even high quality ground based measurements. Only a few previous studies have had the necessary linear resolution to make reliable measurements of their statistical properties, such as size and luminosity distributions (Walterbos & Braun wal92 (1992); Wyder et al. wyd97 (1997)).
We simulate the effects of lower resolution on our HST frames by artificially smearing the data to typical ground based resolutions. The diameter distribution from high resolution HST observations exhibits a totally different range of values compared to those determined from lower resolution data. We find a diameter distribution which is more consistent with a power law than with the often used exponential function. This puts into doubt the concept of a characteristic size for H ii regions.
The luminosity function can be fit by a single slope power law above a luminosity of erg/s. Below this value the distribution is flat. Unfortunately, the existence of a break at higher luminosities can not be reliably determined through direct examination of the luminosity function derived from the M101 data because of the small number of regions with luminosities above the expected location of the break. In order to make such a determination, greater coverage of M101 will be needed to increase the statistics, particularly at the high luminosity end.
The LF of the artificially smeared data (Fig. 6a) is flatter in the mid-luminosity range. A clear identification of a high luminosity break can also not be reliably established. A close comparison of the frames at the two different resolutions has given us important insight into the influence of resolution on the measured H ii region properties. We find that as the resolution is reduced regions which are spatially close together are blended into a single observed “region”, along with a significant amount of diffuse emission. This process leads to the shifting of regions from low luminosity bins to higher bins. A luminosity of erg/s appears to mark an upper limit for this luminosity shifting effect. The blending of regions alone is not sufficient to explain this limiting luminosity, but requires the inclusion of the diffuse emission. While still not fully understood, it appears that the intrinsic properties of the diffuse emission clouds, such as their size, surface brightness, and spatial association with the H ii regions, play an important role. Modeling of the LF with the inclusion of the various effects of degraded resolution (Sec. 4.1) would be helpful in determining the nature of the high luminosity break and its possible relation to the diffuse emission.
The idea that the high luminosity break is a result of the blending of H ii regions and the masquerading of diffuse regions as genuine ionization sources differs from the hypothsis that it is due to a transition in the physical state of the H ii regions from ionization bounded to density bounded (Rozas et al. 1996a ; Beckman et al. bec98 (1998)). Still a connection might be given by the nature of the diffuse emission. If the diffuse emission close to the H ii regions is only ionized by the nearest source, then it may be considered as being associated with the regions. When a region and its associated diffuse emission are thrown together by the effects of resolution, then the blended region may be seen as being ionization bounded when sufficient diffuse gas is included. On the other hand a region may be seen as density bounded when the amount of diffuse gas included is insufficient with respect to the luminosity of the internal ionizing source. In this scenario the amount of diffuse gas included in a blended region is controlled by the resolution and hence to some extent so would be the position of the high luminosity break in the H ii region LF.
With even good ground based data the definition of what is an H ii region is heavily influenced by the resolution. At high resolution one can see that these smeared “regions” really consist of a complex of associated structures, such as diffuse clouds, arclets, shells, and filaments. Hence the surrounding gas is far from being evenly distributed around the ionizing source. With such a non-uniform topology it would be difficult to achieve a true ionization bounding, because the possibilities for a Lyman-continuum photon to escape unhindered are numerous. Such a situation is a poor representation of an idealized Stromgren sphere. It is also not clear to what degree external sources may contribute to the ionization of the diffuse component and particularly of the diffuse regions.
A direct examination of a sequence of artificially resolution degraded frames, and confirmed by the MST analysis, shows that the effects of smearing become particularly prominent around a critical linear resolution of about 40 pc FWHM and thereafter only worsens slowly. If the high luminosity break in the H ii region luminosity function is an artifact of resolution then this characteristic behavior may explain the stability of the break luminosity over a relatively large range of galaxy distances. Therefore the stability of the break luminosity is not unambiguous evidence against blending as a mechanism for producing the discontinuity. Clearly, modeling of this mechanism will be required to determine its viability. However, the importance of the diffuse emission should not be ignored and any model of the blending will need to take this into account along with the characteristics of the clustering.
The underlying reason for this behavior seems to be the clustering characteristics of the H ii regions and diffuse emission. The MST edge-length distribution exhibits a power law form with a flattening at about 25 pc. The length at which this transition occurs may be the primary factor influencing the location of the high luminosity break. The physical reason for the flattening at this value of edge-length is not clear, but may be related to a typical maximal fragmentation length within a single precursor gas-cloud. The power law slope would then represent the distribution of distances between the precursor gas-clouds. Another possibility could be related to two different mechanisms of star formation as described by Scowen et al. (sco96 (1996)). Whereas the power law edge-length distribution might correspond to the fragmentation of the ISM induced by the passage of a spiral arm density wave, the flat part may represent typical spatial sizes of local subsequent star formation. In this case the patches of diffuse emission might be interpreted as expanding HII region remnants. If the break in the LF is interpreted as due to these clustering properties, its frequent appearance derived from ground-based data may suggest a similarity of two different regimes of star formation in M101 and other late-type spirals.
There is an indication that the clustering characteristics between the two observed fields differ. While the edge-length distributions show similar slopes, the value at which the power law flattens out differ by about 30 pc. It is not clear if this difference has a physical origin or is merely statistical. Such a difference is not found when we compare the luminosity functions or diameter distributions for the different fields. The flattening of the luminosity function is found for both fields at , which corresponds to a diameter of about 30 pc. If the difference is indeed physical in nature, then one must explain how the properties of the fragmentation regimes can differ without affecting the other star formation properties.
Our simple analytic model of the resolution effects on the profiles can successfully reproduce the general behavior of the surface brightness gradients seen at lower resolutions. While the profiles of the lower luminosity regions () are dominated by the point spread function, the profiles of higher luminosity regions which have spatial sizes greater than the seeing scale are expected to represent the true properties of the regions. We therefore interpret the break in the surface brightness gradient distribution as a resolution effect. This simple model provides a prediction on how the luminosity of the break changes with distance.
The measured central surface brightness of the resolved regions shows a large scatter and does not exhibit a well defined trend with luminosity. This is not true for the smeared regions which exhibit a nearly constant value up to erg/s. After this the central surface brightness increases steeply with increasing luminosity. Our simple model again reproduces this behavior fairly well and predicts the transition luminosity will vary with distance.
In both cases the profile and the central brightness become seeing dominated at linear resolutions worse than 40 pc FWHM. Therefore this linear resolution marks the minimum resolution required for reliable determinations of region characteristics. This kind of resolution is currently only achievable from the ground for the nearest galaxies. Taking this into account the observed breaks at lower resolution do not seem to be reliable evidence for a transition from ionization bounded to density bounded H ii regions.
Concerning the question as to whether the high luminosity break in the LF can be used as a standard candle as proposed by Beckman et al. (priv. comm.), more observations will be required to validate the stability of the break luminosity with distance (resolution) and galaxy type. A clearer understanding of its physical origin would greatly assist in such an effort. In our interpretation, the break is a result of the clustering characteristics of the H ii regions and diffuse emission. As seen in the MST analysis, the differences between the two fields we studied in M101 may be an indication that significant differences in the clustering properties exist even within a single galaxy. Depending on the degree to which this were true, the utility of a global LF of a galaxy as a measure of its star formation properties would be compromised.
A further indication of variations in region clustering may be in the study of the barred galaxy NGC 7479 by Rozas et al. (roz99 (1999)), who find differences between the bar H ii region population and that of the overall disk. Furthermore this galaxy shows a different behavior in comparison to the non-barred galaxies with respect to the break luminosity in the central surface brightness distribution. This could be a hint for a possible variation of H ii region clustering properties with galaxy type.
Clearly additional high resolution work is needed to both confirm and extend these results. More sophisticated methods should be applied to the radial profiles in order to better characterize their properties. Even a rough determination of cluster age from broad band imaging would be useful for constraining the physical origin of the larger scale HI structures and their relationship to the star forming clouds.
With respect to possible further high resolution observations, obtaining better statistics is vital for making further progress on the luminosity and diameter distributions. To generalize the results, these investigations should be carried out for different galaxy types. A comparison between a barred and non-barred galaxy would be an important test of the stability of the high luminosity break as the dynamics of the two systems are quite different.
6 Summary
In this paper we present high resolution HST data of M101. For a comparison with previous ground based observations we artificially shift these frames to an effective distance of 20 Mpc by rebinning, changing the pixelsize to , and convolving with a seeing gaussian of FWHM. For both resolutions we derive the integral diameter distribution, luminosity function, surface brightness gradients and central surface brightnesses.
For the integral diameter distribution at high resolution we find a characteristic diameter pc. However, a power law fits the data better with a slope . The luminosity function in the resolved case can be fit by a single slope power law with in the luminosity range between and erg/s. It flattens for lower luminosities. The surface brightness gradients exhibit a constant limit with a lot of scatter to steeper gradients. Because of large scatter it is hard to find an appropriate function of luminosity for the central surface brightness.
Comparing the diameter distribution at the two resolutions, we find a totally different range of values. Whereas the diameters of the resolved regions lie between about 10 and 220 pc, the diameters in the smeared case show values from about 150 pc to greater than 400 pc. We also find a different functional form at the higher resolution, namely a power law rather than an exponential function.
The LF in the smeared case exhibits a reduction of regions in lower luminosity bins, while an excess in the range between and erg/s. We attribute this behavior to the intrinsic clustering properties of the H ii regions and diffuse emission combined with resolution effects. As the resolution is reduced spatially associated regions are blended together including a significant amount of diffuse emission. This process leads to a shifting of the regions into higher luminosity bins and may account for the often observed break in the LF at erg/s.
We have further investigated this effect by examining the clustering quantitatively with a minimal spanning tree (MST). There we find a power law function for the edge-length distribution which flattens at about 25 pc and has an index of about .
The edge-length where the flattening occurs may be the primary influence on the location of the break. The two different spatial regimes are interpreted as two different regimes of star formation in M101. If the break in the LF is interpreted as due to these clustering properties its frequent appearance derived from ground-based data may suggest a similarity of two different regimes of star formation in M101 and other late-type spirals.
The surface brightness gradients as a function of luminosity for the smeared regions may be described by a bilinear fit, but a simple analytic model shows that this feature results completely from the degraded resolution. With the same mathematical approach the break of the central surface brightness of the smeared regions is predicted correctly, indicating that neither break can be considered as a real physical effect.
The minimum linear resolution needed to reliably measure internal quantities is found to be about 40 pc FWHM. Such resolutions are only currently obtainable from the ground for the nearest galaxies.
In our view the hypothesis that the high luminosity break in the LF is due to a transition from ionization bounded to density bounded H ii regions is still not firmly established and resolution effects need to be better taken into account when making such studies. The intrinsic clustering properties of the H ii regions and the associated diffuse emission combined with typical resolutions may be able to produce the observed break.
Further high resolution observations will be needed to confirm these results and obtain reliable statistics on the characteristics of H ii regions in galaxies. Only then will it be possible to determine whether the clustering characteristics of H ii regions differ with galaxy type and environment, and any connection it may have with the local dynamics.
Acknowledgements.
We wish to thank John Beckman for providing his early results, Rebecca Koopmann for help with the data reduction, Albert Bosma for interesting discussions, and Polichronis Papaderos and Uta Fritze-von Alvensleben for helpful comments. This work was supported in part by the Deutsche Forschungsgemeinschaft under grant FR 325/39-3.References
- (1) Banfi, M., Rampazzo, R., Chincarini, G., Henry, R.B.C, 1993, A&A, 280, 373
- (2) Barrow, J.D., Bhavsar, S.B., Sonoda, D.H, 1985, MNRAS, 216, 17
- (3) Beckman, J.E., Rozas, M., Knapen, J.H., 1998, PASA, 15, 83
- (4) Braun, R., 1997, ApJ, 484, 637
- (5) Cepa, J, Beckman, J.E., 1990, A&AS, 83, 211
- (6) Cepa, J, Beckman, J.E., 1989, A&AS, 79, 41
- (7) Delgado, R.M.G., Perez, E., 1997, ApJS, 108, 199
- (8) Ferguson, A.M.N., Wyse, R.F.G., Gallagher III, J.S., Hunter, D.A., 1996, AJ, 111, 2265
- (9) 9042.tex Elmegreen, D.M., Salzer, J.J., 1999, AJ, 117, 764
- (10) Greenawalt, B., Walterbos, R.A.M., Braun, R., 1997, ApJ, 483, 666
- (11) Heller, C.H., Heller, K.S., Koopmann, R.S., 1999 in prep.
- (12) Hodge, P.W., 1987, PASP, 99, 915
- (13) Holtzman, J.A., Burrows, C.J., Casertano, S. et al., 1995, PASP, 107, 1065
- (14) Kamphuis, J., Sancisi, R., van der Hulst, T., 1991, A&A, 244, L29
- (15) Kelson, D.D., Illingworth, G.D., Freedman, W.F. et al., 1996, ApJ, 463, 26
- (16) Kennicutt, R.C., Hodge, P.W., 1980, ApJ, 241, 573
- (17) Kennicutt, R.C., Edgar, B.K., Hodge, P.W., 1989, ApJ, 337, 761
- (18) Knapen, J.H., 1998, MNRAS, 297, 255
- (19) Knapen, J.H., Arnth-Jensen, N., Cepa, J., Beckman, J.E., 1993, AJ, 106, 56
- (20) McKee, C.F., Williams, J.P., 1997, ApJ, 476, 144
- (21) Oey, M.S., Clarke, C.J. 1997, MNRAS, 289, 570
- (22) Oey, M.S., Clarke, C.J. 1998, AJ, 115, 1543
- (23) Rand, R.J., 1992, AJ, 103, 815
- (24) Rozas, M., Beckman, J.E., Knapen, J.H., 1996a, A&A, 307, 735
- (25) Rozas, M., Knapen, J.H., Beckman, J.E., 1996b, A&A, 312, 275
- (26) Rozas, M., Castañeda, H.O., Beckman, J.E., 1998, A&A, 330, 873
- (27) Rozas, M., Zurita, A., Heller, C.H., Beckman, J.E., 1999, A&AS, 135, 145
- (28) Sandage, A., 1961, The Hubble Atlas of Galaxies, Carnegie Institution Washington
- (29) Scowen, P.A., Dufour, R.J., Hester, J.J., 1992, AJ, 104, 92
- (30) Scowen, P.A., Hester, J.J., Gallagher, J.S., III, Wilcots, E., IDT, The WFPC2, 1996, AAS, 189.6808
- (31) Van den Bergh, S., 1981, AJ, 86, 1464
- (32) Wada, K., Norman, C., 1999, preprint
- (33) Walterbos, R.A.M., Braun, R., 1992, A&AS, 92, 625
- (34) Walterbos, R.A.M., Braun, R., 1994, ApJ, 431, 156
- (35) Wyder, T.K., Hodge, P.W., Skelton, B.P., 1997, PASP, 109, 927