The circumnuclear X–ray reflectors in NGC 1068 and the Circinus Galaxy
Abstract
The and spectra of the Circinus Galaxy and NGC 1068 are analysed and compared with photoionization models based on cloudy. In the case of Circinus, a single, mildly ionized reflector can account for the line spectrum, while in NGC 1068 at least three different reflectors (with different ionization states) are needed. We suggest that the reflector in Circinus, and the low ionized one in NGC 1068 are the inner and visible part of the material responsible for the X–ray absorption. With this assumption, we estimate for the inner radius of the absorber a value of 0.2 pc for Circinus and of a few parsecs for NGC 1068.
keywords:
Line: formation – galaxies: individual: Circinus Galaxy, NGC 1068 – galaxies: active – X-rays: galaxiesStefano Bianchi, et al.
1 Introduction
The heavy obscuration of the nuclear X–ray emission in Seyfert 2 galaxies allows to observe and study components that in type 1 sources are diluted into invisibility by the nuclear radiation. Among these components, particularly interesting are those due to reflection of the nuclear X–rays from circumnuclear matter, as they permit in principle to map the reflecting regions and probe their physical and chemical properties through the study of the continuum and especially of the emission line spectra (e.g. Netzer 1996; Matt, Brandt & Fabian 1996; Krolik 1999 and references therein).
If the absorbing matter is Compton–thick (i.e. cm-2, see Matt et al. 2000 for the discussion of the general properties of Compton–thick sources), the nuclear radiation is obscured up to at least 10 keV, and all astrophysically important X–ray lines (including iron lines) emitted by the reflecting matter can be studied.
In this paper we discuss the and X–ray spectra of the two brightest and best studied Compton–thick sources, i.e. the Circinus Galaxy and NGC 1068. In the case of NGC 1068, we present for the first time results from the AO4 100 ks ASCA observation (results published so far by Ueno et al. 1994, Iwasawa, Fabian & Matt 1997, and Netzer & Turner 1997, were obtained with the PV 40 ks observation). Our aim is to derive the properties of the reflectors in these sources. To achieve this goal, we have extensively used the photoionization code cloudy111 http://www.pa.uky.edu/~gary/cloudy/ (version 90.05; Ferland 1997), to construct theoretical models to be compared with the observations.
The paper is organized as follows: Sec. 2 summarizes previous X–ray observations of the two sources; Sec. 3 describes the data reduction, while Sec. 4 reports the spectral analysis and Sec. 5 compare the results with the theoretical models. In each section we will discuss first the Circinus Galaxy and then NGC 1068. Finally, the results will be summarized in Sec. 6.
2 Previous X–ray observations
2.1 The Circinus Galaxy
The Circinus Galaxy, one of the closest AGN and X–ray brightest Seyfert 2 galaxies, was observed for the first time in X–rays during the ROSAT All Sky Survey [Brinkmann, Siebert & Boller 1994]. Later on, it was observed by ASCA; the spectrum is dominated by a pure Compton reflection component, with a very prominent iron K line and several other lines from lighter elements (Matt et al. 1996). The lines from the lighter elements have energies indicating significant ionization of the emitting material (Matt et al. 1996; Netzer et al. 1998; Sako et al. 2000). The BeppoSAX observation, besides confirming the ASCA findings below 10 keV, detected the nuclear emission, seen through very thick (4 cm-2) absorbing matter (Matt et al. 1999; Guainazzi et al. 1999).
2.2 NGC 1068
The history of the X–ray observations of NGC 1068 is longer and richer than that of the Circinus Galaxy. The source was observed by Einstein (Monier & Halpern 1987) and EXOSAT (Elvis & Lawrence 1988); the lack of any measured intrinsic absorption was interpreted by those authors as evidence for reflected emission of an obscured nucleus. This scenario was confirmed by the Ginga detection of a strong iron line (Koyama et al. 1989). At softer energies, the ROSAT HRI discovery of a very extended (13 kpc) emission indicated that a large part of the radiation in this band is related to the host galaxy rather than the nucleus.
ASCA (Ueno et al. 1994; Iwasawa, Fabian & Matt 1997; Netzer & Turner 1997) confirmed both the thermal–like emission in soft X–rays and the reflection component at higher energies. The very rich line spectrum and the complex iron line (including a neutral or low ionized line as well as He– and H–like lines) indicate that more than one reflector is present. Smith, Done & Pounds (1993) proposed to identify the cold reflector with the inner surface of the putative molecular torus, an idea further pursued by Matt, Brandt & Fabian (1996) and Iwasawa, Fabian & Matt (1997). BeppoSAX confirmed the complexity of the reflection in NGC 1068 by separating at least two reflecting continua, one cold and one ionized (Matt et al. 1997; Guainazzi et al. 1999). The lack of any transmitted component implies that the absorbing matter should have a column density exceeding 1025 cm-2.
Finallly, evidence for flux and spectral variability between the two BeppoSAX observations is discussed by Guainazzi et al. (2000).
3 Data reduction
3.1 The Circinus Galaxy
In the spectral analysis discussed below we will mainly use ASCA data (observation performed on 1995, August 14), but we will also take advantage of the BeppoSAX results (observation performed on 1998, March 24).
Details on the BeppoSAX observation and related data reduction can be found in Matt et al. (1999) and Guainazzi et al. (1999). Regarding , we have verified the previous results (Matt et al. 1996) using the Revision2 data processing and the latest calibration. It should be noted that the spectrum appears to be affected by a gain problem: e.g., the iron K line at 6.4 keV is shifted to a higher energy (see below for details) and a similar energy shift is seen for the instrumental Ni K line at 7.5 keV. We have checked the instrumental Ni K line at 7.5 keV for the two data taken from a source-free region on the detector field of view and found that the data show an energy shift similar to that seen in the source spectrum while the data show the line at the right energy. We therefore believe that the line energies derived from the SIS1 are more reliable. Also, a recent HETG observation of the Circinus galaxy found a narrow line at 6.4 keV (R. Sambruna, private communication).
3.2 NGC 1068
In the spectral analysis discussed below we have used both ASCA (observation performed on 1996, August 15) and BeppoSAX (observations performed on 1996, December 30 and 1998, January 11) data.
Details on the BeppoSAX observations and related data reduction can be found in Matt et al. (1997) and Guainazzi et al. (1999, 2000).
The data presented here are from a long observation carried out in the AO-4. The data reduction was performed in the standard procedure using FTOOLS version 4.2 and the latest calibration available. The exposure time for both detectors is 118 ks, respectively.
4 Spectral analysis
4.1 The Circinus Galaxy
We have re–analysed the ASCA SIS1 spectra of the Circinus Galaxy to search for emission lines, taking advantage of the results on the continuum obtained with BeppoSAX [Matt et al. 1999]. We have fitted the spectrum with the following model:
| (1) |
where is the cold reflection component (model pexrav; the power law photon index of the nuclear illuminating continuum has been fixed to the value of 1.56 obtained with BeppoSAX, Matt et al. 1999), is a power law component describing the soft X–ray emission, and is the cold absorption along the line of sight, which includes absorption from our own Galaxy plus possible contributions from the Circinus Galaxy itself. The primary, heavily absorbed continuum discovered by BeppoSAX has not been included in the model because it does not affect the ASCA energy band. We have added as many emission lines as required by the data, inspecting by eye the residuals after any single addition. All lines have been assumed to be narrow for simplicity, even if, as discussed in Sec. 5.1, some of them are very likely a blend of different lines with comparable fluxes. With all lines included, the reduced is 0.8 for 141 d.o.f.. The best fit parameters for the continuum are listed in Table 1, while Fig. 1 and 2 show the best fit models for ASCA and BeppoSAX.
We will focus our interest on the line spectrum in Sec. 5.1: the best fit line parameters are listed in Table 3, along with the most likely identifications. SIS1 data are systematically different from those of SIS0: the line energies (even if always at least marginally consistent with the other instrument) are all shifted to higher values, while the equivalent widths (except for the first one) are all much lower than those of SIS0. The reason for this discrepancy is not clear. The EWs measured by SIS0 may be more reliable, since this instrument is considered to be best calibrated at lower energies, while the correct line energies are probably those measured by SIS1 (see discussion in Sec. 3.1). The value of the reduced for the fit of the continuum is similar for the two instruments.


Upper limits on the equivalent widths of the ionized iron lines are 30 eV for the 6.7 keV Fe xxv line, and 340 eV for the 6.96 Fe xxvi line.
The photon index of the soft power law is not very well constrained, i.e. , while the column density of the absorbing matter is 6.6(2.1) cm-2. (The fit to the BeppoSAX data, after fixing the same value for the column density, gives a flatter power law with ). A thermal plasma model for the soft excess does not provide a better fit to the data. The temperature is 1.84 keV, while the abundance is constrained to be less than 0.7 times the solar value. As the thermal model cannot account for the observed lines, we do not discuss it any further. The 0.5–2 keV luminosity of the soft component is around 7 erg cm-2 s-1. The IR/soft–X–ray ratio is similar to that of the sources in the sample of powerful infrared galaxies studied by Iwasawa (1999).
| ASCA | BeppoSAX | |||
| powerlaw | mekal | powerlaw | mekal | |
| reduced | 0.8 (141 d.o.f.) | 0.8 (140 d.o.f.) | 1 (92 d.o.f.) | 1 (91 d.o.f.) |
| cut-off (keV) | ||||
| () | ||||
| - | - | |||
| (keV) | - | - | ||
| - | - | |||
4.2 NGC 1068
As already noted by Iwasawa, Fabian & Matt (1997) and Guainazzi et al. (1999), the X–ray spectrum of NGC 1068 is much more complex than that of the Circinus Galaxy. The continuum is composed by at least three components: a thermal–like one, probably associated with the extended starburst observed by ROSAT [Wilson et al. 1992] and dominating the soft X–ray band; and at least two reflectors, one cold and one ionized (Iwasawa, Fabian & Matt 1997, Matt et al. 1997). Superimposed on these components are many emission lines, most of them associated with the ionized reflector(s), even if the neutral K line is clearly visible.
We adopted for the continuum the same model of Guainazzi et al. (1999): a single temperature thermal plasma model (mekal in Xspec), a cold reflection component (pexrav) and an ionized reflector component, assumed to be a simple power law with the same spectral index of the power law illuminating the cold matter, which in turn has been fixed to 2.13, as measured by BeppoSAX [Guainazzi et al. 1999]. The column density of the absorbing matter has been fixed to the Galactic value of 3.51020 cm-2 (Dickey & Lockman 1990). Then, as in Circinus, we added emission lines until required by the data. The best fit parameters for the continuum are given in Table 2, giving a reduced of for 582 d.o.f.. They are consistent with those obtained by Guainazzi et al. (1999) from the BeppoSAX data.
The free parameters in the fit, apart from the energies and the normalizations of the lines, are the temperature and the abundance of the mekal model: and .

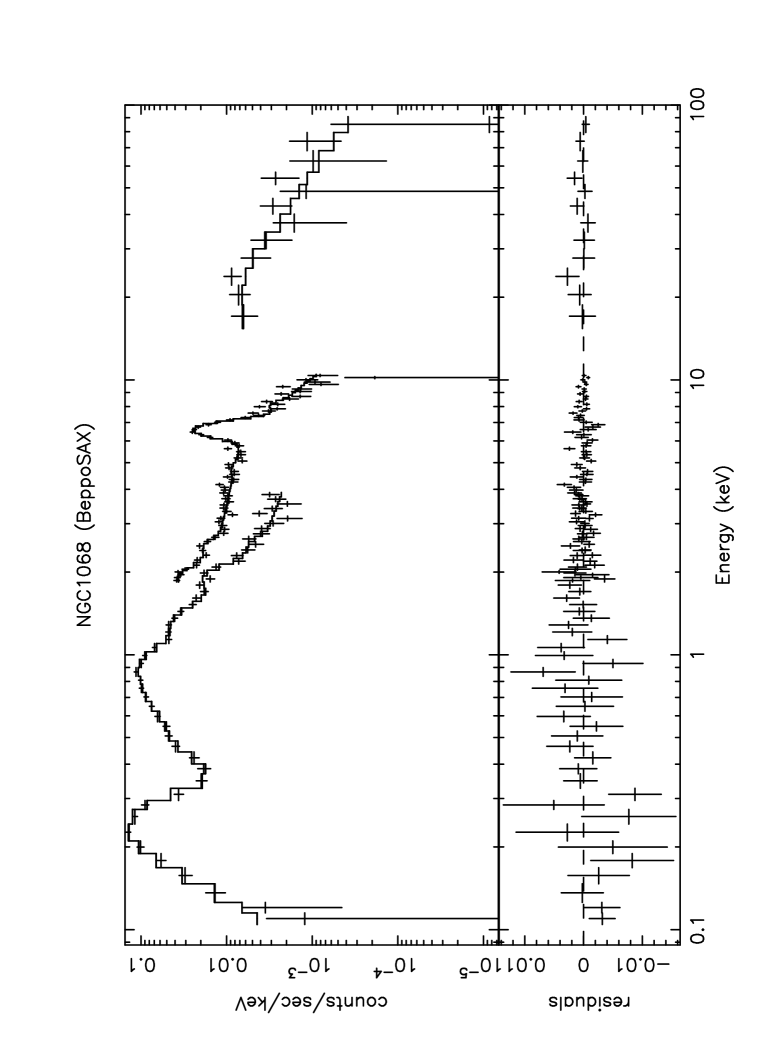
A fit to the BeppoSAX data (Fig. 4) with the same model gives a similar value for the reduced , but the mekal parameters are not consistent with the ASCA ones: keV and . Two more lines are needed for the BeppoSAX data with respect to those found with ASCA, at energies of 0.55 and . This is the result of the larger band coverage of the instruments aboard BeppoSAX. The lines at 0.55 e have been both observed and discussed by Guainazzi et al. (1999). The identification of the second one with the transition of Fe xxvi at [Guainazzi et al. 1999] allows to fix its energy and calculate the ratio against the of Fe xxvi, which is .
The line at confirms one of the most interesting results of Guainazzi et al. (1999), i.e. the detection for the first time of the O vii line. It is worth remarking that this line is in excess of what expected from the thermal–like component, and therefore it is likely to be produced in one of the reflectors. This line was not observed in previous observations because of the low energy resolution (ROSAT) or the narrow band coverage (ASCA). The upper limit set by the BBXRT observation suggested that the abundance of the oxygen could be less than the cosmic one (Marshall et al. 1993; Netzer & Turner 1997). Instead, the clear presence of this line in the BeppoSAX data overcomes this difficulty and, as we will see in Sec. 5.2, puts strong constrains to the number and the characteristics of the reflectors in NGC 1068.
| ASCA | BeppoSAX | |
|---|---|---|
| reduced | 1.1 (582 d.o.f.) | 1.3 (111 d.o.f.) |
| () | ||
| (keV) | ||
| redshift |
5 Comparison with models
5.1 The Circinus Galaxy
5.1.1 The model
The unambiguous presence of a Compton reflection component in the ASCA (Matt et al. 1996) and BeppoSAX [Matt et al. 1999] spectra indicate the presence of thick circumnuclear matter. From the ratio between the reflected and direct components, it is likely that the covering factor of this matter is fairly large (Matt et al. 1999, Guainazzi et al. 1999, Matt et al. 2000). It is then natural to assume that the reflecting and absorbing media are one and the same. We have therefore calculated with cloudy the reflected spectrum from a X–ray illuminated material with a column density of 4.31024 cm-2 [Matt et al. 1999], adopting the dimensionless ionization parameter , defined as:
| (2) |
where is the total number of ionizing photons per unit time reaching the surface of a cloud at a distance from the source, while is the hydrogen number density. With the nuclear X–ray spectrum and luminosity of Circinus [Matt et al. 1999], we obtain (cgs units):
| (3) |
From the measurements of the dynamical mass, Risaliti et al. (1999) have set an upper limit of 20 pc on the external radius of the cold matter, , in agreement with recent estimates from IR observations, which give a value of [Ruiz et al. 2000]. Thus, assuming , the density is cm-3, and the inner surface of the cloud is 0.11 pc. As described below, we have found a solution with 0.25, which implies a value for of 0.2 pc, roughly consistent with the water maser measurements of Greenhill et al. (1997) and with the value of 0.5 pc estimated from the IR observations whose we adopted in our calculations. Then the assumption is, a posteriori, justified. (It must be noted that the above determination of is based on the simplyfing assumption of constant density along the torus. A negative density gradient would, however, be probably more realistic. If this is the case, this value of must be regarded as an upper limit.)
We searched for the simplest possible solution, i.e. a single reflector. The iron line undoubtedly comes from low ionized atoms, while lighter elements are fairly ionized. We therefore searched for the highest value of consistent with iron less ionized than xvii, to ensure that the iron line is still at 6.4 keV, and that the resonant trapping (e.g. Matt, Fabian & Ross 1993) is not effective. We found such a solution with =0.25. The ionization structures for iron, sulphur, silicon and magnesium are shown in Fig. 5.


As a consistency check, we refitted the data with an ionized reflector (i.e. pexriv in Xspec) instead of the cold one. The ionization parameter used by pexriv has a different definition:
| (4) |
where is the luminosity, assuming the continuum as a simple power law (Magdziarz & Zdziarski, 1995). The conversion factor between the two definitions is . Thus, the ionization parameter used in our model corresponds to .
We first checked if reflection from ionized material could explain the soft excess, and then we fitted ASCA and BeppoSAX data without the additional soft power law. In both cases, the fit is unacceptable, giving a reduced greater than 2. We then fitted the data including the power law component, and fixing . The ionization parameter has been fixed because it was not well constrained: the value obtained with cloudy is more reliable, as pexriv calculates the ionization equilibria in a simplified way (Done et al., 1992). In these conditions, the ASCA fit has a reduced almost identical to the one obtained with pexrav. The soft power law photon index is , while the absorbing column density . The flux in the power law is now a factor 2 lower than for the cold reflector. The results for BeppoSAX data are roughly the same, but again with a photon index () which is not consistent with the ASCA one.
Finally, we have estimated the solid angle of the reflecting matter which is observable by comparing the observed ), and calculated iron line fluxes. We find a value of 0.2.
5.1.2 The line spectrum
| SIS1 | SIS0 | |||
|---|---|---|---|---|
| E(keV) | EW(eV) | E(keV) | EW(eV) | Id. |
| Ne ix | ||||
| Mg xi | ||||
| Si xiii | ||||
| Si xiii | ||||
| S xv/xvi | ||||
| Ar xvii | ||||
| Fe | ||||
| Fe | ||||
The spectrum is rich in emission lines, and it is likely that in most cases the observed lines are actually a blend of two or more lines with comparable intensities. In Tab. 4 we report the observed equivalent width of the lines (measured with respect to the reflected continuum only) compared with the total EW of the most important lines likely contributing to any single blend, as calculated by cloudy. The agreement between observed and calculated one is good for the lines with energies above provided that the abundance is significantly higher than the solar one, i.e. for the SIS0 data ( for the less reliable SIS1 data) (However, it should be noted that Oliva et al. (1999) found, instead, evidence for lower than solar metal abundances).
| (keV) | EW(eV) | Id. | E(keV) | |
|---|---|---|---|---|
| Si xiii | 1.85 | |||
| 1.85 | 245 | Mg xii | 1.87 | |
| Mg xii | 1.91 | |||
| 2.09 | 10 | Si xiv | 2.01 | - |
| Si xiii | 2.17 | |||
| Si xiii | 2.29 | |||
| 2.37 | 52 | Si xiii | 2.38 | |
| S xv | 2.45 | |||
| Si xiv | 2.50 | |||
| 2.56 | 5 | Si xiv | 2.60 | - |
| S xvi | 2.63 | |||
| S xv | 2.88 | |||
| 2.99 | 15 | S xv | 3.02 | |
| Ar xvii | 3.08 | |||
| 6.45 | 1300 | Fe | 6.45 |
This value for is still consistent with the Fe line, which does not depend linearly with the abundance, but only logarithmically [Matt, Brandt & Fabian 1996], and it is strongly dependent on the other elements’ abundance. For , the EW of the iron line increases by only a factor of , in agreement with the observations. Since there are not detailed calculations of this effect for the other lines, we assume, like cloudy apparently does, that their dependence on the abundance is almost linear; in any case, the derived should be considered as a lower limit. It should be also noted that the model predict two other weak line systems, centered at at and , which are not observed, not surprisingly given the very low equivalent widths.
In the table we did not include the line at , which could be identified either as the from neutral iron (), or the line from Fe xxvi (). Matt et al. (1996) proposed a blend of these two lines, because they observed a very large EW. This kind of solution would be unacceptable for our model, because it would imply the presence of a highly ionized reflector for the Fe xxvi line to be produced. If we consider the SIS1 data, we face the same problem: the EW of the line, if it has to be identified with the only, should be the , while the observed one is much more intense, . If, instead, we analyse the data from SIS0, the ratio becomes consistent with the expectations, being . On the other hand, cloudy does not seem to include the Fe line in its calculations, so we could not compare it with the data.
The comparison of the lines observed in the ASCA spectrum at and with the cloudy model is made difficult by the large number of lines present, in the calculations, at those energies. These lines are mainly lines from Ne and Mg and lines from Fe, but contributions from Ca, Mn and other elements are also present. When folded with the and response matrices, these lines are blended to a pseudo–continuum, which contributes for about 10% of the observed soft excess. A detailed comparison between models and data for these lines must await high resolution spectra, as those provided by the gratings onboard Chandra and XMM–Newton.
Given the very simple assumptions, the agreement between observations and model is remarkable. At the resolution of a CCD, therefore, a single, mildly ionized material seems able to explain the Circinus X–ray spectrum.
Finally, as a consistency check, we have also calculated the optical emission lines from such a reflector, and compared with those observed by Oliva, Marconi & Moorwood (1999) in the central, unresolved region of the source. As there may be other regions contributing to the optical spectrum besides the X–ray reflector, we are contented with not overproducing the observed lines. This goal is achieved assuming a dust–to–gas ratio typical of the interstellar matter, and provided that the temperature of the reflecting matter is larger than 105 K, otherwise the [O III]5007 line is overproduced (an agreement with this line is obtained for 2.5105 K). The calculated flux of the is instead a few times lower than observed, as for other intense lines (Tab. 5). It is worth noting that dust is expected to be present, since the reflecting surface of the torus is well beyond the evaporating radius, which is (Barvainis 1987):
| (5) |
if we assume (Siebenmorgen et al. 1997). It must be recalled that dust may survive in an ionized medium provided that the electron temperature is lower than 106 K, see Draine & Salpeter (1979). The presence of dust, however, is in disagreement with the very low / ratio for this source. A possibility is that the size of the grains is significantly larger than in the interstellar medium (Salvati & Maiolino 2000; Maiolino et al. 2000); another possibility is that the optical/IR and X–ray absorbers are physically distinct, which is well possible as the optical and X–ray emission regions are certainly different.
| ( ) | ESO NTT | cloudy | Id. |
|---|---|---|---|
| 6563 | 298 | 70 | |
| 5007 | 1025 | 260 | O iii |
| 4959 | 320 | 90 | O iii |
| 4861 | 100 | 26 | |
| 4686 | 41 | 50 | He ii |
| 3869 | 136 | 10 | Ne iii |
5.2 NGC 1068
5.2.1 The model
Differently from the Circinus Galaxy, a single reflector cannot explain the X–ray spectrum of NGC 1068. In fact, it is impossible to have from a single region lines from neutral and He–like/H–like iron atoms. Indeed, Guainazzi et al. (1999) showed that at least three reflectors are needed. We used cloudy to derive the physical properties of these reflectors, which in the following will be called the cold, warm and hot reflectors.
The need for a third reflector arises from the presence of the O vii fluorescent line. It can be produced in the cold, thick reflector (which, as in Circinus, can be naturally identified as the torus itself), but constraining the ionization parameter to be too low to allow the production of all the other lines, except for the ‘neutral’ Fe . On the other hand, in the hot reflector, responsible for the He– and H–like iron lines, all the lighter elements are fully stripped. The Mg, Si and S lines must therefore be produced in a third reflector, the warm one.
Let us investigate the characteristics of the three reflectors in more detail. The illuminating radiation has been modeled as a power law with photon index 2.13 (Matt et al. 1997). The cold reflector is made of low ionized material and can be identified with the inner walls of the torus. We thus used a column density of (Matt et al. 1997) and an electron density of , corresponding to an outer radius of 30 pc. The best ionization parameter is , with a temperature of . The ionization structures for some elements are shown in Fig. 6.


The warm reflector produces most of the remaining observed lines, except for the Fe xxv and Fe xxvi lines. The best ionization parameter is , and the temperature is . The ionization structures for some elements are shown in Fig. 7: the oxygen is fully stripped, while Fe xxv and Fe xxvi have low abundances. We used a column density of and an electron density of (see below).


The lines from the ionized iron come from the hot reflector, with a column density similar to that of the warm one but an ionization parameter of . The ionization structure for some elements are shown in Fig. 8: all elements but iron are fully stripped.


The values adopted for the column densities of the warm and the hot reflectors have two justifications. The first constrain, which concerns the hot reflector only, is from the EWs of the ionized iron lines which, as we will see in the next section, are in good agreement with the results of Matt, Brandt & Fabian (1996) with . The other constrain, which applies to the sum of the two reflectors, comes from the amount of the ionized reflection continuum, considering its dependence from the nuclear luminosity of the source:
| (6) |
where is the covering factor and is the Compton optical depth. Assuming the observed ASCA value for the warm reflection component, , we can have an estimate of the nuclear X–ray luminosity:
| (7) |
Since the X-ray luminosity of NGC 1068 is estimated to be around [Iwasawa, Fabian & Matt 1997] (corresponding to a bolometric luminosity of a few adopting the SED of Elvis et al. (1994), roughly in agreement with the estimate of Pier et al. 1994), we see from (7) that we should use . This is also the value adopted by [Guainazzi et al. 1999].
Finally, from the analysis of the EW of the lines it can be shown (see next section) that the continua produced in the warm and in the hot reflectors should have column densities of the same order of magnitude, which justifies the above assumptions.
We can estimate the inner radius of the torus in NGC 1068 similarly to what have been done for Circinus. The difficulty here is that the nuclear luminosity and the density of the matter are not known. With the best guess values for these two quantities we have:
| (8) |
For a discussion of the probable X–ray luminosity see Iwasawa et al. (1997). For the density, we can only derive a lower limit. In fact:
| (9) |
with the outer radius of the torus in units of . The (9) is a lower limit both because the column density could be grater than , and because an upper limit on of (Risaliti et al. 1999) can be derived from the dynamical mass (Thatte et al. 1997) and the mass of the gas itself measured from CO observations (Helfer 1997). Our estimate for the inner radius is in agreement with the water maser measurements of Gallimore et al. (1996), which have shown the presence of a keplerian disk with an inner radius and outer radius .
Following the same considerations made for Circinus, we reanalysed ASCA and BeppoSAX data using the pexriv model instead of pexrav. The fits are of the same statistical quality as the previous ones, with no significant changes in the values of the other parameters. The ionization parameter which minimizes the in BeppoSAX data is , marginally consistent with the one calculated by cloudy (: the conversion factor is different from the one we used in Circinus because the power law slope is different).
Finally, we can estimate the visible fraction of the reflecting surface in NGC 1068, comparing the fluxes of the Fe in our model with the observed one. We obtain:
| (10) |
using .
5.2.2 The line spectrum
Let us first discuss the iron line complex. In Tab. 6 the Fe lines from ASCA data are shown. All line energies were kept fixed in the fit, as well as the Fe flux ( of ). The EWs are calculated against the reflection continuum of the material that produces the line: Fe and against the cold reflection component (pexra(i)v model in Xspec, cold reflector in cloudy), while Fe xxv and Fe xxvi against the ionized component (power law in Xspec, hot reflector in cloudy).
| E (keV) | EW (eV) | Ident. |
|---|---|---|
| 6.40∗ | Fe ‘neutral’ | |
| 6.70∗ | Fe xxv | |
| 6.96∗ | Fe xxvi | |
| 7.06∗ | Fe ‘neutral’ |
We compared the observational results for the iron lines with the work of Matt, Brandt & Fabian (1996) (from now on MBF96), because it is specifically devoted to this problem, while we continue using cloudy to calculate the relative abundances of the iron ions.
As discussed by MBF96, the Fe xxv line is emitted both by resonant scattering and recombination; in the moderately thick case (for the resonant line) of , its EW can be expressed as:
| (11) |
(see Fig. 5 of MBF96) where is the ion abundance calculated by cloudy. We must remember that this equivalent width has to be multiplied by a factor (see previous section) to be compared with the observed one:
| (12) |
The EW of the Fe xxvi line can be expressed in a similar way:
| (13) |
Using , as calculated by cloudy, and the estimate of (eq.12), we have:
| (14) |
in good agreement with the observations. The value in (12) is, therefore, consistent with both the ionized iron lines produced in the hot reflector.
In Tab. 7 all the other lines observed by ASCA are shown. Almost all these lines are produced in the warm reflector: therefore, in the table are also reported the EWs multiplied by a factor which is our estimate for the contribution of the warm reflector alone (see below). From (12), this implies . This is the value used for the metal abundances in our model: in this case, being the material optically thin, the dependence of the EWs from is linear. Like in Circinus, emission lines have been blended when necessary: the results are summarized in Tab. 8.
| E (keV) | EW (eV) | Ident. | |
|---|---|---|---|
| observed | |||
| Fe l | |||
| Fe l | |||
| Mg xi | |||
| Si xiii | |||
| Si xiv | |||
| S xv - Si xiv | |||
| S xvi | |||
| Ar xvii | |||
| (keV) | EW (eV) | Id. | E (keV) |
|---|---|---|---|
| Si xiii | 1.85 | ||
| 1.85 | 1070 | Mg xii | 1.87 |
| Mg xii | 1.91 | ||
| 2.01 | 640 + 960∗ | Si xiv | 2.01 |
| 2.29 | 860 | Si xiii | 2.29 |
| S xv | 2.45 | ||
| 2.50 | 1210 | Si xiv | 2.50 |
| Si xiv | 2.55 | ||
| 2.60∗ | 1000 | Si xiv | 2.60 |
| 3.11 | 570 | Ar xvii | 3.08 |
| S xv | 3.14 |
Our choice for is justified by the comparison of Tab. 8 with Tab. 7. The choice of and is the one which gives a good agreeemnt between model and observations. With these parameters, the comparison is satisfying apart from a deficit in the Si lines. Regarding the lines at energies lower than , the model spectrum is too rich to allow for a useful comparison with the data, as already noted for Circinus.
The O vii line is produced, as explained in the previous section, by the cold reflector: its observed EW, calculated against the pexriv continuum is . This value is in good agreement with our model, which predicts , if we assume, as it seems reasonable, also for the cold reflector. Incidentally, it should be noted again that the assumption of linear dependence of EWs from in optically thick materials is not necessarily a good one.
The Fe at is also produced in the cold reflector. The equivalent width measured by ASCA () is rather low when compared with the results of MBF96, taking also into accont the metal overabundance discussed above, which implies a further increase of the line flux by a factor of . This correction contributes to make the EW of the ‘neutral’ Fe not consistent with ASCA data: using a mean inclination angle, our model predicts a value of , a factor two larger than the observed one. On the other hand, BeppoSAX data are in agreement with ASCA, giving an equivalent width just slightly higher (). This problem has no obvious solutions at present.
6 Summary
The results of our analysis may be summarized as follows:
For the Circinus Galaxy, a single, mildly ionized and optically thick reflector can explain the line spectrum and most of the continuum. Only the soft excess remains unexplained, and it may be related to the starburst region. Recently, Sako et al. (2000) have modeled the line spectrum of Circinus with the sum of a cold and thick plus an ionized and thin reflectors. At the spectral resolution of ASCA, both models are tenable. We only note that our model is simpler, making use of only one, instead of two, reflectors. High resolution observations with the gratings onboard Chandra and XMM– will certainly clarify this issue.
In NGC 1068, instead, at least three reflectors are needed, one low, one mildly and one highly ionized. (A thermal–like component, probably associated with the extended emission discovered by ROSAT/HRI, see Wilson et al. 1992, dominates in the soft X–ray band). In comparison with the Netzer & Turner (1997) model, our scenario for the line spectrum is necessarily more complex, because the detection of the O vii line by requires one more reflector. On the other hand, contrary to Netzer & Turner(1997) and following MBF96 and Iwasawa, Fabian & Matt (1997), we identify the low ionized reflector with the very thick absorber (Matt et al. 1997), so reducing by one the number of regions needed to explain the overall spectrum.
We identify the reflector in Circinus, and the low ionized one in NGC 1068, with the inner and visible part of the material responsible for the X–ray absorption. With this assumption, we estimate for the inner radius of the absorber a value of 0.2 pc for Circinus and of a few parsecs for NGC 1068.
Acknowledgments
We thank Roberto Maiolino, Alessandro Marconi and Fabrizio Nicastro for useful discussions, and the referee for useful comments and suggestions. SB and GM acknowledges ASI and MURST (grant cofin98–02–32) for financial support.
References
- [b87] Barvainis R., 1987, ApJ 320, 537
- [Brinkmann, Siebert & Boller 1994] Brinkmann W., Siebert J., Boller T., 1994, A&A, 281, 355
- [dl] Dickey J.M., Lockman F.J., 1990, ARA&A, 28, 215
- [d92] Done C., Mulchaey J. S., Mushotzky R. F., Arnaud, K. A., 1992, ApJ 395, 275
- [ds] Draine B.T., Salpeter E.E., 1979, ApJ, 231, 77
- [el] Elvis M., Lawrence A., 1988, ApJ 331, 161
- [] Elvis M., et al., 1994, ApJS 95, 1
- [hazy] Ferland G.J., 1997, University of Kentucky, Internal Report
- [gal96] Gallimore J. F., Baum S. A., O’Dea, C. P., Brinks E., Pedlar A., 1996, ApJ 462, 740
- [ghm] Ghisellini G., Haardt F., Matt G., 1994, MNRAS 267, 743
- [gr97] Greenhill L.J., Ellingsen S.P., Norris R.P., et al., 1997, ApJ 486, 147
- [Guainazzi et al. 1999] Guainazzi M., Matt G., Antonelli L.A., Bassani L., Fabian A.C., Maiolino R., Marconi A., Fiore F., et al., 1999, MNRAS 310, 10
- [g00] Guainazzi M., Molendi S., Vignati P., Matt G., Iwasawa K., 2000, New As., 5/4, 235
- [he97] Helfer L., 1997, Ap&SS 248, 51
- [Iwasawa, Fabian & Matt 1997] Iwasawa K., Fabian A.C., Matt G., 1997, MNRAS 289, 443
- [i99] Iwasawa K., 1999, MNRAS, 302, 96
- [k89] Koyama K., et al., 1989, PASJ 41, 731
- [k99] Krolik J., 1999, Active Galactic Nuclei, Princeton University Press
- [mz] Magdziarz P., Zdziarski A.A., 1995, MNRAS 273, 837
- [mfr] Matt G., Fabian A.C., Ross R.R., 1993, MNRAS 262, 179
- [mmo] Maiolino R., Marconi A., Oliva E., 2000, A&A, in press
- [Matt, Brandt & Fabian 1996] Matt G., Brandt W.N., Fabian A.C., 1996, MNRAS 280, 823
- [Matt et al. 1996] Matt G., Fiore F., Perola G.C., Piro L., Fink H.H., Grandi P., Matsuoka M., Oliva E., et al., 1996, MNRAS 281, 69
- [Matt et al. 1997] Matt G., Guainazzi M., Frontera F., Bassani L., Brandt W. N., Fabian A. C., Fiore F., Haardt F., et al., 1997, A&A 325, L13
- [Matt et al. 1999] Matt G., Guainazzi M., Maiolino R., Molendi S., Perola G. C., Antonelli L. A., Bassani L., Brandt W. N., et al., 1999, A&A 341, L39
- [m00] Matt G., Fabian A.C., Guainazzi M., Iwasawa K., Bassani L., Malaguti G., 2000, MNRAS, in press
- [mh] Monier R., and Halpern J.P., 1987, ApJ 315, L17
- [n96] Netzer H., 1996, ApJ 473, 781
- [nt97] Netzer H., Turner T.J., 1997, ApJ 488, 694
- [ntg98] Netzer H., Turner T.J., George I.M., 1998, ApJ 504, 680
- [omm] Oliva E., Marconi A., Moorwood A.F.M., 1999, A&A 342, 870
- [pi94] Pier E.A., Antonucci R., Hurt T., Kriss G., Krolik J., 1994, ApJ 428, 124
- [r99] Risaliti G., Maiolino R., Salvati M., 1999, ApJ 522, 157
- [Ruiz et al. 2000] Ruiz M., Alexander D.M., Young S., Hough J., Lumsden S.L., Heisler C.A., 2000, MNRAS, 316, 49
- [sm00] Salvati M., Maiolino R., 2000, in Large-scale Structure in the X-ray Universe, eds. M. Plionis and I. Georgantopoulos, Atlantiscience, p.277
- [smfk] Siebenmorgen R., Moorwood A., Freudling W., K ufl H.U., 1997, A&A 325, 450
- [sdp] Smith D.A., Done C., Pounds K.A., 1993, MNRAS, 263, 54
- [th97] Thatte N., Quirrenbach A., Genzel R., Maiolino R., Tecza M., 1997, ApJ 490, 238
- [u94] Ueno S., Mushotsky R.F., Koyama K., et al., 1994, PASJ 46, L71
- [Wilson et al. 1992] Wilson A.S., Elvis M., Lawrence A., Bland-Hawthorn J., 1992, ApJ 391, L75