HD 172481: a super lithium-rich metal-deficient
post-AGB binary with a red AGB companion
We present in this paper a study on the peculiar supergiant HD 172481. Its spectral type (F2Ia), high galactic latitude ( = 1037), circumstellar dust, high radial velocity and moderate metal deficiency ([Fe/H] = 0.55) confirm the post-AGB character of this object. A detailed chemical analysis shows slight but real s-process overabundances, however no CNO-enhancement was detected. Furthermore, the spectral energy distribution and the TiO bands in the red part of the spectrum reveal a red luminous companion. The luminosity ratio of the hot F type component and this cool M type companion LF/LM is derived for a reddening of E(B-V) = 0.44 (LF/LM 1.8) and indicates that the companion must also be strongly evolved and probably evolving along the AGB. Neither our photometric data-set, nor our radial velocity monitoring show evidence for orbital variability which may indicate that the period is too large for direct binary interaction. Most interestingly, a strong lithium resonance line is detected, which yields an abundance of = 3.6. Several explanations for this large lithium content are explored.
Key Words.:
Stars: abundances – binaries: spectroscopic – Stars: chemically peculiar – Stars: individual: HD 172481 – Stars: AGB and post-AGB – Stars: evolution1 Introduction
Although the research on the late stages of stellar evolution gained enormous momentum thanks to the IRAS survey back in the beginning of the eighties, a detailed understanding of the final stellar evolution in general and of the post-AGB phase in particular, is still lacking. Since the evolutionary time for an object to cross the HR diagram from the tip of the AGB to the planetary nebula phase is short (100-10000 years depending on the core-mass; e.g. Blöcker 1995) the objects are rare and the significance of results on individual objects is difficult to extrapolate to the whole AGB stellar evolution theory.
Moreover, in recent years it became clear that binarity can influence the final stages in many ways. This complicates the general observational picture since results on disguised binaries may lead to misinterpretations when confronted with single star evolution theory. Stars like the Red-Rectangle, which were longtime considered to be proto-typical post-AGB objects, were later discovered to be evolved interacting binaries (Waelkens et al. 1996). More recently, ISO results on the detailed infrared analysis of the circumstellar dust spectra revealed that also the dust evolution can be quite different in binaries than in single stars (e.g. Waters et al. 1998, Molster et al. 1999). There is growing observational evidence that in evolved binaries with a wide period distribution, part of the circumstellar material is trapped somewhere in the system. This has a strong impact on the chemical and dynamical evolution of the system (e.g. Van Winckel et al. 1995, 1999; Jura & Kahane 1999). Thanks to the trapped dust, binaries will have a prolonged IR lifetime so any sample of post-AGB objects defined on IR measurements will be biased towards binarity (Waters et al. 1997; Van Winckel 1999).
Since the stellar luminosity increases by large factors (a typical L∗ is between 3000-8000 L☉) during stellar evolution, most of the systems with one component in a post-AGB evolutionary phase, are single-lined spectroscopic binaries (SB1). Double-lined binaries should be rare since they must consist of two, almost equally luminous and thus almost equally evolved objects. The initial mass of both stars must have been therefore extremely similar.
One possible such object was found to be AFGL 4106 (Molster et al. 1999, Van Loon et al. 1999) but it was recognized to be a massive double evolved system consisting of a massive F-type post-red-supergiant and an M-type red supergiant. The spectral energy distribution (SED hereafter) is complex (see Fig. 2 and 5 in Molster et al. 1999) with the F-type dominating the UV and optical wavelengths while the M-type component dominates the near-IR. In the far-IR the huge cool dust component is clearly observed. The luminosity ratio of LF/LM=1.8 was found with an estimated total luminosity of LF = 1.3 105 L☉ assuming a distance of 3.3 kpc (Molster et al. 1999).
In this paper we discuss in detail another such rare double evolved SB2 system: HD 172481 (Table 1). The binary consists of a luminous F-type star, probably in a post-AGB evolutionary stage, and an M-type luminous companion, probably evolving on the AGB. The paper is organized as follows: in Sect. 2 we give an overview of the divers observational data we acquired during the last years. In Sect. 3 we list all the observational evidence for the binary SB2 nature of the system; we construct and discuss the spectral energy distribution (SED) and give the spectral indications of the cool component. In Sect 4 we focus on the photospherical chemical composition of the F-type component and discuss the high Li content. The overall discussion on the system is given in Sect. 5 while the summary of the main conclusions is given in Sect. 6.
| HD 172481 | ||
|---|---|---|
| Coordinates | 18 41 36.96 | |
| 27 57 01.2 | ||
| Galactic | 6.72 | |
| coordinates | 10.37 | |
| Mean Magnitude | B | 9.58 |
| V | 9.09 | |
| Spectral type | F2Ia0 | |
2 Data
2.1 Photometry
We obtained 54 photometric datapoints of HD 172481 in the Geneva photometric system during several runs (1989-1996) within the framework of our photometric monitoring program of optically bright post-AGB candidate stars (e.g. Bogaert 1994). The Geneva V magnitudes are displayed Fig. 1. The object is found to be clearly variable with a small peak to peak amplitude of 0.22 magn. in V, much larger than the estimated observational error of 0.005–0.007 magn (Rufener & Nicolet 1988). The near-IR JHKLM photometry was taken with the ESO 1m telescope during the night of 15 to 16/8/92. For the construction of the SED (Sect. 3.2) we used the mean magnitudes of the Geneva and near-IR data complemented with photometry from Humphreys (1975), Olsen (1984) and the IRAS PSC via the SIMBAD database. The Geneva photometric measurements can be obtained from the authors upon request.
2.2 Radial Velocities
Our sample of radial velocities was obtained with the CORAVEL radial velocity spectrometer installed at the Danish 1.5m telescope at La Silla, Chile. Since the spectrum is correlated with a hardware mask of Arcturus (K2III), always the same lines contribute to the radial velocity determination which makes this sample very homogeneous. The Arcturus mask can be used for supergiants with spectral type up to F0 and the velocities have an accuracy of 0.5 km s-1 (Baranne et al. 1979). Some recent velocity measurements obtained with the CORALIE spectrograph mounted on the new Swiss Euler telescope at La Silla and also the velocities from our high resolution spectra (Table 2 for details) were added to this sample. All velocity data are plotted in Fig. 1.

2.3 Spectra
High resolution, high signal-to-noise spectra were taken with the Utrecht Echelle Spectrograph (UES) mounted on the 4.2m William Herschel Telescope (WHT) located on La Palma, Spain, with the EMMI Spectrograph mounted on the 3.5m New Technology Telescope (NTT) located in La Silla, Chile, and with the Fiber-fed Extended Range Optical Spectrograph (FEROS) installed at the ESO 1.52-m telescope also at La Silla. A log of the observations can be found in Table 2.
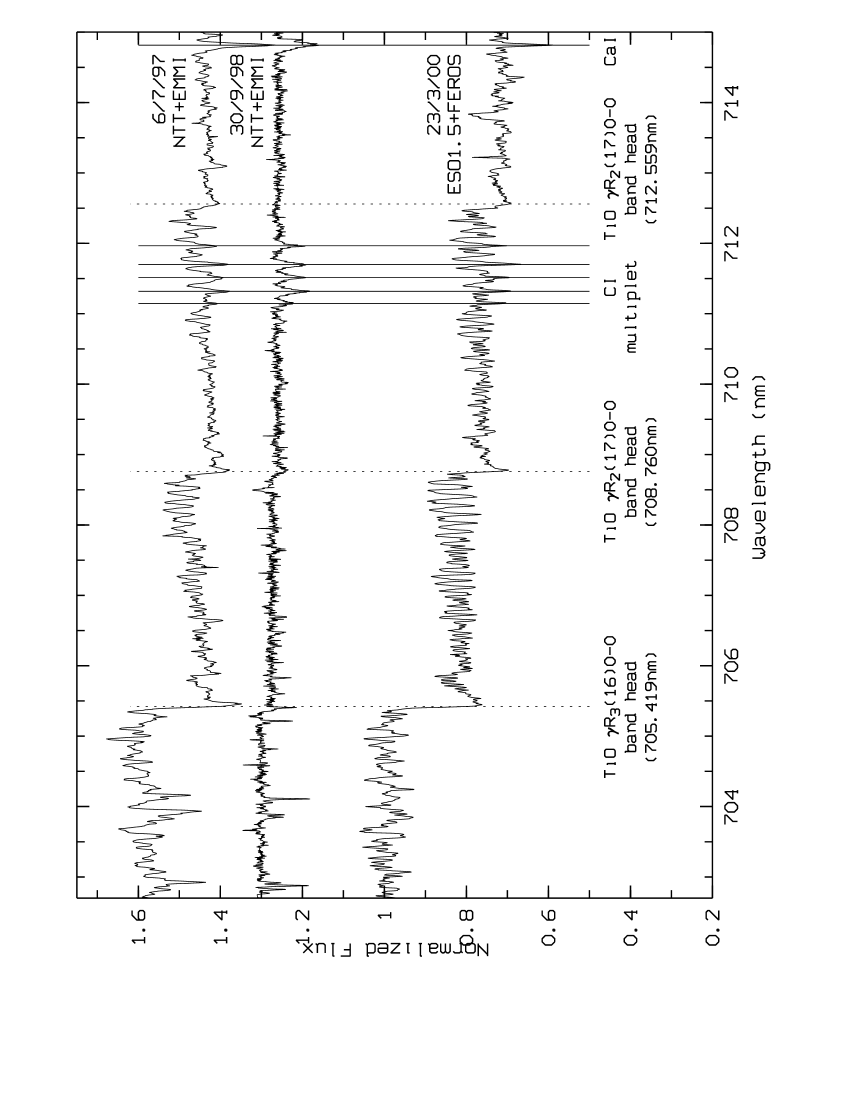
The WHT and NTT spectra were standard reduced using the specific echelle package of the MIDAS data analysis system and included order tracing, bias correction, cosmic hits identification and cleaning, scattered light subtraction and flat fielding. The orders were extracted by using a simple sum of the pixels and the wavelength calibration was performed using a ThAr spectrum. During the NTT measurement of 1998 the internal focus of the instrument camera jumped with a small amount of encoder steps, so the full resolution was not obtained. For the FEROS spectrum, we used the pipeline reduction which includes all steps of a standard echelle reduction. All spectral orders were normalized by fitting the continuum through interactively defined continuum points. Sample spectra can be found in Fig. 2, 3, 6 and 7.
| Date and UT | Telescope+ | Sp. Range | Resolving | s/n | s/n | |
| Spectrograph | (nm) | Power | @ 447 nm | @ 603 nm | (km s-1) | |
| 6/08/1995 22:34 | WHT+UES | 364-456.5 | 135 | 84.31.7 (56 lines) | ||
| 7/08/1995 22:33 | WHT+UES | 453-680 | 50,000 | 175 | 85.81.6 (130 lines) | |
| 6/07/1997 07:46 | NTT+EMMI | 580-1044 | 140 | 84.72.3 (45 lines) | ||
| 30/09/1998 03:06 | NTT+EMMI | 580-1044 | 60,000 | 85 | 85.61 | |
| 23/03/2000 09:48 | ESO1.5+FEROS | 353-921.5 | 48,000 | 130 | 120 | 82.22 |
| 1correlation technique with EMMI spectrum of 6/07/1997; 2correlation technique with UES spectrum of 7/08/1995 | ||||||
3 HD 172481 as SB2
3.1 TiO-bands
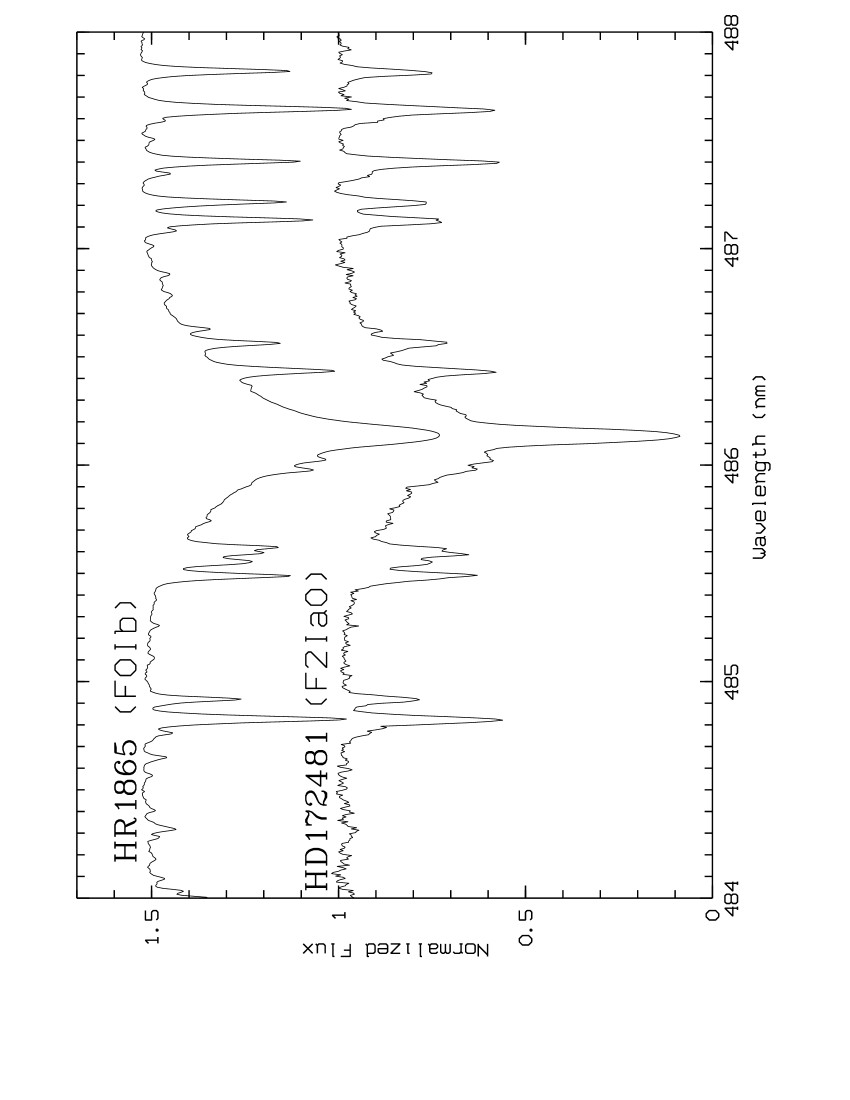
The optical high-resolution spectra confirm the F-spectral type given in SIMBAD which is illustrated in Fig. 2. However, in the 1995 UES spectra, we realized a decreasing S/N with increasing wavelength, and we attributed this to the increasing contribution of a cool companion. Our assumption was confirmed by the detection of strong red TiO band heads in our 1997 EMMI spectra, and later in the 2000 FEROS spectra (Fig. 3). This is a clear indication that a red companion is contributing to the total spectrum of HD 172481. Moreover, the strength of these bands is clearly variable as evidenced by our 1998 EMMI spectra (see also Fig. 3), pointing to a high amplitude variation of the companion. In the latter spectrum, only weak TiO band heads can be seen, but a clear CI multiplet could be identified. Since the TiO bands are clearly visible, the cool component must be of spectral type M but a more precise spectral classification is difficult due to the composite nature of the spectrum.
3.2 SED
In Fig. 4, the spectral energy distribution (SED) of HD 172481 is compiled from the photometric data. We used model atmospheres of Kurucz (Kurucz 1993) to fit the data. We adopted the atmospheric parameters of our abundance analysis (Sect. 4; Teff = 7250 K, = 1.5). By calculating synthetic Geneva colour indices using the passbands from Rufener & Nicolet (1988) and the above Kurucz model, we obtained a total reddening of E(B-V) = 0.44, which is somewhat higher than the value published by Bersier (1996): E(B-V) = 0.271. Using a single object, the fit of only the F-type model atmosphere clearly did not satisfy from about nm redwards and the spectral characteristics were unlike dust emission. To fit all the data we invoked a second, cool component, with Teff=3500 K but the model parameters of the cool component are only derived by a few photometric points and are therefore highly uncertain. Since, however, the F component is clearly a luminous object, also the M component must be luminous. The luminosity ratio of both components is found to be LF-type/LM-type = 1.8 but this is rather dependent on the adopted reddening: a lower reddening of E(B-V) = 0.2 would decrease this ratio to 1. The integration of the dereddened photometry gives a luminosity of the F-type component of 600 d2 L☉ with d in kpc.
In Table 3 we list the contribution of the F-star to the total composite spectrum for some reference wavelengths. From about 975 nm redwards, the cool component is more luminous than the F-component.
| (nm) | % | % | |
|---|---|---|---|
| 301 | 100 | 801 | 60 |
| 401 | 99 | 901 | 52 |
| 501 | 96 | 1002 | 48 |
| 601 | 84 | 1102 | 43 |
| 701 | 74 | 1202 | 37 |
In addition to the two stellar components, the IRAS fluxes (, , , ), which are also plotted on Fig. 4, point to a cool infrared excess which we interpret as caused by a circumstellar dust shell or disk. A small excess seems to be already present in the L (3.8 m) and M (4.7 m) photometric bands and might indicate a present day mass-loss of the cool component. Clearly more infrared data is needed to characterize the properties of the M-type component.

We can conclude that the SED consists of 3 components: a luminous F component dominating the UV and visible part of the spectrum, a luminous M component dominating the near-IR and a cool dust envelope dominating the IRAS fluxes.
3.3 Photometry and Radial Velocity
It is clear from Fig. 1 that HD 172481 is variable, in magnitude as well as in radial velocity. Despite the poor sampling, several techniques (clean Roberts et al. 1987, pdm Stellingwerf 1978, and scargle Scargle 1982, Horne & Baliunas 1986) were used to find a period (pulsational or orbital) in these data, but none of them yielded a convincing stable period, in the sense that the folded light curve never satisfied. Nevertheless, by fitting details of the light curve as has been done in Fig. 5, we can conclude that HD 172481 is a semi-regular pulsator varying with a timescale of about 100 days.
One can argue that the variability in the photometry is induced by a variable contribution of the M-type companion in the Geneva V filter. However, this seems very unlikely because the latter filter is centered around 549 nm where the contribution of the cool companion is only 10% (Table 3). Moreover, this filter correlates well with the U photometric filter ( = 346 nm) for which the contribution is negligable. Even in the G filter ( = 581 nm), no clear trace of a variable contribution could be found. In addition, one would expect a larger amplitude if the pulsation is (also) due to the cool AGB star: an amplitude of 0.2 mag. is rather usual for post-AGB stars.
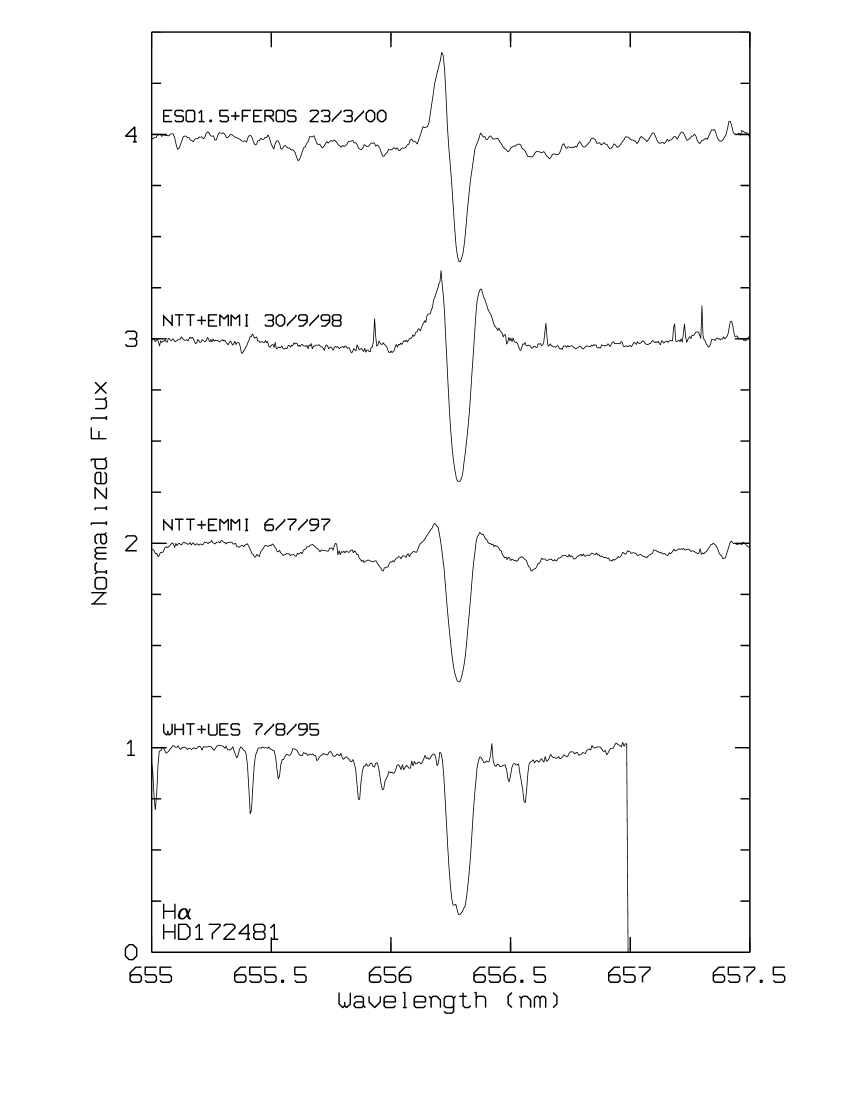
In Fig. 6 we present our high resolution spectra around the H line. The line exhibits a shell type profile, an emission profile that is found in almost all other optically bright post-AGB candidate stars (e.g. Waters et al. 1993; Oudmaijer & Bakker 1994; Van Winckel et al. 1996). It is still unclear which mechanism is responsible for the variable H emission in the spectra of post-AGB stars. A recent photometric and spectroscopic study about the nature of the pulsation of the bright post-AGB star HD 56126 (Barthès et al. 2000) suggests that the irregular pulsation probably originates from the interaction between the photospheric dynamics and the dynamics of the higher atmospheric layers. Shock waves are generated when the receding photospheric layer collides with the upcoming one and probably play a major role both in driving the pulsation and limiting its amplitude.
Although a peak-to-peak amplitude of 17 km s-1 is observed, we could not discover a long-term trend in the radial velocity data which would point to resolved binary motion. This could be a projection effect, if we view the system on a unfavourable inclination, but is likely due to the long orbital period and hence very small velocity amplitude. Assuming typical masses for the post-AGB and AGB objects (F-type = 0.6 M☉ and M-type = 1.0 M☉), an inclination of 60∘ and a velocity amplitude of 5 km s-1, we obtain a period of 51 years. Note that the CORAVEL mask is defined in the blue ( nm) so the contribution of the M-component in negligable.
We can conclude that both the light curve and the radial velocity data give evidence for the complex and not well understood variability of the atmospheric layers seen in most post-AGB stars. This is further strengthened by the variable H emission. Evidence for binary induced photometric variability or orbital motion is not observed, which is probably indicative of a long orbital period. The radial velocity sample indicates too long an orbital period to expect direct interaction during stellar evolution.

4 Chemical Analysis
We performed a detailed abundance analysis on our UES spectra to gain insight into the evolutionary status of the F-type component. We confined our analysis to these two spectra for several reasons: due to the increasing contribution of the cool companion at longer wavelengths, we decided not to use the EMMI spectra since they concentrate on the red region of the optical spectrum. Since many useful lines are situated in the blue and green region a significant chemical study can still be performed on this limited spectral domain. Moreover, the UES spectra display a very good signal-to-noise.
Apart from the resolution difference, the quality of the FEROS spectrum is very similar to the UES spectra (Fig. 7), but a comparison of the red region reveals that the contribution of the cool companion was larger during the FEROS run. Therefore, we preferred to use solely our UES spectra for the chemical analysis.
4.1 Line data and Atmospheric Parameters
In order not to compromise the results of a chemical analysis, one has to take care that only lines with well determined oscillator strengths (-values) are selected. A list of such lines useful for the chemical analysis of A and F type stars has been collected at our institute during the past few years and is still regularly updated. We described this list in detail in Van Winckel & Reyniers (2000). The list we used for HD 172481 is essentially the same since only a few lines were added.
We used the CDROM-grid of LTE model atmospheres by Kurucz (1993) in combination with his abundance calculation programme width9. The parameters of an atmospheric model are determined by forcing the computed abundance of Fe to be independent of excitation potential (determination of Teff), ionisation stage (gravity) and reduced equivalent width (microturbulent velocity). This method yielded Teff = 7250 K, log = 1.5 and = 4 km s-1. 48 Fe I-lines and 14 Fe II-lines were used to determine the appropriate atmospheric parameters. With this model, we also obtain a very good abundance consistency for all other chemical elements for which lines of two ionisation stages are available (Ca, Cr, Mn and Ni) confirming an accurate set of atmospheric parameters.
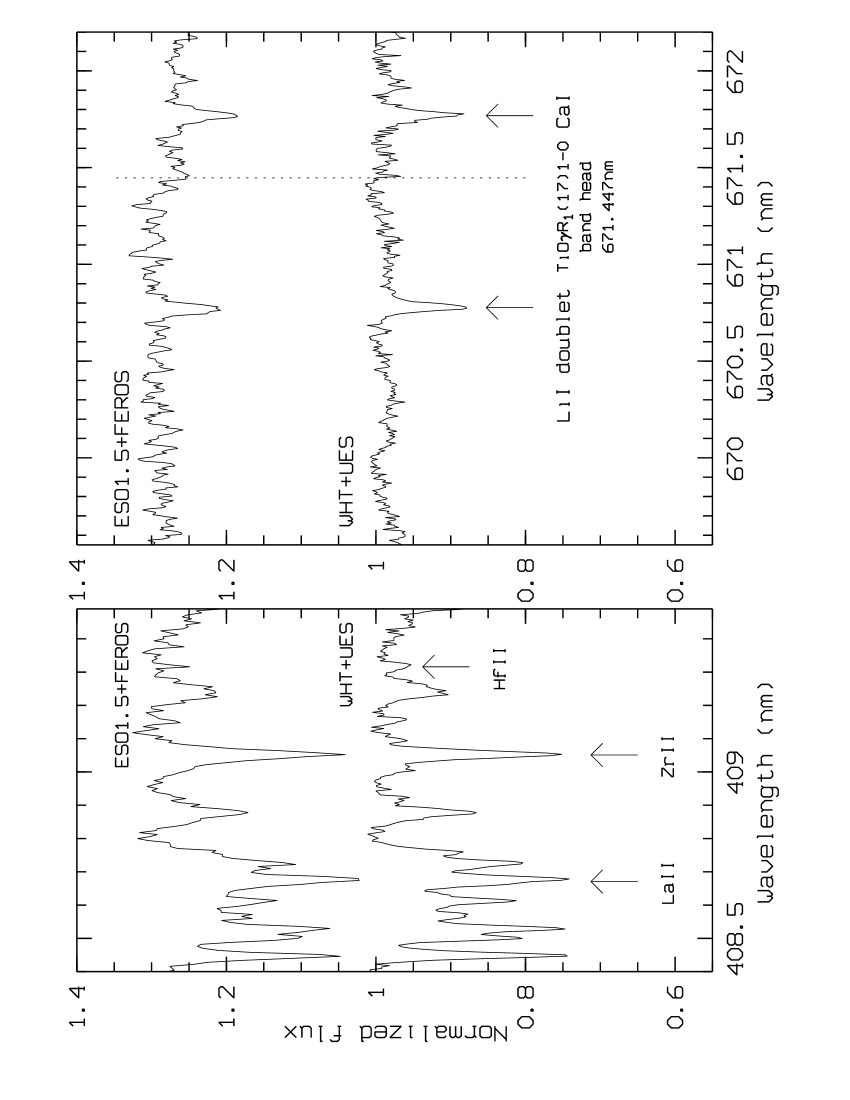
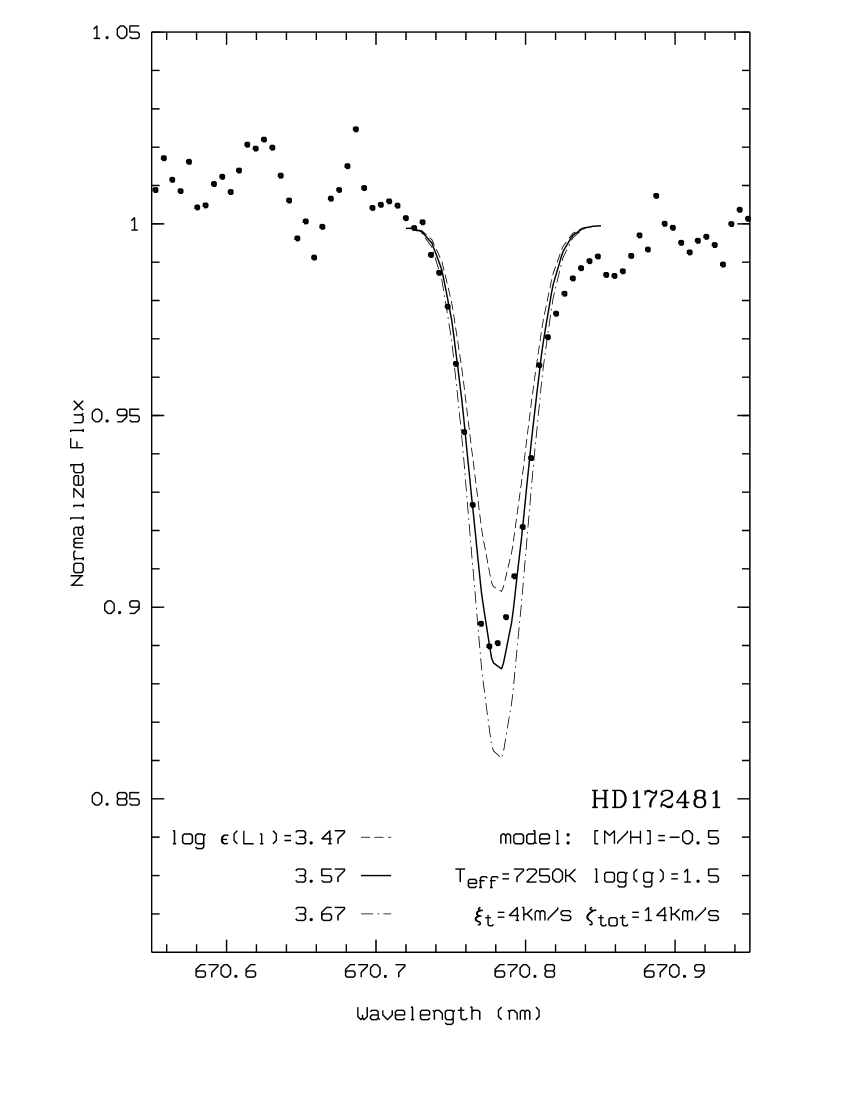
The equivalent widths of 209 lines (28 different ions) used in the analysis were measured, using direct integration for unblended lines and multiple Gaussian fitting for blended lines. A rather surprising discovery in the spectra we took is the presence of the strong Li resonance line at 670.8 nm (see Fig. 7 and 8). Before discussing in detail the overall results of the chemical analysis we focus on the determination of the Li abundance.
4.2 Li-abundance
The lithium abundance is derived by spectrum synthesis of the 670.8 nm region. Spectrum synthesis is used to account for the doublet structure of the Li resonance line. Line parameters are taken from Kurucz (1993) and are nearly the same as in Cunha et al. (1995). Kurucz’s program synthe was used to make the syntheses.
Synthetic spectra have to be convolved with a macroturbulent broadening function and with the instrumental broadening, to match the line widths of the observed spectrum. For the instrumental broadening we used a gaussian with a full width at half maximum given by the spectral resolution of the UES spectrograph: = 6 km s-1. The macroturbulent velocity is determined in the following way. We selected 17 clearly unblended lines of different width ( 150 mÅ) and different species. For each line, we calculated the abundance from the equivalent width using the width9-program. After that, we synthesized with the Kurucz spectral synthesis programme synthe each line using the obtained abundance. The total broadening velocity ( = +) is the only free parameter in this synthesis. We found a slight dependence of on the equivalent width of the line:
with a classical correlation coefficient of 0.93. We adopted for a value of 14 km s-1 (hence 12.6 km s-1) for the LiI-line, yielding a Li-abundance of using a least-squares fit (Fig. 8).
| parameter | symbol | variation | variation |
|---|---|---|---|
| continuum placement | low/high | 0.03 | |
| temperature | Teff | 250 K | 0.24 |
| gravity | 0.5 (cgs) | 0.11 | |
| microturb. velocity | 2 km s-1 | 0.03 | |
| broadening | 2 km s-1 | 0.04 | |
| non-LTE correction | 0.2∗ |
, estimated from Carlsson et al. (1994).
In Table 4 we investigate the sensitivity of the derived Li-abundance to the uncertainties in the stellar parameters. It is clear that the temperature is by far the most delicate parameter, though a variation of 250K (as in Table 4) is rather large. We estimate the uncertainty of the lithium abundance around 0.20 dex. To our knowledge, detailed non-LTE calculations of the Li I resonance line for this temperature-gravity domain are not available in literature, but an extrapolation of the results published by Carlsson et al. (1994) indicates that a non-LTE correction would not exceed 0.2 dex (i.e. ).
Adopting , we expect for the subordinate LiI-line at 610.36 nm an equivalent width of = 5 mÅ. Unfortunately, this line is blended with a FeII-line (610.350 nm). Nevertheless, an upper limit for the Li-abundance can be derived from this line: . The LiI-line at 812.645 nm has a calculated equivalent width of 0.6 mÅ and is obviously not detectable on our spectra.
4.3 Overall results of the chemical analysis
The derived abundances of all other elements are summarized in Table 5; a graphical representation can be found in Fig. 9. Besides the lithium line at 670.8 nm, also the resonance line of europium ( 412.973 nm) was treated with spectrum synthesis, in order to account for the strong hyperfine splitting of this line. The hyperfine data were taken from Biehl (1976).
The carbon (C) and oxygen (O) abundances are well established, using the multiplets at 615.6 nm and 645.4 nm for oxygen. Carbon is clearly not enhanced, and the slight overabundance of oxygen ([O/Fe]=+0.2) is normal in this metallicity range (e.g. Boesgaard et al. 1999). A nitrogen (N) abundance was hard to obtain, because most useful N lines are situated in the red part of the spectrum, which we did not use in our analysis. The N abundance is derived from very small lines (equivalent widths 11, 5 and 7 mÅ). Consequently, one has to interpret the tabulated abundance () more as an upper limit rather than as a fixed abundance. We can conclude that also N is not enhanced.
No sodium (Na) enhancement is measured. The -elements Mg, Si, S, Ca and Ti are all enhanced with respect to iron, with a simple mean [/Fe]=0.36. Such a value is expected in this metallicity range (e.g. McWilliam 1997). The titanium (Ti) abundance is quite high, but it is deduced from rather strong lines (7 out of the 13 lines have 100 mÅ) and therefore very sensitive to the microturbulent velocity: an increase of 1 km s-1 in decreases the Ti abundance by 0.1 dex. Scandium (Sc) is also quite high, but this element behaves like an even-Z -element (Nissen et al. 2000) and it is also known to be slightly hyperfine structure sensitive. The high vanadium (V) abundance is less easy to explain, because normally it should follow the iron deficiency (Chen et al. 2000). The hyperfine structure sensitivity alone cannot explain this overabundance. We searched for other V II lines from the list of Biémont et al. (1989), but, using the extensive lists of Kurucz (1993) and the VALD-2 database (Kupka et al. 1999), all turned out to be blended. The iron peak elements (Cr, Ni, Zn) do follow the iron deficiency, only manganese (Mn) is slightly underabundant, which is also a Galactic evolution effect (Nissen et al. 2000).
Moderate but clear s-process overabundances are found for HD 172481. The strontium (Sr) abundance is very difficult to determine accurately since the resonance lines at 421.5 nm and 407.7 nm are heavily saturated and weaker optical lines are not present. The other two elements of the Sr-peak around the magic neutron number 50, yttrium (Y) and zirconium (Zr), have more usable lines and turn out to be clearly enhanced by 0.5 dex. For the heavy s-process elements around magic neutron number 82, the situation is less clear, due to the smaller amount of lines. Nevertheless, we feel confident that also the hs elements lanthanum (La) and cerium (Ce) are enhanced. Just like Sr, an accurate barium (Ba) abundance determination is difficult due to the lack of weak lines. For neodymium (Nd), we deduced an upper limit of ([Nd/Fe]0.0) from the non-detection of the line at 529.316 nm. We did the same for samarium (Sm) and obtained ([Sm/Fe]0.1) from the non detection of the 453.794 nm line. The r-process element europium (Eu) is slightly overabundant relative to iron, but this behaviour is expected for this metallicity (e.g. Woolf et al. 1995). So Nd, Sm and Eu seem not to be intrinsically enhanced.
Surprisingly, we also detected a small line at 409.316 nm which we identified as Hf II (Fig. 7). The same line is detected in the heavily s-process enriched post-AGB stars (Van Winckel & Reyniers 2000). An abundance calculation with =12 mÅ yields a very high [Hf/Fe]=+0.6! This line is hardly detectable on our FEROS spectrum (also Fig. 7) and the abundance is extreme but we could not find possible blending lines. Other possibly detectable Hf lines are all blended. The significance of the high hafnium abundance should be further investigated.
| HD 172481 | |||||
| ion | N | [el/Fe] | |||
| Li I | 1 | ss | 3.57 | 0.20 | |
| C I | 11 | 36 | 8.01 | 0.01 | 0.11 |
| N I | 3 | 8 | 7.61 | +0.17 | 0.03 |
| O I | 5 | 26 | 8.47 | +0.16 | 0.14 |
| Na I | 2 | 32 | 5.76 | 0.02 | 0.12 |
| Mg I | 1 | 37 | 7.30 | +0.27 | |
| Si I | 5 | 16 | 7.41 | +0.41 | 0.12 |
| S I | 4 | 32 | 7.06 | +0.40 | 0.09 |
| Ca I | 15 | 55 | 5.99 | +0.18 | 0.14 |
| Ca II | 2 | 30 | 5.92 | +0.11 | 0.02 |
| Sc II | 4 | 85 | 2.97 | +0.42 | 0.03 |
| Ti II | 13 | 104 | 4.97 | +0.53 | 0.15 |
| V II | 1 | 61 | 3.85 | +0.40 | |
| Cr I | 8 | 21 | 5.17 | +0.05 | 0.11 |
| Cr II | 18 | 61 | 5.17 | +0.05 | 0.13 |
| Mn I | 3 | 21 | 4.62 | 0.22 | 0.01 |
| Mn II | 1 | 13 | 4.66 | 0.18 | |
| Fe I | 48 | 62 | 6.92 | 0.04 | 0.16 |
| Fe II | 14 | 68 | 6.96 | 0.15 | |
| Ni I | 18 | 27 | 5.77 | +0.07 | 0.16 |
| Ni II | 3 | 47 | 5.78 | +0.08 | 0.19 |
| Zn I | 2 | 32 | 4.17 | +0.12 | 0.03 |
| Y II | 6 | 42 | 2.17 | +0.48 | 0.06 |
| Zr II | 9 | 50 | 2.55 | +0.50 | 0.13 |
| La II | 4 | 70 | 1.27 | +0.60 | 0.04 |
| Ce II | 6 | 21 | 1.24 | +0.24 | 0.10 |
| Nd II | 0.9 | +0.0 | |||
| Sm II | 0.55 | +0.1 | |||
| Eu II | 1 | ss | 0.19 | +0.23 | |
| Hf II | 1 | 12 | 0.91 | +0.58 | |

5 Discussion
5.1 Post-AGB nature
In this section we list the arguments for the proposed post-AGB character of our object.
-
1.
The high galactic latitude (Tab. 1; = 1037),
-
2.
the large radial velocities (Fig. 1) and
-
3.
the moderate metal deficiency ([Fe/H]=0.55)
point to a population II membership. Furthermore,
-
4.
the SED (Fig. 4) shows the presence of dust, as a result of previous mass loss probably during the AGB phase.
-
5.
The photometry and the H profiles show a variability very similar to other post-AGB stars (Sect. 3.3).
-
6.
Finally, the slight s-process overabundances are probably the result of the third dredge-up, when He burning products are brought to the surface.
The last argument is, however, not straightforward. If we expect the signature of a 3rd dredge-up, also the CNO elements should be enhanced, which is clearly not detected: the total CNO abundance is equal to the initial value.
Binary post-AGB stars are often depleted, with a dust disk as an ideal site for the gas-dust separation (see Van Winckel 1999 for a review). Depletion alters the abundances profoundly. An ideal element to trace for possible depletion is zinc (Zn) with its low condensation temperature. A high [Zn/Fe] ratio points to efficient depletion. For HD 172481, [Zn/Fe]=+0.12, suggesting that no depletion process has taken place.
5.2 Li-rich evolved stars
Plez et al. (1993) published an abundance analysis of seven luminous AGB stars in the Small Magellanic Cloud. These moderately metal deficient stars ([Fe/H]=0.5) are Li rich, C poor and show a low 12C/13C ratio. The chemical pattern observed in these stars is explained by envelope burning, which is the activation of the H burning CN cycle at the base of the convective envelope (called “hot bottom burning” HBB). The Li abundance in these stars is typically , which is much larger than expected from standard AGB evolution where Li has been destroyed and/or diluted due to convection. The mechanism thought to be responsible for this Li production is the 7Be-transport mechanism (Cameron & Fowler 1971) in which 3He is converted to 7Li via the reaction chain 3He(4He,)7Be(Li. Theoretical models suggest that this mechanism can only be efficient in massive AGB stars (4-7 M⊙; e.g. Sackmann & Boothroyd 1992, Mazzitelli et al. 1999). Also massive galactic AGB stars with signs of envelope burning were found (García-Lario et al. 1999), but not yet extensively chemically analysed.
On the other hand, Li is found in many evolved stars in the AGB or post-AGB evolutionary phase for which there is strong observational evidence that many of these stars are low-mass objects with M23 M⊙: galactic low-mass C stars have been found with Li excesses of (Abia et al. 1993, Abia & Isern 1996, 1997, 2000); unexplained high Li abundances were also found in some metal poor population II post-AGB stars, which showed strong evidence of an efficient 3rd dredge-up: IRAS 22272+5435 (Začs et al. 1995), IRAS 05341+0852 (Reddy et al. 1997), IRAS Z02229+6208 and IRAS 07430+1115 (Reddy et al. 1999). It has been suggested by Reddy et al. (1999) that these stars could be the successors of the Li-rich carbon stars studied by Abia (see references above). However, a detailed abundance analysis of 12 J-type Li-enhanced carbon stars (Abia & Isern 2000) showed no s-process enhancements in these stars and a solar metallicity while the 12C/13C ratio is low. These J-type carbon stars are clearly chemically different from the 4 Li-enhanced metal-poor post-AGB stars with high 12C/13C ratios and strong s-process overabundances.
It is generally known that also among red giants ascending the 1st giant branch high Li-abundances can be found. Wasserburg et al. (1995) developed a non-standard mixing mechanism for these RGB stars to explain their low 12C/13C ratio (dubbed “cool bottom processing” CBP) and Sackmann & Boothroyd (1999) showed that CBP can account for the high lithium abundances observed in the RGB Li-rich K giants (de la Reza et al. 1997 and references therein). Moreover, they suggested that CBP might also occur in the TP-AGB phase (Boothroyd & Sackmann 1999). de La Reza et al. (1997) suggested that all K giants become Li-rich for a short time. During this period the giants are associated with an expanding thin circumstellar shell supposedly triggered by an abrupt internal mixing mechanism resulting in a surface Li enrichment. However, Jasniewicz et al. (1999) did not find any correlation between Li abundance and infrared excess in a sample of 29 late-type RGB giants with infrared excess. There are even Li-rich giants with no circumstellar dust.
Alternative external scenarios to explain the high lithium abundances invoke the accretion of a substellar object (objects). Such scenarios gained interest by the discovery of several extra solar planets and brown dwarf candidates around solar-type stars. Planets could be even commonly present around PNe (Soker 1999). Engulfment scenarios were developed (e.g. Siess & Livio 1999a,b), but cannot account for Li abundances exceeding the initial one and therefore fail to explain the very Li rich stars with (Siess & Livio 1999b). In other scenarios (Denissenkov & Weiss 2000) planet engulfment acts as the activating mechanism for the CBP, producing also these higher Li abundances.
We can conclude that the Li-enhancements in the low-mass C stars and the 4 metal-poor post-AGB giants emphasize our poor knowledge of the dredge-up and mixing processes or possible accretion during stellar evolution.
5.3 Li-enhancement in HD 172481
It is clear that planet engulfment (alone) cannot explain a Li abundance of = 3.57. “Hot bottom burning” (HBB) is thought to be responsible for the Li enhancements in moderately metal-poor luminous AGB stars (estimated initial mass 7 M☉) in the Small Magellanic Cloud (Plez et al. 1993). This scenario is theoretically thought to occur only in luminous AGB stars of initial mass 3-7 M☉ (Sackmann & Boothroyd 1992). The low metallicity and the kinematics of HD 172481 suggest an old and hence lower mass nature. Another argument against the HBB scenario for HD 172481 is the absence of a nitrogen enhancement. During the HBB, C is converted into N by the CN cycle. But possibly lithium production may have occurred without burning significant amounts of carbon.
On the other hand, the CBP mechanism may be relevant for the Li enhancement in HD 172481. The presence of circumstellar dust is in favour of de La Reza’s scenario, if applicable to low mass AGB stars. Unfortunately, we are not able to derive a 12C/13C ratio, which could shed some light on the deep mixing involved.
The recent surprising results of the chemical content of J-type carbon stars (Abia & Isern 2000) are interesting in many respects. The O-rich circumstellar dust which is observed in about 5%-10% of these objects (Lloyd Evans 1991) is difficult to reconcile with standard AGB evolution and led Little-Marenin (1986) and Lloyd Evans (1990, 1991) to conclude that the material expelled by the M-type progenitor was trapped and stored in a binary system. Recent CO measurements of J-type carbon stars confirm this scenario and point to a long-lived reservoir of oxygen rich dust (Jura & Kahane 1999). In the scenario proposed by Yamamura et al. (2000) to explain the ISO-SWS spectra of some J-type carbon stars, these stars are wide binaries in which the oxygen rich dust was stored around the unseen companion. Note, however, that no direct evidence of the binary nature of these stars exists yet. Since no large amplitude radial velocity variations are observed (Barnbaum et al. 1991), the eventual orbits must be rather wide and direct binary interaction by Roche-Lobe overflow is unlikely to have happened during evolution on the AGB. Whether the special chemical composition of these stars is linked to the proposed binarity in wide systems is still an open question.
For HD 172481 there is direct observational evidence for binarity in a probably wide system. Also this object shows very peculiar abundances with a high Li abundance, only very small overabundances of s-process elements and no strong C enhancement. Here, again, the eventual role of the binary nature of HD 172481 with respect to the remarkable chemical composition remains an open question.
6 Summary
We presented a study of the peculiar supergiant HD 172481, revealing it to be a double lined spectroscopic binary consisting of an F-type post-AGB star and an M type, probably AGB, companion. The post-AGB nature of the F type component is deduced from its spectral type; high galactic latitude; circumstellar dust; high radial velocity; moderate metal deficiency and slight overabundances of the s-process elements Y, Zr, La and Ce. The photometry and the H profiles show a variability very similar to other post-AGB stars. The spectral energy distribution and the TiO bands in the red part of the spectrum reveal binarity with a luminous M-type companion with a luminosity ratio of LF/LM=1.8 assuming a total reddening of E(B-V) = 0.44. The lack of a resolved long-term trend in the radial velocity data suggests a wide orbit. Most interesting, we found a very high lithium abundance of = 3.57. This abundance is difficult to reconcile with a “hot bottom burning” scenario because of the probably low mass nature of HD 172481. An alternative explanation can be “cool bottom processing” (Sackmann & Boothroyd 1999).
Acknowledgements.
Both authors acknowledge support from the Fund for Scientific Research – Flanders (Belgium). This research has made use of the SIMBAD database, operated at CDS, Strasbourg, France, and the Vienna Atomic Line Database (VALD2). The anonymous referee is warmly thanked for the constructive comments.References
- (1) Abia C., Isern J., 1996, ApJ 460, 443
- (2) Abia C., Isern J., 1997, MNRAS 289, L11
- (3) Abia C., Isern J., 2000, ApJ 536, 438
- (4) Abia C., Boffin H.M.J., Isern J., Rebolo R., 1993, A&A 272, 455
- (5) Baranne A., Mayor M., Poncet J.L., 1979, Vistas in Astronomy, 23, 279
- (6) Barnbaum C., Kastner J.H., Morris M., Likkel L., 1991, A&A 251, 79
- (7) Barthès D., Lèbre A., Gillet D., Mauron N., 2000, A&A 359, 168
- (8) Bersier D., 1996, A&A 308, 514
- (9) Biehl D., 1976, PhD thesis, Univ. Kiel
- (10) Biémont E., Grevesse N., Faires L.M., Marsden G., Lawler J.E., 1989, A&A 209, 391
- (11) Biémont E., Hibbert A., Godefroid M., Vaeck N., Fawett B.C., 1991, ApJ 375, 818
- (12) Biémont E., Hibbert A., Godefroid M., Vaeck N., 1993, ApJ 412, 431
- (13) Blöcker T., 1995, A&A 299, 755
- (14) Boesgaard A.M., King J.R., Deliyannis C.P., Vogt S.S., 1999, AJ 117, 492
- (15) Bogaert E., 1994, Ph. D. Thesis, K.U.Leuven
- (16) Boothroyd A.I., Sackmann J.-I., 1999, ApJ 510, 232
- (17) Cameron A.G.W., Fowler W.A., 1971, ApJ 164, 111
- (18) Carlsson M., Rutten R.J., Bruls J.H.M.J., Shchukina N.G., 1994, A&A 288, 860
- (19) Chen Y.Q., Nissen P.E., Zhao G., Zhang H.W., Benoni T., 2000, A&ASS 141, 491
- (20) Cunha K., Smith V.V., Lambert D.L., 1995, ApJ 452, 634
- (21) de La Reza R., Drake N.A., da Silva L., Torres C.A.O., Martin E.L., 1997, ApJ 482, L77
- (22) Denissenkov P.A., Weiss A., 2000, A&A 358, L49
- (23) García-Lario P., D’Antona F., Lub J., Plez B., Habing H.J., 1999. In: Le Bertre T., Lèbre A., Waelkens C. (eds.) Proc. IAU Symp. 191, Asymptotic Giant Branch Stars. ASP Conference Series, San Francisco, p. 91
- (24) Grevesse N., 1989. In: Waddington C.J. (ed.) AIP Conferences Series 183, Cosmic Abundances of Matter. American Institute of Physics, New York, p. 9
- (25) Hibbert A., Biémont E., Godefroid M., Vaeck N., 1991, A&ASS 88, 505
- (26) Horne J.H., Baliunas S.L., 1986, ApJ 302, 757
- (27) Humphreys R.M., 1975, A&AS 19, 243
- (28) Jasniewicz G., Parthasarathy M., de Laverny P., Thévenin F., 1999, A&A 342, 831
- (29) Jura M., Kahane C., 1999, ApJ 521, 302
- (30) Kupka F., Piskunov N.E., Ryabchikova T.A., Stempels H.C., Weiss W.W., 1999, A&ASS 138, 119
- (31) Kurucz R.L., 1993, CD-ROM set, Cambridge, MA : Smithsonian Astrophysical Observatory
- (32) Little-Marenin I.R., 1986, ApJ 307, L15
- (33) Lloyd Evans T., 1990, MNRAS 243, 336
- (34) Lloyd Evans T., 1991, MNRAS 249, 409
- (35) Mazzitelli I., D’Antona F., Ventura P., 1999, A&A 348, 846
- (36) McWilliam A., 1997, ARA&A 35, 503
- (37) Molster F.J., Waters L.B.F.M., Trams N.R., et al., 1999, A&A 350, 163
- (38) Nissen P.E., Chen Y.Q., Schuster W.J., Zhao G., 2000, A&A 353, 722
- (39) Olsen E.H., 1984, A&AS 54, 55
- (40) Oudmaijer R.D., Bakker E.J., 1994, MNRAS 271, 615
- (41) Plez B., Smith V.V., Lambert D.L., 1993, ApJ 418, 812
- (42) Reddy B.E., Parthasarathy M., Gonzalez G., Bakker E.J., 1997, A&A 328, 331
- (43) Reddy B.E., Bakker E.J., Hrivnak B.J., 1999, ApJ 524, 831
- (44) Roberts D.H., Lehár J., Dreher J.W., 1987, AJ 93, 968
- (45) Rufener F., Nicolet B., 1988, A&A 206, 357
- (46) Sackmann I.-J., Boothroyd A.I., 1992, ApJ 392, L71
- (47) Sackmann I.-J., Boothroyd A.I., 1999, ApJ 510, 217
- (48) Scargle J.D., 1982, ApJ 263, 835
- (49) Siess L., Livio M., 1999a, MNRAS 304, 925
- (50) Siess L., Livio M., 1999b, MNRAS 308, 1133
- (51) Soker N., 1999, MNRAS 306, 806
- (52) Stellingwerf R.F., 1978, ApJ 224, 953
- (53) Valenti J.A., Piskunov N., Johns-Krull C.M., 1998, ApJ 498, 851
- (54) Van Loon J. Th., Molster F.J., Van Winckel H., Waters L.B.F.M., 1999, A&A 350, 120
- (55) Van Winckel H., 1999. In: Le Bertre T., Lèbre A., Waelkens C. (eds.) Proc. IAU Symp. 191, Asymptotic Giant Branch Stars. ASP Conference Series, San Francisco, p. 465
- (56) Van Winckel H., Reyniers M., 2000, A&A 354, 135
- (57) Van Winckel H., Waelkens C., Waters L.B.F.M., 1995, A&A 293, L25
- (58) Van Winckel H., Oudmaijer R.D., Trams N.R., 1996, A&A 312, 553
- (59) Van Winckel H., Waelkens C., Fernie J.D., Waters L.B.F.M., 1999, A&A 343, 202
- (60) Waelkens C., Van Winckel H., Waters L.B.F.M., Bakker E.J., 1996 A&A 314, L17
- (61) Wasserburg G.J., Boothroyd A.I., Sackmann I.-J. 1995, ApJ 447, L37
- (62) Waters L.B.F.M., Waelkens C., Trams N.R., 1993. In: Schwarz H.E. (ed.) Proc. Second ESO/CTIO workshop Mass loss on the AGB and beyond. ESO Conference and Workshop Proceedings No. 46, Germany, p. 298
- (63) Waters L.B.F.M., Waelkens C., Van Winckel H., 1997. In: Habing H.J., Lamers H.J.G.L.M (eds.) Proc. IAU Symp. 180, Planetary Nebulae. Kluwer, p. 313
- (64) Waters L.B.F.M., Waelkens C., Van Winckel H., et al., 1998, Nat 391, 868
- (65) Woolf V.M., Tomkin J., Lambert D.L., 1995, ApJ 453, 660
- (66) Yamamura I., Dominik C., de Jong T., Waters L.B.F.M., Molster F.J., 2000, A&A, in press
- (67) Začs L., Klochkova V.G., Panchuk V.E., 1995, MNRAS 275, 764