CCD Photometry of the Globlular Cluster NGC 5986 and its Post-Asymptotic-Giant-Branch and RR Lyrae Stars
Abstract
We have obtained new CCD BV photometry of the little-studied southern Galactic globular cluster NGC 5986, including light curves of 5 of its RR Lyrae variables. The cluster’s red giant branch bump is detected for the first time at . We derive a reddening and true distance modulus of = 0.29 0.02 and = 15.15 0.10, respectively. The cluster’s color-magnitude diagram reveals a mostly blue horizontal branch, like that of M13 or M2, and quite unlike M3; yet all of these clusters have nearly identical metallicities ([Fe/H]CG97 = ). We show that the RR Lyrae variables in NGC 5986 are about 0.2 mag brighter on average than those in M3, an important exception to the often-employed, universal (RR)–[Fe/H] relation. Finally, we note that NGC 5986 contains two luminous stars with spectral types A-F, which are likely to be post-asymptotic-giant-branch (PAGB) objects. The -band luminosity function (LF) of such yellow PAGB stars is a promising standard candle. We suggest that the LF is sharply peaked at (PAGB) = .
1 Introduction
Population II stars evolving off the asymptotic giant branch (AGB) and passing through spectral types F and A are excellent candidates for a new extragalactic standard candle (Bond 1997, 2001). These “yellow” post-AGB (PAGB) stars are the visually brightest members of old populations. They should have a narrow luminosity function (LF), because essentially a single main-sequence turnoff mass is feeding the PAGB region of the HR diagram. They are also easily recognized because of their enormous Balmer jumps. A zero-point calibration for the luminosities of Population II yellow PAGB stars may be set with those in Galactic globular clusters (GCs).
The aim of this paper is to obtain the color-magnitude diagram (CMD) and distance of the little-studied southern GC, NGC 5986. This cluster is remarkable because it contains two candidate A-F type PAGB stars, discovered some years ago during a photographic grism survey (Bond 1977). Membership of the two PAGB stars in the cluster is confirmed by their radial velocities and by Strömgren photometry showing very low surface gravities (Bond 2001). This hitherto obscure cluster thus may be destined to fill a role comparable to that of the handful of galaxies that have produced more than one Type Ia supernova. Since the cluster contains two PAGB stars, questions of cluster distance and reddening drop out; hence their observed magnitudes will provide direct evidence on the width of the Population II yellow PAGB LF.
The CMD of NGC 5986 was first studied by Harris, Racine, & DeRoux (1976) with photographic plates. A search for variable stars in the cluster was made by Liller & Lichten (1978), also with photographic plates. We present new CCD BV photometry of NGC 5986, including new light curves of the cluster’s RR Lyrae variables. Comparisons of our modern CCD photometry are made with the older studies. We provide new estimates of the cluster’s reddening and distance, and we derive the luminosities of the two candidate PAGB stars.
In addition to our study of the PAGB stars, it is also interesting to compare the CMD and the RR Lyrae stars of NGC 5986 to those of other Galactic GCs. Such comparisons remain an active area of research because they are relevant to the interrelated problems of the Oosterhoff dichotomy (Oosterhoff 1939) and the “second-parameter” effect (Sandage & Wildey 1967), with implications for the formation of the Galaxy (e.g., Lee, Demarque, & Zinn 1990, 1994). For example, a new, third Oosterhoff class may be emerging (Pritzl et al. 2000), which is not easily understood in the context of canonical stellar evolution theory. Also, new exceptions to a universal luminosity-metallicity relation for RR Lyrae stars have been found in both metal-rich (Layden et al. 1999; Pritzl et al. 2000) and metal-poor (Lee & Carney 1999; Clement & Shelton 1999) clusters. We discuss NGC 5986 in the context of these recent developments.
2 Observations and Data Reduction
Observations of NGC 5986 and standard star calibration fields were obtained by H.E.B. at the Cerro Tololo Inter-American Observatory (CTIO) with the 0.9 m telescope. All observations were made with broad-band and filters available at CTIO, which typically changed from run to run. Images of the cluster were obtained at an airmass close to unity. All frames were bias-corrected and flat-fielded in the standard manner. The different runs and detectors are summarized as follows.
In 1988, observations were made with the 300500 pixel RCA5 chip that had a scale of pixel-1 and a field of view of by . The cluster was observed in and at least once on each of 9 consecutive nights from February 22 to March 2 (twice on 2 nights). Typical exposures in and were 90 and 45 s, respectively. These observations are best-suited for our variability study. Unfortunately, the RCA’s small field of view limits our search for variable stars to the central region of the cluster.
Subsequent observations were made on the night of 1990 June 16 with the Tek4 chip trimmed to 500500 pixels. The plate scale of pixel-1 yielded a field of view on a side. These observations included photometric calibration data and our longest exposures of the cluster: two frames of 1200 s each in and two frames of 300 s each in .
The most recent observations were made on the nights of 1997 June 1 and 1998 August 26 with the 20482048 pixel Tek 2K (“No. 3”) CCD chip that had a sampling of pixel-1 and a field of view on a side. These frames covered a much larger sky area and thus yield the best statistics on the cluster giant branch and horizontal branch in the CMD. Exposures were 30 and 20 s in 1997 and 75 and 45 s in 1998, in the and filters, respectively. Photometric calibration data were obtained on both nights.
2.1 Photometric Calibration
As noted above, calibration frames were obtained in 1990, 1997, and 1998. These consisted of observations of Landolt (1992) standard-star fields repeated at different airmasses during each night. Photometry of the standard stars was obtained with DAOPHOT (Stetson 1987) with a large aperture radius (0). Growth curves indicate that the aperture magnitudes closely measure the total observable flux. For each night, we photometered 20 standard stars with known colors ranging over to 1.5 and visual magnitudes of to 12 (1990) or to 16 (1997 & 1998).
Our aperture magnitudes and the known standard system magnitudes of Landolt (1992) were then used to derive coefficients of the transformation equations of the form:
| (1) |
| (2) |
where and are the aperture magnitudes, and are standard magnitudes, and is airmass. The 1997 data showed significant scatter which we attribute to nonphotometric conditions; they are not considered further except for differential variable star photometry. The 1990 and 1998 data yielded best-fit coefficients of (,,) = (,,) and (,,), and (,,) = (,,) and (,,), respectively. The residual standard deviation of each fit is typically 0.025 mag. The solution residuals show no apparent trends with standard magnitude, color, or airmass.
2.2 Cluster Photometry
We employed DAOPHOT/ALLSTAR (Stetson 1987) to identify stars and derive profile-fitted photometry from the 1990 and 1998 frames of NGC 5986. Star lists were assembled in the usual manner, i.e. by iteratively searching star-subtracted images for more stars and concatenating these lists. Model point-spread functions (PSFs) were constructed with 7 and 25 isolated stars on each of the 1990 and 1998 frames, respectively. Mean aperture corrections for each frame were derived with these same sets of stars. The aperture corrections are uncertain at the 2% and 1% levels in the 1990 and 1998 data, respectively. This difference can be attributed to crowding. After applying aperture corrections, each pair of and instrumental magnitudes was calibrated according to Eqs. 1 & 2. We employ instrumental colors, then iterate until the solutions converge.
As a check of our calibration, stars were identified in both the 1990 and 1998 and frames. Comparisons of the 50 brightest matched stars show that systematic zero-point offsets in each color are less than 2%, consistent with the calibration uncertainties estimated above. It is noted that the faintest stars identified in the 1990 frames have 18.5, while the 1998 frames yield a detection limit of 20. This suggests that 18.5 is the confusion limit in the crowded cluster center, which we confirm to be the case in the 1998 data as well. Since the photometry of faint stars near the cluster center is confusion limited, the 1990 frames do not yield a significant improvement in photometric accuracy relative to the 1998 frames despite the longer exposures.
For the remainder of this work, the photometry of NGC 5986 from the 1998 run serves as our fiducial calibration. Over 6000 stars were detected in both the and frames. These 1998 calibrated photometry data are summarized in Table 1 (the complete table is available only in the electronic edition of The Astronomical Journal ). Note that the center of the cluster is located at X=1025, Y=1025 in the pixel coordinates provided, which can be used to define different radial distance cuts for CMD construction. The image is available from the authors upon request. Additional photometry of the cluster obtained for the variable star search is described in §2.3.
In Figure 1, we compare our calibrated photometry to that of the Harris et al. (1976) photographic study for 25 stars in common. The Harris et al. (1976) photometry was calibrated with the photoelectric standard-star sequence of White (1971). Two of the White (1971) standard stars are also compared in Figure 1. Despite the considerable scatter of the Harris et al. (1976) data, we find that our zero points agree to within 0.05 mag, which we consider acceptable. The difference may suggest a modest degree of flux contamination from faint neighboring stars in the photoelectric standard-star sequence of White (1971).
The photographic photometry of cluster variable stars by Liller & Lichten (1978) was calibrated relative to the Harris et al. (1976) data. In addition, their magnitudes were estimated “by eye” in several instances. Thus we consider their photometry to be of limited use as a check of our calibration. Kravstov et al. (1997) also presented photographic photometry of NGC 5986 which was calibrated with the photoelectric standard star sequence of Alcaino (1984). Unfortunately, none of the Alcaino (1984) standard stars lie within our field of view. Finally, Rosenberg et al. (2000) recently presented a color-magnitude diagram for NGC 5986 derived from CCD data as part of a large catalog of globular cluster CMDs. A visual comparison of their CMD with ours (see §3) suggests that no large zero-point discrepancy exists. Judging by the cluster giant branch and the blue horizontal branch, our CMD shows significantly less scatter than that obtained by Rosenberg et al. (2000; see their Fig. 20), although their CMD reaches a fainter limit. Rosenberg et al. suggest that NGC 5986 is affected by differential reddening. However, we do not see strong evidence for this in our CMD, which is constructed from stars only near the cluster center.
Further discussion of the CMD of NGC 5986 is deferred to §3, after the variable star content of the cluster is characterized.
2.3 Search for Variable Stars
As mentioned above, Liller & Lichten (1978) searched for variable stars in NGC 5986 with photographic plates. They identified 9 periodic variables; all are RR Lyrae variables. Of these, 2 are overtone pulsators (RRc; but one is actually a foreground star) and 7 are fundamental mode pulsators (RRab). The cluster also contains one bright, red semiregular variable and one severely blended variable star whose period was not determined.
The field of view of our 1988 RCA data includes the semiregular (V4), and the blended variable (V10). It also includes 5 of the RRab (V1, V2, V6, V9, and V11), and one RRc (V12); the latter is believed to be a foreground star and not a member of NGC 5986. The known variables lying outside of our field of view are V3, V8 (both are RRab), and V7 (an RRc). Note that V5 is actually a nonvariable star (Liller & Lichten 1978).
Given our modern CCD data, it seemed worth searching for new, possibly overlooked, variable stars in NGC 5986. In addition, we decided to experiment with a newly developed “difference imaging” analysis package. Difference imaging is well suited to the task of finding variable stars in crowded fields. In this type of analysis, all nonvariable stars are subtracted away in each frame, leaving isolated (and thus easy to photometer) images of only those stars which have changed brightness relative to a fiducial frame (e.g., Alard 2000).
Our difference imaging analysis is briefly summarized as follows. First, closely spaced observations on the same nights were averaged to increase signal to noise. This yielded 10 frames and 9 frames over the 9 nights in 1988. Source lists for each frame were generated with SExtractor (Bertin & Arnouts 1996), frame-to-frame coordinate transformations were derived with the method of similar triangles (Groth 1986), and then all frames were transformed to a common coordinate system111The image “remapping” was accomplished with code written by J. Tonry.. Next, and reference images were created by taking the medians of the transformed frames. Each frame was then subtracted from the appropriate reference image with the ISIS program (Alard 2000). We employed DAOPHOT to search the subracted frames for 3, positive or negative, star-like images. In this manner, all of the known variables were recovered as 3 detections in both and , and in at least 3 of the 9 pairs of frames over the 9 nights. No other stars met these criteria. A few dozen other candidate variables (i.e., 3 detections in 1 or 2 pairs of frames) were carefully inspected, but each could be attributed to photon noise (i.e., subtractions of very bright stars) or defects in the image data. We estimate our detection limit for variability to be 0.01 mag over a 10 day period. Thus, based on this difference imaging analysis, we conclude that the variable star survey of NGC 5986 by Liller & Lichten (1978) was complete in the cluster center.
We then re-reduced the RCA frames with DAOPHOT/ALLSTAR in order to obtain PSF-fitted photometry in a manner consistent with the 1990, 1997, and 1998 reductions (see §2.2). For each photometry list, stars in common with the calibrated 1998 data were used to derive transformations from the instrumental ALLSTAR-reported magnitudes directly to calibrated or . These equations included only a zero-point and color term. The color coefficients so obtained were consistent with those found with the standard-star calibration data (see §2.1). We estimate that each photometric measurement is transformed to the Johnson system with an uncertainty of about 0.01 mag. In total, we made up to 12 two-color photometric measurements of each variable, spanning a 10 year period. These photometric data are summarized in Table 2.
The and light curves of the 5 cluster-member RR Lyrae stars are shown in Figure 2, including the Liller & Lichten (1978) photographic data. No zero-point offsets have been applied to the photographic data. Since our new data extend the time baseline of observations by an additional 15 years, we rederived the pulsation periods from the combined CCD and photographic -band light curves with the supersmoother period-finding code (Reimann 1994). By inspection of the period-folded light curves (see Figure 3), we estimate minimum and maximum light (uncertainty of 0.05 mag), which also yields the pulsation amplitudes ( and ) and the colors at minimum light. The mean brightnesses are the intensity-weighted averages of the calibrated CCD data (see Table 2). These various characteristics of the light curves are summarized in Table 3. The average magnitudes of the RRab variables in NGC 5986 are (RR) = and (RR) = .
3 The NGC 5986 Color-Magnitude Diagram
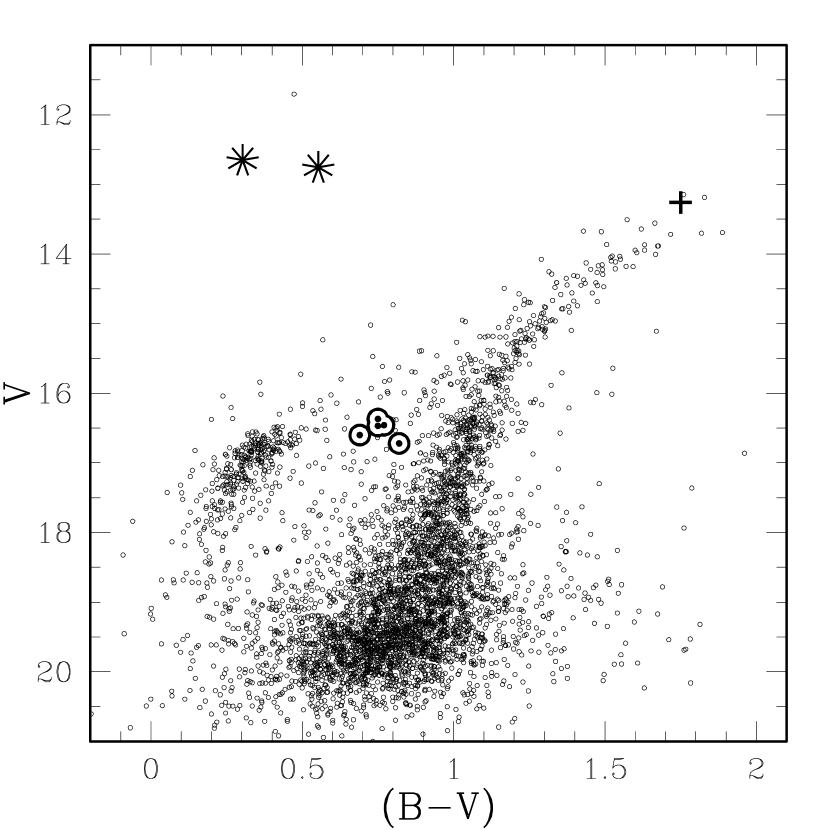
In Figure 3 we show the CMD for all stars lying within 3 of the center of NGC 5986. The time-averaged magnitudes and colors of the cluster’s variables (5 RRab and 1 SR) are distiguished, as are the 2 (nonvariable) PAGB stars. Some contamination from field stars is clearly present in spite of the small radius cut chosen for the CMD. However, major features such as the red giant branch (RGB), blue horizontal branch (HB), and the red-giant-branch bump (RGB-bump) near , are easily identified. Our photometry does not reach the cluster’s subgiant branch or main sequence turn-off. The small number of stars associated with the cluster’s asymptotic-giant-branch bump (AGB-bump) are a bit confused with field star interlopers, but this feature is located at , and . The RRab stars define the location of the cool, red portion of the cluster’s HB, which is otherwise difficult to distinguish. The semiregular variable, V4, is a bit brighter than the tip of the RGB, and is thus probably located very near the end (or tip) of the AGB. The nonvariable PAGB stars (Bond 2001) are bluer than the RR Lyrae variables. Thus the blue edge of the Population II instability strip is seen to lie at (reddened value) in NGC 5986. Finally, we note that the single yellow star which is brighter than the 2 PAGB stars in Figure 3 is not a cluster member (Bond 2001).
The NGC 5986 HB is predominantly blue. We count the blue and red HB stars by defining appropriate regions of the CMD. The latter are assumed to be redder than the RRab but bluer than the RGB. In what follows, we use , , and to denote the number of blue, variable, and red HB stars, respectively. We estimate 300 and 10. The cluster has a total of 7 RR Lyrae stars, but only 5 lying within 3; thus we define = 5. Construction of CMDs corresponding to an equal area of sky, but located as far away from the cluster center as our data allow, suggest that field star contamination of the red HB star counts () is of order a few stars, while such contamination of the blue HB star counts () is probably negligible. These star counts yield an HB morphology index (e.g., Lee, Demarque, & Zinn 1990) of 0.92.
The clustering of stars on the red giant branch at (bump) = 16.470 0.025 mag is identified as the RGB-bump (e.g., Ferraro et al. 1999; Alves & Sarajedini 1999). The location of the RGB-bump is determined by fitting the cluster’s differential giant branch luminosity function with a model function, as shown in Figure 4. The fitted model function is a Gaussian of arbitrary height, width, and center, and a 3-parameter (quadratic) background. The quadratic background accounts for the underlying RGB while the Gaussian represents the RGB-bump. A chi-squared minimization yields the best-fit center for the peak of the Gaussian and associated error, which we report above.
Guided by the cluster’s RRab stars, we determine the color of the red giant branch at “the level of the HB” to be . This formal error does not account for our photometric calibration. Our measurement of is made by fitting a Gaussian of arbitrary height, width, and center to a color-frequency histogram of RGB stars in the range = 16.3 to 16.9. We adopt the best-fit center and associated error as the nominal RGB color. Note that different magnitude cuts centered on the mean brightness of the RRab yield consistent results.
3.1 Metallicity
The metallicity of NGC 5986 is well-constrained by observations other than our own, such as the integrated light of the cluster (Zinn & West 1984), and spectroscopic measurements of the Ca II triplet for several of the cluster’s red giants (Rutledge et al. 1997). Rutledge, Hesser & Stetson (1997b) estimate the metallicity as [Fe/H]ZW84 = on the Zinn & West (1984) scale, or [Fe/H]CG97 = on the Carretta & Gratton (1997) scale. The color of the NGC 5986 giant branch in the Washington system and an assumption for the cluster’s reddening yields a consistent result (Geisler, Claria, & Minniti 1997). For the purposes of this work, we assume that the metallicity of NGC 5986 is a known parameter, as listed above on each of the two currently popular metallicity scales.
It is interesting to compare the known metallicity with that derived from the periods and amplitudes of the cluster’s RRab variables. Using the calibration of Walker & Mack (1986) in terms of the -band pulsation amplitude () and period, we find [Fe/H]ZW84 = . The calibration of Alcock et al. (1999) in terms of and period yields [Fe/H]ZW84 = . These estimates are clearly at odds with the metallicity derived from the spectroscopy of giants and the integrated cluster light, which suggests a systematic difference between the RRab variables in NGC 5986 and the calibrating RRab stars. This will be discussed further in §4.
3.2 Reddening
We first consider two published results for the reddening toward NGC 5986. Zinn’s (1980) analysis of the cluster’s integrated colors yields , while the reddening maps of Burstein & Heiles (1982) indicate . The stated uncertainties in these two measurements were assigned by us after a careful review of the data.
We also calculate the reddening with our new photometry. First, the colors of the cluster’s RRab variables at minimum light yield an estimate of the reddening; this is known as Sturch’s (1966) method. Employing the calibration from Walker (1990), and the period and color data from Table 3, we estimate . The uncertainty here is dominated by the error of the mean color at minimum light for the 5 RRab listed in Table 3. Next, using as derived above, [Fe/H]CG97 from Rutledge et al. (1997b), and the calibration of Ferraro et al. (1999) for the intrinsic color of the giant branch, , as a function of [Fe/H]CG97 (their Eqn. 4.15), we find . This uncertainty is dominated by the Ferraro et al. (1999) calibration.
For the remainder of this work, we adopt the weighted average of the four reddening estimates summarized above: .
3.3 Distance
In a cluster like NGC 5986, which has a predominantly blue HB and only a handful of RR Lyrae variables, it is difficult to determine the precise level of the zero-age horizontal branch (ZAHB; e.g., Ferraro et al. 1999). Since the RGB-bump is not subject to horizontal-branch evolutionary effects, we calculate the distance to NGC 5986 with this feature. Adopting a standard reddening law ( = 3.1; Cardelli, Clayton, & Mathis 1989), the dereddened brightness of the RGB-bump is (bump) = 15.570 0.065. This uncertainty accounts for uncertainties in the reddening and our measurement of (bump). The calibration of Ferraro et al. (1999) in terms of [Fe/H]CG97 predicts (bump) = 0.425 0.08, where the uncertainty represents the standard deviation of the calibration combined with the uncertainty in [Fe/H]CG97 for NGC 5986 (see §3.1). Thus we arrive at true distance modulus of , or a distance of kpc.
At this distance, the RRab variables in NGC 5986 have a mean absolute visual magnitude of (RR) = 0.47 0.11. For comparison, the calibration222Chaboyer et al. (1998) find (RR) = 0.23(0.03) ([Fe/H]ZW84 + 1.9) + 0.39(0.08). of Chaboyer et al. (1998) predicts (RR) = 0.45. Thus the distance to NGC 5986 derived from the RR Lyrae variables and this calibration would be in good agreement with our estimate based on the RGB-bump.
4 The RR Lyrae Variables in NGC 5986
The RRab stars in the Bailey diagram ( vs. ; see Table 3) are shown in Figure 5. We compare the RRab stars in NGC 5986, the one RRab star in M15 (Pike & Meston 1977), and the RRab stars in M3 from Kaluzny et al. (1998) and Carretta et al. (1998). Fiducial “ridge” lines for the RRab variables in M3 and M15 are taken from Alcock et al. (1999). These ridge lines illustrate the use of the Bailey diagram as a diagnostic of metallicity. RRab stars with lower metallicities have longer periods at a fixed amplitude (i.e., M15 is more metal-poor than M3). However, despite having nearly identical metallicities, the RRab stars in NGC 5986 and M13 are unlikely to be drawn from the same distribution as the RRab in M3 in this diagram. The former lie at noticeably longer periods. This systematic period shift explains the failure of the periods and pulsation amplitudes of the RRab stars in NGC 5986 to predict the metallicity of the cluster (see §3.1).
Lee & Carney (1999) have pointed out a similar problem with the RRab variables in M2 (also in a comparison with those in M3). Thus the RRab stars in 3 clusters (NGC 5986, M2, and M13) have systematically longer periods than those in the cluster M3, yet all of these clusters have nearly the same metallicity. It is interesting that the 3 clusters with the long-period RRab variables all have blue HBs, 0.9, while M3 has 0.1. Clement & Shelton (1999) have argued that the location of cluster RRab stars in the Bailey diagram is not a unique function of metallicity. They suggest that the period-shift effect seen here is due to the higher luminosities of the RRab stars, which are in a relatively more advanced evolutionary state.
We compare the luminosities of the RRab variables in NGC 5986 and M3 as follows. From Lee & Carney (1999), who reanalyzed the M3 cluster photometry of Ferraro et al. (1997) and the M3 RR Lyrae photometry of Carretta et al. (1998), the average brightness of the RRab stars is (RR) = . Ferraro et al. (1997) identified the RGB-bump in M3, and found (bump) = . The reddening toward M3 is low, = 0.01; thus the dereddened brightnesses are (RR) = and (bump) = . Rutledge et al. (1997b) give [Fe/H]CG97 = for M3. Therefore, the RGB-bump luminosity in M3 should be the same as in NGC 5986, or (bump) = 0.425. The true M3 distance modulus is then , and the mean absolute visual magnitude of the RRab stars is (RR) = 0.63 0.11. This compares with (RR) = 0.47 0.11 found for NGC 5986. Assuming that (bump) is the same for both M3 and NGC 5986, the relative brightness difference between the two groups of RRab stars is (RR) = 0.17 0.07, where is defined in the sense of M3 NGC 5986.
As a check, the luminosity difference can also be inferred from the period shift in the Bailey diagram. We estimate that the RRab variables in NGC 5986 are shifted by dex relative to the M3 ridge line shown in Figure 4. Following Lee & Carney (1999), if the average masses of the RR Lyrae stars in each cluster are the same, the pulsation equation implies a luminosity difference of dex for this period shift. If the bolometric corrections are the same in each cluster, this luminosity difference corresponds to (RR) 0.20 mag, in good agreement with our estimate above. This agreement also supports the assumption that the masses of RRab stars in M3 and NGC 5986 are the same. In summary, the RRab stars in NGC 5986 appear to be about 0.2 mag brighter on average than those in M3.
Our comparison of the RRab stars in NGC 5986 and M3 demonstrates an unambiguous exception to a universal (RR)–[Fe/H] relation. A similar conclusion was reached by Lee & Carney (1999) and Clement & Shelton (1999) based on their analyses of the RR Lyrae stars in other metal-poor clusters. Exceptions to a universal (RR)–[Fe/H] relation have also been found for RR Lyrae stars in metal-rich GCs (Layden et al. 1999; Pritzl et al. 2000). It is not clear that the exceptions in the metal-poor and metal-rich clusters can be explained by the same physical process. For the case of the NGC 5986, we suggest that the RRab stars have evolved off of the blue ZAHB and into the instability strip at higher luminosities, while those in M3 are on average less evolved, closer to their ZAHB locations, and fainter.
5 The PAGB Stars in NGC 5986
The use of A-F spectral type (“yellow”) post-AGB stars as Population II standard candles has been championed by Bond and collaborators (e.g., Bond 1997, Bond & Fullton 1997, Bond 2001). As discussed in §1, the two candidate PAGB stars in NGC 5986 allow a test of the assertion that the -band luminosity function (LF) of Population II yellow PAGB stars should be sharply peaked.
Our new photometry (Table 1) and analysis of the NGC 5986 distance yield and for the stars PAGB-1 and PAGB-2, respectively. Thus, based on only these two stars, we suggest that the LF of Population II yellow PAGB supergiants peaks near .
The bolometric corrections of Flower (1996) yield = 3.31 and 3.21 for PAGB-1 and PAGB-2, respectively. The luminosity-core mass calibration of Vassiliadis & Wood (1994), which is independent of metallicity over the range of models calculated, then predicts masses of = 0.536 and 0.528 , respectively. Thus the typical PAGB remnant mass in NGC 5986 is about 0.53 . This is in fair agreement with the average mass of white dwarfs in GCs and the halo field, , as recently reviewed by Alves, Bond, & Livio (2000, and references therein).
For comparison, we estimate that the semiregular variable V4 in NGC 5986 has = 3.44, which is higher than both PAGB stars. In this case, Whitelock’s (1986) period-luminosity calibration implies a period of about 300 days, which would be one of the longest periods known for semiregulars in GCs. Our data suggest a period of order 20 days. However, a period as long as 300 days seems unlikely. If this star leaves the AGB and evolves at constant luminosity to higher temperatures, it would appear as a yellow PAGB star with . We caution that the bolometric correction (Flower 1996) we have employed for this cool, metal-poor giant is large and uncertain. In this regard, near-infrared photometry would be useful. Radial velocity data are also needed to confirm this star’s cluster membership.
Based on only the two yellow PAGB stars in NGC 5986, the intrinsic scatter, or width, of the peak of -band LF appears to be quite narrow. However, we are obviously dealing with small-number statistics. There is one other well-known yellow PAGB star in a GC; this is ROA 24 in Cen, a confirmed cluster member. Adopting the photometry assembled by González & Wallerstein (1992), and the reddening and distance modulus from Alcaino & Liller (1987; see also Harris 1996), we estimate333We note that for ROA 24 in González & Wallerstein (1992) was incorrectly calculated from and instead of . , = 3.17, and . ROA 24 combined with the two PAGB stars in NGC 5986 suggests that the intrinsic width of the -band yellow PAGB LF is 0.10–0.15 mag, with a peak at .
Recently, Neely, Sarajedini, & Martins (2000) presented a new CMD of the GC NGC 6144, and suggested that this cluster also contains a yellow PAGB star. Using the (RR) calibration of Chaboyer (1998) as in §3.3, and the reddening, metallicity, and (HB) estimates from Neely et al. (2000), this candidate yellow PAGB star has , = 3.51, and . Based on this high luminosity and mass, we suggest that this star may not be a member of the cluster. Measurement of the Balmer jump would confirm the PAGB nature of this star. Radial velocity data are also needed to confirm its cluster membership.
The existence of two yellow PAGB stars in NGC 5986 argues that their lifetimes are relatively long. Extant stellar evolution theory cannot predict yellow PAGB lifetimes in an absolute sense, because the transition from the tip of the AGB to yellow PAGB star is critically dependent on ad hoc mass-loss parameterizations (Trams et al. 1989; Vassiliadis & Wood 1994). This is not the case for hotter PAGB stars, such as the nuclei of PNe, whose evolutionary timescales are less sensitive to the mass-loss rates. If yellow PAGB stars live 2-3 years, and assuming each star in a GC becomes a yellow PAGB star, the total luminosity of the GC system implies a total of 16 yellow PAGBs in GCs. Based on the 3 known PAGB stars in the GC system (2 in NGC 5986 and 1 in Cen), a minimum lifetime is 4000 years. However, we remind that no systematic search of the GC system for yellow PAGBs has yet been conducted.
The calibration of yellow PAGB stars as standard candles will require a larger sample of objects, probably of order a dozen stars in Galactic GCs, in order to accurately define the peak and width of the -band LF. Close-binary merger scenarios may introduce outliers on the bright side of what may otherwise be a sharply peaked LF (e.g., Alves et al. 2000). Nonvariable stars lying blueward of the Population II instability strip, but in an evolutionary state related to the Population II Cepheids, may introduce outliers on both the faint and bright sides of the LF. Indeed, some Population II Cepheids in GCs reach luminosities of (e.g., González & Wallerstein 1992). If yellow “cousins” of the Population II Cepheids significantly contaminate the PAGB LF, we predict a correlation between the occurrence of yellow PAGBs in GCs and the clusters’ HB morphologies, as the Population II Cepheids show (Wallerstein 1970). We have undertaken a large-scale survey of the GC system for yellow PAGB stars, which will help to define observationally the true peak and width of their -band LF, and perhaps shed new light on the unusual presence of two PAGB stars in NGC 5986.
6 Conclusion
We have presented a new color-magnitude diagram of NGC 5986, as well as new light curves for 5 of the cluster’s RR Lyrae variables. We have detected the RGB-bump for the first time on this cluster’s giant branch. Our analysis of the color-magnitude diagram yields new estimates for the reddening and true distance modulus: and , respectively. In comparison with the globular cluster M3, which has the same metallicity as NGC 5986, we find that the RR Lyrae stars in the latter are about 0.2 mag brighter. This is an important exception to a universal (RR)–[Fe/H] relation in a metal-poor cluster. Our photometry of the two candidate yellow PAGB stars in NGC 5986 suggests that the -band LF of these stars is sharply peaked at (PAGB) = .
References
- (1) Alcock, C. et al. 1999, AJ, 119, 2194
- (2) Alves, D.R., & Sarajedini, A. 1999, ApJ, 511, 225
- (3) Alves, D.R., Bond, H.E., & Livio, M. 2000, AJ in press: astro-ph/0007190
- (4) Alard, C. 2000, A&AS, 114, 363
- (5) Alcaino, G. 1984, A&A, 139, 549
- (6) Alcaino, G., & Liller, W. 1987, A&A, 94, 1585
- (7) Bertin, E., & Arnouts, S. 1996, A&AS, 117, 393
- (8) Bond, H.E. 1977, BAAS, 9, 601
- (9) Bond, H.E. 1997, in The Extragalactic Distance Scale, eds. M. Livio, M. Donahue, & N. Panagia (Cambridge: Cambridge University Press), 224
- (10) Bond, H.E., & Fullton, L. K. 1997, BAAS, 29, 843
- (11) Bond, H.E. 2001, in preparation
- (12) Burstein, D., & Heiles, C. 1982, AJ, 87, 1165
- (13) Cardelli, J.A., Clayton, G.C., & Mathis, J.S. 1989, ApJ, 345, 245
- (14) Carretta, E., & Gratton, R.G. 1997, A&AS, 121, 95
- (15) Carretta, E. et al. 1998, MNRAS, 298, 1005
- (16) Chaboyer, B., Demarque, P., Kernan, P.J., & Krauss, L.M. 1998, ApJ, 494. 96
- (17) Clement, C.M., & Shelton, I. 1999, ApJ, 515, L85
- (18) Ferraro, F.R. et al. 1997, A&A, 320, 757
- (19) Ferraro, F.R. et al. 1999, AJ, 118, 1738
- (20) Flower, P.J. 1996, ApJ, 469, 355
- (21) Geisler, D., Claria, J.J., & Minniti, D. 1997, PASP, 109, 799
- (22) González, G., & Wallerstein, G. 1992, MNRAS, 254, 343
- (23) Groth, E. 1986, AJ, 91, 1244
- (24) Harris, W.E., 1996, AJ, 112, 1487
- (25) Harris, W.E., Racine, R., & De Roux, J. 1976, ApJS, 31, 13
- (26) Kaluzny, J., Hilditch, R., Clement, C., & Rucinski, S. 1998, MNRAS, 296, 347
- (27) Kravstov, V.V. et al. 1992, Astronomy Letters, 23, 391
- (28) Landolt, A.U. 1992, AJ, 104, 340
- (29) Layden, A.C., Ritter, L.A., Welch, D.W., & Webb, T.M.A., 1999, AJ, 117, 1313
- (30) Lee, J.-W., & Carney, B.W. 1999, AJ, 118, 1373
- (31) Lee, Y.-W., Demarque, P., & Zinn, R. 1990, ApJ, 350, 155
- (32) Lee, Y.-W., Demarque, P., & Zinn, R. 1994, ApJ, 423, 248
- (33) Liller, M.H., & Lichten, S.M. 1978, AJ, 83, 1070
- (34) Neely, R.K., Sarajedini, A., & Martins, D.H. 2000, AJ, 119, 1793
- (35) Oosterhoff, P.Th. 1939, Observatory, 62, 104
- (36) Pike, C.D., & Meston, C.J. 1977, MNRAS, 180, 613
- (37) Pritzl, B., Smith, H.A., Catelan, M., & Sweigart, A.V. 2000, ApJ, 530, L41
- (38) Reimann, J., 1994, Ph.D. dissertation, U.C. Berkeley
- (39) Rutledge, G.A. et al. 1997, PASP, 109, 883
- (40) Rutledge, G.A., Hesser, J.E., & Stetson, P.B. 1997, PASP, 109, 907
- (41) Rosenberg, A., Piotto, G., Savianne, I., & Aparicio, A., 2000, A&AS, in press: astroph/0002205
- (42) Sandage, A., & Wildey, R. 1967, ApJ, 150, 469
- (43) Stetson, P. 1987, PASP, 99, 191
- (44) Sturch, C. 1966, ApJ, 143, 774
- (45) Trams, N.R. et al. 1989, A&A, 218, L1
- (46) Walker, A. 1990, AJ, 100, 1532
- (47) Walker, A., & Mack, P. 1986, MNRAS, 220, 69
- (48) Wallerstein, G. 1970, ApJ, 160, 345
- (49) White, R.E. 1971, AJ, 76, 419
- (50) Whitelock, P. 1986, MNRAS, 219, 525
- (51) Vassiliadis, E., & Wood, P. 1994 ApJS, 92, 125
- (52) Zinn, R. 1980, ApJS, 42, 19
- (53) Zinn, R., & West, M.J. 1984, ApJS, 55, 45


4cm ID XPIXaaPixel coordinates from 1998 data; the plate scale is pixel-1 The center of the cluster is at approximately X = 1025, Y = 1025. YPIXaaPixel coordinates from 1998 data; the plate scale is pixel-1 The center of the cluster is at approximately X = 1025, Y = 1025. CommentbbStar F is a foreground F dwarf. PAGB-1 and PAGB-2 are the the two PAGB candidates, denoted “BW” and “BE” in Bond (2000). Known variable star designations (i.e., V4) are also listed in the complete version of this table. 1 874.035 977.380 12.176 0.008 11.703 0.014 Star F 2 317.649 1486.862 12.876 0.019 12.169 0.015 3 1636.164 1269.349 13.957 0.018 12.503 0.013 4 242.104 1859.430 13.833 0.028 12.560 0.024 5 1605.885 836.089 13.502 0.012 12.617 0.011 6 1013.955 964.771 12.955 0.010 12.652 0.010 PAGB-1 7 966.942 1010.151 13.308 0.008 12.755 0.014 PAGB-2 8 1801.448 1977.540 13.682 0.035 12.879 0.031 ††footnotetext: NOTE – Table 1 is presented in its entirety in the electronic edition of the Astronomical Journal. A portion is shown here for guidance regarding its form and content.
1cm ID H.J.D.V H.J.D.B 2,400,000+ 2,400,000+ V1 16.200 0.010 47213.902 16.752 0.013 47213.898 16.662 0.026 47214.910 17.197 0.039 47214.910 16.662 0.022 47215.906 17.365 0.021 47215.906 16.392 0.009 47216.898 17.060 0.022 47216.895 16.676 0.017 47217.906 17.380 0.029 47217.906 16.025 0.010 47218.902 16.526 0.012 47218.902 16.816 0.020 47220.898 17.538 0.025 47220.898 16.240 0.009 47221.902 16.836 0.011 47221.902 16.608 0.013 47222.910 17.377 0.024 47222.910 16.777 0.014 48058.641 17.521 0.015 48058.629 16.857 0.030 50601.676 17.544 0.030 50601.672 16.513 0.013 51052.496 17.187 0.016 51052.492 V2 16.084 0.019 47213.902 16.743 0.024 47213.898 16.606 0.039 47214.910 17.327 0.041 47214.910 16.348 0.031 47215.906 17.045 0.027 47215.906 16.465 0.020 47216.898 17.424 0.056 47216.895 16.367 0.033 47217.906 17.337 0.034 47217.906 15.819 0.020 47218.902 16.303 0.019 47218.902 16.099 0.032 47220.898 16.672 0.026 47220.898 16.538 0.030 47221.902 17.354 0.037 47221.902 16.368 0.027 47222.910 17.099 0.027 47222.910 16.467 0.066 48058.641 16.843 0.027 48058.629 16.334 0.019 51052.496 16.929 0.014 51052.492 V4 13.373 0.004 47213.902 15.122 0.003 47213.898 13.310 0.006 47214.910 15.067 0.010 47214.910 13.292 0.005 47215.906 15.049 0.007 47215.906 13.278 0.006 47216.898 15.016 0.008 47216.895 13.208 0.005 47217.906 14.984 0.006 47217.906 13.207 0.005 47218.902 14.940 0.005 47218.902 13.168 0.009 47220.898 14.869 0.011 47220.898 13.154 0.007 47221.902 14.866 0.006 47221.902 13.149 0.004 47222.910 14.840 0.004 47222.910 13.368 0.015 48058.641 15.128 0.004 48058.629 13.219 0.044 50601.676 14.904 0.019 50601.672 13.312 0.012 51052.496 15.183 0.009 51052.492 V6 16.660 0.024 47213.902 17.515 0.023 47213.898 16.474 0.030 47214.910 17.112 0.045 47214.910 15.782 0.015 47215.906 16.228 0.014 47215.906 16.458 0.035 47216.898 17.481 0.040 47216.895 16.138 0.015 47217.906 16.754 0.024 47217.906 16.529 0.039 47218.902 17.412 0.021 47218.902 15.978 0.021 47220.898 16.574 0.014 47220.898 16.517 0.031 47221.902 17.298 0.018 47221.902 16.090 0.015 47222.910 16.671 0.013 47222.910 16.672 0.028 48058.641 17.399 0.014 48058.629 16.617 0.037 50601.676 17.372 0.038 50601.672 16.672 0.025 51052.496 17.243 0.023 51052.492 V9 16.390 0.019 47213.902 16.972 0.018 47213.898 15.835 0.025 47214.910 16.166 0.026 47214.910 16.915 0.035 47215.906 17.881 0.043 47215.906 16.837 0.029 47216.898 17.668 0.037 47216.895 16.813 0.026 47217.906 17.570 0.055 47217.906 16.403 0.020 47218.902 17.058 0.020 47218.902 16.946 0.034 47220.898 17.931 0.043 47220.898 16.836 0.028 47221.902 17.680 0.024 47221.902 16.752 0.030 47222.910 17.688 0.039 47222.910 16.632 0.016 48058.641 17.202 0.013 48058.629 16.852 0.050 50601.676 17.452 0.043 50601.672 16.480 0.027 51052.496 16.959 0.019 51052.492 V10 15.330 0.031 47213.902 16.537 0.013 47213.898 15.276 0.044 47214.910 16.664 0.079 47214.910 15.289 0.050 47215.906 16.696 0.065 47215.906 15.306 0.053 47216.898 16.627 0.077 47216.895 15.301 0.030 47217.906 16.598 0.049 47217.906 15.300 0.047 47218.902 16.604 0.048 47218.902 15.248 0.054 47220.898 16.701 0.066 47220.898 15.271 0.063 47221.902 16.608 0.031 47221.902 15.275 0.036 47222.910 16.825 0.066 47222.910 V11 16.558 0.020 47213.902 17.396 0.032 47213.898 16.472 0.035 47214.910 17.189 0.045 47214.910 15.825 0.016 47215.906 16.277 0.016 47215.906 16.568 0.054 47216.898 17.407 0.040 47216.895 16.432 0.051 47217.906 17.112 0.030 47217.906 15.852 0.027 47218.902 16.339 0.018 47218.902 16.313 0.049 47220.898 16.883 0.034 47220.898 16.633 0.025 47221.902 17.240 0.027 47221.902 16.583 0.036 47222.910 17.338 0.031 47222.910 16.801 0.035 48058.641 17.552 0.028 48058.629 16.221 0.056 50601.676 17.108 0.043 50601.672 16.510 0.033 51052.496 17.319 0.041 51052.492 V12 14.519 0.005 47213.902 14.929 0.004 47213.898 14.449 0.007 47214.910 14.850 0.014 47214.910 14.502 0.007 47215.906 14.905 0.008 47215.906 14.853 0.011 47216.898 15.356 0.009 47216.895 14.892 0.011 47217.906 15.486 0.008 47217.906 14.868 0.006 47218.902 15.429 0.007 47218.902 14.518 0.011 47220.898 14.968 0.012 47220.898 14.435 0.009 47221.902 14.863 0.007 47221.902 14.480 0.007 47222.910 14.884 0.005 47222.910 14.700 0.020 50601.676 15.152 0.023 50601.672 14.639 0.011 51052.496 15.109 0.010 51052.492
5cm ID P (days) Type V1 0.724704 1.20 0.95 17.29 16.60 0.75 RRab V2 0.636044 1.60 1.05 17.12 16.37 1.00 RRab V4 20 0.3 0.2 13.26 15.01 Semiregular V6 0.627247 1.60 1.15 17.23 16.46 0.80 RRab V9 0.554631 2.00 1.40 17.54 16.72 0.90 RRab V10 0.2 0.1 16.66 15.29 V11 0.608155 1.50 1.20 17.22 16.47 0.80 RRab V12 0.348834 0.70 0.50 15.15 14.66 foreground RRc