X-Ray Flux Decrease of the Accretion-Powered Millisecond Pulsar SAX J1808.4–3658 in Quiescence detected by ASCA
Abstract
The accretion-powered millisecond X-ray pulsar, SAX J1808.4–3658, was observed in quiescence with ASCA in September 1999. We detected a dim X-ray source in the SIS data at the position consistent to SAX J1808.4–3658. The source count rate was cts s-1 (0.5–5 keV) for a single SIS, which corresponds to ergs s-1 cm-2 if a power law energy spectrum of photon index 2 with low-energy absorption corresponding to a hydrogen column density of cm-2 is assumed. The statistical quality of the data was insufficient to constrain the energy spectrum or to detect the 401 Hz coherent pulsation. We compare the data with the BeppoSAX observation also made during the quiescent state, and find that the X-ray flux measured by ASCA is at least a factor of 4 smaller than that measured by BeppoSAX. We discuss the possible X-ray emission mechanisms that could explain the flux change, including the radio pulsar and the radio pulsar shock emission.
1 Introduction
SAX J1808.4–3658 is a unique transient X-ray source which displays both type I X-ray bursts and millisecond X-ray pulsations. The source is thought to be the formerly missing link between the neutron-star low-mass X-ray binaries and the millisecond radio pulsars. SAX J1808.4–3658 was discovered in September 1996 by the Wide Field Camera aboard BeppoSAX (in ’t Zand et al., 1998). It reached a peak intensity of 0.1 Crab and lasted between 6 and 40 days. Detection of two bright type I X-ray bursts demonstrated that the compact object is a neutron star. Recently, a third burst was found approximately 30 days after the first two bursts through re-analysis of a more extended set of data. An improved distance estimate resulted in 2.50.1 kpc (in ’t Zand et al., 2000).
The source was detected again in April 1998 with the PCA aboard RXTE (Marshall, 1998). The observation led to the discovery of a coherent X-ray pulsation at 401 Hz (Wijnands & van der Klis, 1998). The pulse profile was sinusoidal and had a low fractional rms amplitude of 4 % (2–60 keV). Because mass accretion on to the neutron star was considered to power the X-ray emission, a major part of the accreted mass may be channeled to the magnetic poles without being expelled by the so-called propeller effect. This sets an upper limit to the surface magnetic field of the neutron star as G, comparable to that of the millisecond radio pulsars (Wijnands & van der Klis, 1998). Subsequent analysis showed the presence of a binary period of 2.0 hr (Chakrabarty & Morgan, 1998). This confirmed the low-mass nature of the companion.
Several transient X-ray binaries have been detected in quiescence, and their X-ray properties were found to be quite different, depending on the nature of the compact object in the system. Soft X-ray transients containing a neutron star (NS SXTs) generally have a bottom luminosity around ergs s-1 in quiescence, whereas those containing a black hole (BH SXTs) can be as dim as or even dimmer than ergs s-1 (Asai et al., 1998). The former has a characteristic energy spectrum consisting of a soft component and a hard tail. Quiescent X-ray emission from SAX J1808.4–3658 was discovered with BeppoSAX on 1999 March 17–19 (Stella et al., 2000). The observed MECS count rate was very low, cts s-1, which may convert to a luminosity of ergs s-1 (0.5–10 keV) for an assumed distance of 2.5 kpc. This is in the range of quiescent luminosities in other NS SXTs.
In this letter, we report results of the 1999 September ASCA observation of SAX J1808.4–3658 made in the quiescent state.
2 Observation and Results
SAX J1808.4–3658 was observed with ASCA from 1999 September 17, 18:10 (UT) through September 20, 4:40, for a net exposure time of 63 ks. ASCA utilizes grazing-incidence, thin-foil mirrors with two kinds of focal plane detectors: the Gas Imaging Scintillation-proportional counter (GIS) and the Solid-state Imaging Spectrometer (Tanaka, Inoue, & Holt, 1994, SIS). The GIS has a wider field of view, higher time resolution, but poorer spatial resolution and low-energy efficiency (Ohashi et al., 1996). On the other hand, the SIS has a higher spatial resolution, higher energy resolution and a better low-energy efficiency.
For our quiescence observation of SAX J1808.4–3658, we had set the GIS in the highest time resolution mode to search for the 401 Hz pulsation at the sacrifice of the rise time information and a part of the spectral and the spatial information. The time resolution was 61 s in high telemetry bit rate and 0.5 ms in medium bit rate. The image resolution was reduced to pixels and the total number of spectral bins was 256. The SIS was operated in 1-ccd faint mode appropriate for the observations of dim sources. The SIS data have a time resolution of 4 s, and cover a field of view of area.
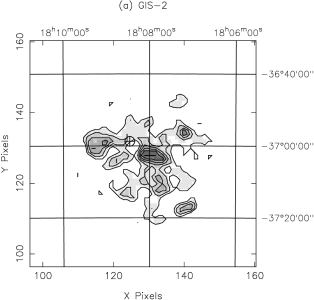
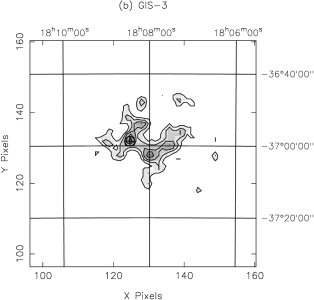
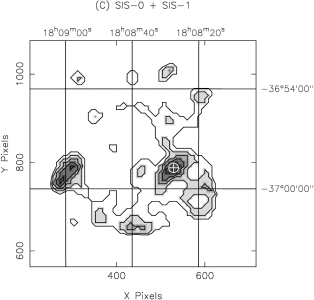
Both the SIS and the GIS data were screened with the standard data screening criteria. However, we could not apply the task ’gisclean’, which rejects background data using the combination of pulse height and rise time information, because of the lack of the rise time data. This resulted in relatively high internal background in the GIS data. Using the screened data, we calculated an image for each sensor. We applied a temperature-dependent attitude correction to the SIS data, which reduced the systematic error of the source position to (Gotthelf 1996111 http://heasarc.gsfc.nasa.gov/docs/asca/newsletters/source_position4.html; Ueda et al. 1999b). We found that the images of SIS-0 and SIS-1 were consistent and both showed slight excess flux at the position consistent with that of SAX J1808.4–3658. However, the images of GIS-2 and GIS-3 look very different. We show in Fig. 1 the images calculated from GIS-2, GIS-3 and summed SIS data. The images are slightly smoothed with a gaussian kernel appropriate for each image. As seen in the GIS images, the difference of diffuse emission pattern is apparent, especially at the position of SAX J1808.4–3658; a point-like emission is seen only in GIS-3. Because the image difference ( c/s/cm2/keV) is comparable to the local fluctuation of the internal background of the GIS (Makishima et al., 1996), we tried several different screening criteria using the GIS monitor data and the satellite’s orbit related parameters. However, the difference did not disappear. Careful inspection of the GIS-3 image showed that the point-like emission at the position of SAX J1808.4–3658 actually consisted of a single bright pixel. Smoothing by a gaussian kernel mimicked a point-like source. Because the raw image does not contain such a bright pixel, the coordinate transformation to the sky image, which includes a position randomization process, may have produced such a bright pixel. We confirmed that the bright pixel is not produced if we use a difference sequence of random number. Based on these analysis, we consider that the coarse image binning ( bin) and high internal background make the GIS data inadequate to search for the faint point source. A search for the 401 Hz coherent pulsations demonstrated also that the statistics of the GIS data were not enough to detect the pulsations, even if the relative pulse modulation equals 100 %.
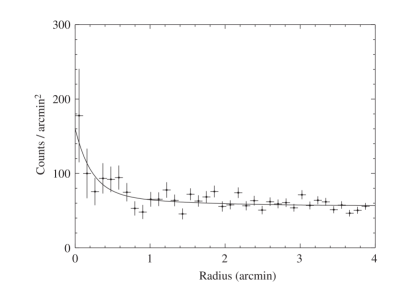
Because the GIS data proved to be inadequate, we used the SIS data to evaluate the X-ray flux from SAX J1808.4–3658. We calculated a radial profile of the source from the summed SIS image (Fig. 2). The center of the profile was taken at the local peak of the (smoothed) image, which coincided with the position of SAX J1808.4–3658 within the accuracy of position determination ( in radius). The radial profile was fitted with the model radial profile of a point source plus a constant background to determine the source flux. Precisely speaking, the model radial profile slightly depends on the X-ray energy, although the dependence is completely negligible compared to the statistical errors of the present data. The source flux was estimated to be cts s-1 (average of SIS-0 and SIS-1) for the energy range of 0.5–5 keV. Poor statistics of the data did not allow us to extract the spectral information. If we assume a power law spectrum (photon index of 2) with an absorption column of cm-2, which corresponds to the neutral hydrogen column of the source direction (Dickey & Lockman, 1990), then the X-ray flux would be ergs s-1 cm-2 in 0.5–5 keV. This flux converts to a luminosity of ergs s-1 for the source distance of 2.5 kpc.
3 Discussion
We observed the accretion-driven millisecond X-ray pulsar SAX J1808.4–3658 with ASCA in quiescence. We detected a faint X-ray source at the sky position consistent with that of the pulsar. However, the source was so dim that we could not study its spectral or timing properties. We first elaborate on the identification of the source, and then on the nature of the source.
Because the surface density of X-ray sources as dim as SAX J1808.4–3658 is relatively high, an X-ray source may happen to coincide with SAX J1808.4–3658 by chance. The chance probability may be estimated using the relation of the X-ray sources. ASCA survey data were used to investigate the relation for both the cosmic X-ray background (Ueda et al., 1999a) and the galactic ridge emission (Sugizaki, 2000). According to those results, extra-galactic sources are dominated at a flux level of erg s-1 cm-2. The density of sources brighter than erg s-1 cm-2 is about deg-2. Because the ASCA position determination error of SAX J1808.4–3658 is about 0.5 arcmin, the probability to find a source of erg s-1 cm-2 at the position consistent with SAX J1808.4–3658 by chance is estimated to be %. Although this probability is not very low, the source we detected is most probably SAX J1808.4–3658. If it were a chance coincidence of an unrelated source, the luminosity we calculated for SAX J1808.4–3658 should be regarded as an upper limit.
The quiescent luminosity of SAX J1808.4–3658 we obtained may be significantly lower than that obtained by BeppoSAX (Stella et al., 2000). In general, it is necessary to assume an energy spectrum to convert the flux between different instruments. We assume that the spectral shape (eg. photon index, absorption column) of SAX J1808.4–3658 did not change between the ASCA and BeppoSAX observations, and only the normalization did. We have tried two cases for the energy spectrum, a power law () and a blackbody ( keV), which may be appropriate for NS SXTs in quiescence. Because the column density of SAX J1808.4–3658 is not well constrained, we have tried a range of the column density, from cm-2 through cm-2. Under these assumptions, the MECS count rate ( cts s-1 in 1.3–10 keV) is converted to the SIS count rate using the utility PIMMS, which is developed and maintained by HEASARC222Web version is available at http://heasarc.gsfc.nasa.gov/Tools/w3pimms.html. Corresponding SIS count rates are found to be cts s-1 (0.5–5 keV) for a power law and cts s-1 (0.5–5 keV) for a blackbody, respectively. From this estimation, we conclude that the observed SIS count rate ( cts s-1) is at least a factor of 4 smaller than the MECS count rate, even if the statistical errors are considered. This means that the X-ray emission from SAX J1808.4–3658 is time variable.
The radio pulsar shock emission, which is prefered by Stella et al. (2000), may explain the time variation between the BeppoSAX and the ASCA observations. X-ray emission from the shocked pulsar wind has been observed from the PSR B1259–63/SS 2883 system, which consist of a 48 ms radio pulsar and a Be star (Hirayama et al., 1999). ASCA observations of the PSR B1259–63/SS 2883 system were made near periastron and apastron of the highly elliptical orbit () of the pulsar. X-ray emission was detected at both periastron and apastron, but the X-ray intensity was different by an order of magnitude. Because the intensity change is well correlated to the binary phase, difference of the stellar wind density may cause the intensity change. If the same or a similar mechanism works for the X-ray emission from SAX J1808.4–3658, the flux decrease between BeppoSAX and ASCA observations may be understood as the density decrease of the ambient matter around SAX J1808.4–3658. However, it is not clear what would cause the density decrease of the ambient matter. Another emission mechanism, neutron star cooling, is also discussed by Stella et al. (2000). Although thermal emission from the cooling neutron star cannot explain the time variation, the mechanism may still be valid if the X-ray emission observed by BeppoSAX was dominated by another emission mechanism, such as residual accretion or radio pulsar shock emission.
Although the BeppoSAX observation favors the radio pulsar shock emission for the quiescence emission from SAX J1808.4–3658 (Stella et al. 2000), another possibility can be considered for the X-ray emission detected during the ASCA observation. ASCA may have observed the X-ray emission directly from the radio pulsar. ROSAT and ASCA observations of rotation-powered pulsars show that there is a very good correlation between the X-ray luminosity and the spin-down energy loss rate: (Becker & Trümper, 1997). Here, the X-ray luminosity, , is defined in 0.1–2.4 keV. The observed flux may be converted to the unabsorbed luminosity (0.1–2.4 keV) as ergs s-1, where is the source distance normalized by 2.5 kpc (a power law with and cm-2 is assumed). By substituting , we obtain the spin-down energy loss rate as ergs s-1. This leads to a surface magnetic field of G. Although the distance to SAX J1808.4–3658 is not known accurately, this estimation of the surface magnetic field is consistent with the limits obtained from the outburst observation (Wijnands & van der Klis, 1998; Psaltis & Chakrabarty, 1999). This is also consistent with the surface magnetic field of millisecond radio pulsars. Therefore, we consider it possible that SAX J1808.4–3658 might have been a radio pulsar during the ASCA observation.
The very low X-ray luminosity of SAX J1808.4–3658 measured by ASCA may not fit in the scenario that NS SXTs generally have a bottom luminosity around ergs s-1 in quiescence, while BH SXTs do not (Asai et al., 1998). We argue that the scenario may still be valid, but some unique feature of SAX J1808.4–3658 makes it an exception. Because the propeller effect might play an important role in NS SXTs in quiescence (Menou et al., 1999), one may suspect that the spin period or the magnetic field strength of the neutron star in SAX J1808.4–3658 have very different values than those of other neutron stars in low-mass X-ray binaries (LMXBs). However, this is not the case. Spin frequencies of the neutron star may be estimated from the observations of nearly coherent oscillations during type I X-ray bursts as observed in some neutron star X-ray binaries or from the kHz quasi-periodic oscillations, and are mostly found in the range 200–600 Hz (van der Klis, 2000). According to the recycle scenario (Bhattacharaya & van den Heuvel, 1991), the surface magnetic field of the neutron stars in LMXBs may be comparable to those of the millisecond radio pulsars. Observations of the spectral transition of non-pulsating NS SXTs actually gave magnetic field strengths comparable to that of the millisecond radio pulsars (Zhang, Yu, & Zhang, 1998). Therefore, the spin frequency and the magnetic field strength of SAX J1808.4–3658 are not exceptional. It is noteworthy that the outburst luminosity of SAX J1808.4–3658 was only erg s-1. If the quiescent and long-term average outburst luminosities are related, as is the case if the quiescent emission is dominated by thermal emission from the neutron star surface (Brown, Bildsten, & Rutledge, 1998; Rutledge et al., 2000), the low quiescent luminosity may result from the low outburst luminosity. However, it is not clear why the outburst luminosity of SAX J1808.4–3658 is low (but see King 2000). Although we do not know what makes SAX J1808.4–3658 unique, the uniqueness may be responsible for both the detectable spin modulation during the outburst and the very low luminosities in quiescence.
References
- Asai et al. (1998) Asai, K., Dotani, T., Hoshi, R., Tanaka, Y., Robinson, C. R., & Terada, K. 1998, PASJ 50, 611
- Bhattacharaya & van den Heuvel (1991) Bhattacharya, D. & van den Heuvel, E. P. J. 1991, Phys. Rep. 203, 1
- Becker & Trümper (1997) Becker, W., & Trümper, J. 1997, A&A 326, 682
- Brown, Bildsten, & Rutledge (1998) Brown, E. F., Bildsten, L., & Rutledge, R. E., 1998, ApJ, 504, L95
- Chakrabarty & Morgan (1998) Chakrabarty, D. & Mprgar, E. H. 1998, Nature 394, 346
- Dickey & Lockman (1990) Dickey, J. M & Lockman, F. J. 1990, ARA&A 28, 215
- Gotthelf (1996) Gotthelf, E. 1996, ASCA newsletter No. 4, p. 31
- Hirayama et al. (1999) Hirayama, M., Cominsky, L. R., Kaspi, V. M., Nagase, F., Tavani, M., Kawai, N. & Grove, J.E. 1999, ApJ 521, 718
- in ’t Zand et al. (1998) in ’t Zand, J. J. M., Heise J., Muller, J. M., Bazzano, A., Cocchi, M., Natallucci, L., & Ubertini, P. 1998, A&A 331, L25
- in ’t Zand et al. (2000) in ’t Zand, J. J. M. et al. 2000, A&A submitted
- King (2000) King, A. R. 2000, MNRAS 315, L33
- Makishima et al. (1996) Makishima, K. et al. 1996, PASJ 48, 171
- Marshall (1998) Marshall F. E., 1998, IAU Circ. 6876
- Menou et al. (1999) Menou, K., Esin, A. A., Narayan, R., Garcia, M. R., Lasota, J. -P. & McClintock, J. E. 1999, ApJ 520, 276
- Ohashi et al. (1996) Ohashi, T. et al. 1996, PASJ 48, 157
- Psaltis & Chakrabarty (1999) Psaltis, D. & Chakrabarty, D. 1999, ApJ 521, 332
- Rutledge et al. (2000) Rutledge, E., Bildsten, L., Brown, E. F., Pavlov, G. G. & Zavlin, V. E., 2000, ApJ 529, 985
- Stella et al. (2000) Stella, L., Campana, S., Mereghetti, S., Ricci, D. & Israel, G. L. 2000, ApJ 537, L115
- Sugizaki (2000) Sugizaki, M., 2000, PhD thesis, Tokyo University
- Tanaka, Inoue, & Holt (1994) Tanaka, Y., Inoue, H. Holt, S. S. 1994, PASJ 46, L37
- Ueda et al. (1999a) Ueda, Y. et al. 1999a, ApJ 518, 666
- Ueda et al. (1999b) Ueda, Y., Inoue, H., Ogawara, Y., Fujimoto, R., Yamaoka, K., Kii, T., Gothelf, E. V. 1999b, ISAS Research Note 688
- van der Klis (2000) Van der Klis, M. 2000, submitted to Ann. Rev. Astron. Astrophys. (astro-ph/0001167)
- Wijnands & van der Klis (1998) Wijnands, R. & van der Klis, M. 1998, Nature 394, 344
- Zhang, Yu, & Zhang (1998) Zhang, S. N., Yu, W. & Zhang, W. 1998, ApJ 494, L71