Discovery of a Luminous, Variable, Off-Center Source in the Nucleus of M82 with the Chandra HRC
Abstract
We present results from observations of the most famous starburst galaxy M82 with the High-Resolution Camera onboard the Chandra X-Ray Observatory. We found nine sources in the central region, but no source was detected at the galactic center. Comparing the observations on 1999 October 28 and on 2000 January 20, we found four of the nine sources showed significant time variability. In particular, CXOM82 J095550.2+694047, which is away from the galactic center, showed extremely large time variability. We conclude that this source is the origin of the hard X-ray time variability of M82 detected with ASCA. Assuming a spectral shape obtained by the ASCA observation, its luminosity in the 0.5 – 10 keV band changed from 1.2 erg s-1 on 1999 October 28 to 8.7 erg s-1 on 2000 January 20.
1 Introduction
The X-ray spectrum of the starburst galaxy M82 measured with ASCA (Tanaka, Inoue, & Holt, 1994) consists of soft, medium, and hard components (Tsuru et al., 1997). The hard component, which dominates the X-ray spectrum above 2 keV, was found to show time variability by monitoring M82 with ASCA in 1996 (Matsumoto & Tsuru, 1999; Ptak & Griffiths, 1999). Assuming a distance of 3.9 Mpc (i.e. 19 pc) (Sakai & Madore, 1999), its luminosity in the 0.5 – 10 keV band changed between 4.5 erg s-1 and 1.6 erg s-1 at various time scales from 1 s to a month. The most plausible explanation for the variability is that a low-luminosity AGN exists in M82. If this explanation is correct, M82 would be one of the most important objects for the study of a relation between an AGN and starburst activity (e.g. Umemura, Fukue, & Mineshige, 1997) because of its proximity. However, hard X-ray spectra of M82 obtained with Ginga and BeppoSAX, which can detect the X-ray photons of higher energy than ASCA, differ from typical AGN spectra, since they cannot be fitted by a power-law model (Tsuru, 1992; Cappi et al., 1999). Therefore, it is also possible that the origin of the hard component is a new type of compact X-ray source.
Furthermore, Matsumoto & Tsuru (1999) compared the ASCA image with the ROSAT HRI image (Strickland, Ponman, & Stevens, 1997), and showed that the hard component probably comes from the X-ray brightest source detected with the ROSAT HRI. The HRI source was found to show time variability (Collula et al., 1994). Since Stevens, Strickland, & Wills (1999) showed that the source is away from the dynamical center of M82, this galaxy may harbor an “off-center” AGN.
Thus, the source of the hard component of M82 would be a quite interesting and important object. For further investigation, it is necessary to determine the position of the hard component precisely and to find a counterpart in other wavelengths if possible. Therefore, we analyzed the data of M82 obtained with the High-Resolution Camera (HRC) (e.g. Murray et al., 1987, 1997) onboard the Chandra X-Ray Observatory (CXO)(Weisskopf et al., 1995). The HRC has sensitivity in the 0.1 – 10 keV band with a peak at about 1 keV, and it has the highest angular resolution (FWHM ) of all instruments onboard X-ray observatories to date. Uncertainties in this paper refer to 1 confidence limits.
2 Data Analysis and Results
M82 was observed twice with CXO as a calibration target using the HRC-I on 1999 October 28 and 2000 January 20. The HRC data were processed with the standard procedure by the Chandra X-ray Center (CXC) 111http://asc.harvard.edu/, and we used only the fully processed science products (level = 2) as event files. We also applied an event screening procedure developed by the HRC team to eliminate “ghost” events. The exposure times are 2788 s for the first observation and 17684 s for the second.
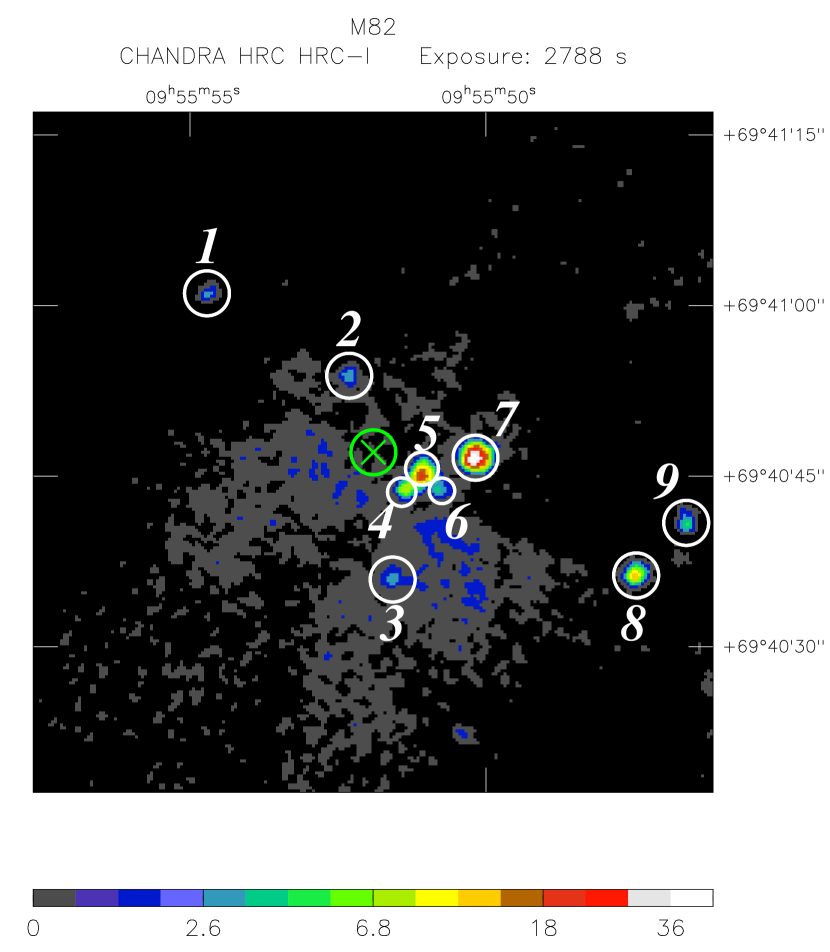
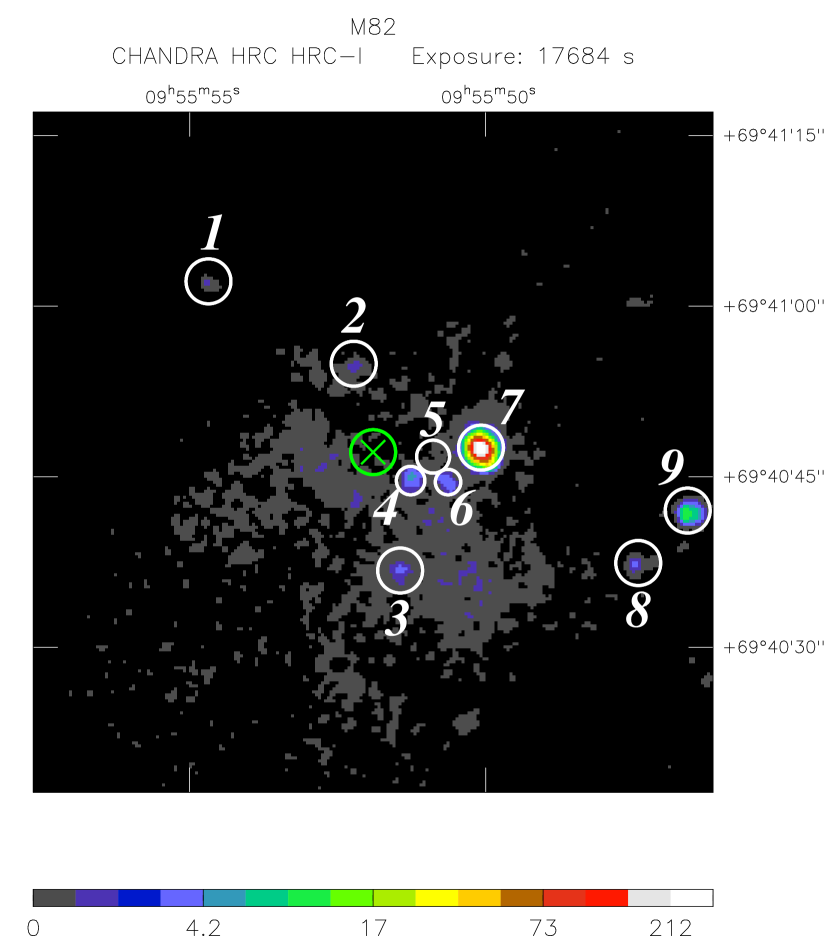
We found that all X-ray bright sources which can be the origin of the ASCA hard component exist within the central (= 1.1 kpc 1.1 kpc) region, which is shown in Figure 1. The position of the bright off-center source found with the ROSAT HRI (Stevens, Strickland, & Wills, 1999) is also within the field. Therefore, we concentrate on the central region. In Figure 1, we see nine prominent sources, which are designated with circles and numbers. More detailed analysis including diffuse emission and other fainter sources will be presented in a forthcoming paper (M. Ward et al., in preparation). We determined the positions of the peaks of the nine HRC sources with the wavelet algorithm using Chandra Interactive Analysis of Observations (CIAO), and named the HRC sources by using these positions (Table 1). The position uncertainty is less than .
According to “the CXC memo on astrometry problems” 222http://asc.harvard.edu/ciao/caveats/aspect4.html, the HRC event files we used could have offsets up to in the celestial coordinates. To check the reliability of the coordinates in the event files, we compared the coordinates of the HRC sources with the Two Micron All Sky Survey (2MASS) Point Source Catalog. There are 17 2MASS sources in the field of Figure 1. According to the CXC, the offset of the celestial coordinate in ordinary CXO event files is (RMS). The position uncertainty in the 2MASS Catalog is . Considering these uncertainties, we found that three 2MASS sources out of 17 agree with the HRC sources (Nos. 1, 6, and 8). Since the probability of a chance coincidence is less than 0.1 %, we can assume that the HRC coordinates are reliable. We then compared the coordinates of the HRC sources with the 5 GHz sources (Muxlow et al., 1994) whose position accuracy is . The fact that four HRC sources (Nos. 4, 5, 6, and 7) have counterparts on the 5 GHz map also supports the reliability of the HRC coordinates. The identifications of the HRC sources are shown in Table 1.
We estimated the counting rates of the HRC sources using the X-ray events within the circular regions shown in Figure 1. The backgrounds including the diffuse emission were estimated using source-free regions around the sources. The counting rates are listed in Table 1. Four HRC sources (Nos. 5, 7, 8, and 9) show significant time variability. In particular, No. 5 disappeared in the second observation, and No. 7 became brighter by a factor of 7. The counting rates of No. 1 and No. 4 did not change significantly between the two observations.
The dynamical center at = , which is determined by the radio observation of the motion of H I gas, is shown as the green cross in Figure 1 (Weliachew, Fomalont, & Greisen, 1984). The position error circle with a radius of is also shown as the green circle. We should note that all nine HRC sources are clearly away from the dynamical center. The counting rate of the dynamical center estimated with the extraction radius of is () c s-1 for 1999 October 28, and () c s-1 for 2000 January 20. Thus, we found no significant source at the dynamical center.
We estimated the HRC counting rate of the ASCA hard component (Matsumoto & Tsuru, 1999) using W3PIMMS v3.0 333http://heasarc.gsfc.nasa.gov/Tools/w3pimms.html: the expected counting rate is 0.72 c s-1 in the highest state and 9.7 c s-1 in the lowest. Only the counting rate of No. 7 is consistent with the expected counting rate. Furthermore, the position of the ASCA hard component is consistent with that of No. 7 (Matsumoto & Tsuru, 1999). Therefore, we can conclude that the variability of the ASCA hard component is due to No. 7 (CXOM82 J095551.4+694044). The separation between No. 7 and the dynamical center is ( 170 pc).
3 Discussion
We found that 41.5+59.7 (Kronberg, Biermann, & Schwab, 1985) is a candidate of the radio counterpart of No. 7 as well as 41.30+59.6 (Muxlow et al., 1994). 41.5+59.7 is away from No. 7, while the separation between 41.30+59.6 and No. 7 is . According to the morphology and spectral shape in the 5 GHz radio band, Muxlow et al. (1994) suggested that 41.30+59.6 is a young supernova remnant (SNR). 41.5+59.7 show a 100 % drop in the radio flux within a year, and its radio decay time scale and spectrum are very similar to SN 1983n (Kronberg & Sramek, 1985; Kronberg et al., 2000). Therefore, this source may also be a SNR. The hard X-ray emission of M82 was found to show the short-term variability (Matsumoto & Tsuru, 1999; Ptak & Griffiths, 1999). Since it is rather difficult to explain the short-term variability in terms of a SNR origin, both radio sources may not be a real counterpart of No. 7.
If we assume the spectral shape of No. 7 is an absorbed thermal bremsstrahlung model with a temperature of 10 keV and a column density of cm-2, which is the typical spectral shape of the ASCA hard component (Matsumoto & Tsuru, 1999), the peak X-ray flux of No. 7 is 6.6 erg s-1 cm-2 in the 2 – 10 keV band. According to the the relation (Ueda et al., 1999), the probability that a source as bright as No. 7 exists in the field is 0.3 %. Therefore, No. 7 is probably not a background AGN. The ASCA spectrum of the variable source obtained by subtracting the spectrum of the lowest state from the highest state shows heavy absorption (the column density is cm-2) (Matsumoto & Tsuru, 1999). Since the Galactic absorption toward M82 is 4 cm-2 (Dickey & Lockman, 1990), the variable source is embedded deeply in M82, and hence No. 7 is probably not a foreground source, unless the source has extremely large intrinsic absorption.
Assuming the absorbed bremsstrahlung model of 10 keV and cm-2, unabsorbed X-ray luminosity in the 0.5 – 10 keV band () is expressed using an HRC counting rate () as
| (1) |
The of No. 7 was estimated to be 1.2 erg s-1 on 1999 October 28 and 8.7 erg s-1 on 2000 January 20.
If we assume that No. 7 is a black hole (BH) and that the maximum luminosity does not exceed the Eddington luminosity, the mass of the BH must be larger than 700 , and No. 7 is not a stellar-mass BH ( 10 ). Since No. 7 is away from the dynamical center, the mass of No. 7 must be much smaller than the gravitational mass within from the center which is 4 (McLeod et al., 1993), otherwise the dynamical center would be shifted from the current position. Therefore, No. 7 is at the low end of the mass distribution of super-massive BHs ( – ) or a medium-massive BH ( – ). The possibility of the medium-massive BH is discussed in detail in Matsushita et al. (2000) along with the discovery of an expanding molecular superbubble surrounding No. 7 (Matsushita, 2000). Other possibilities such as an X-ray binary source whose jet is strongly beamed at us cannot be excluded. Further investigation including other wavelengths is strongly encouraged to reveal the true character of No. 7 (CXOM82 J095550.2+694047).
If we use equation (1) to the sources other than No. 7, their s are much greater than the Eddington luminosity for a 1.4 object. Therefore, these sources may also be BHs.
Though we found no significant source at the dynamical center, it is still possible that a faint X-ray source such as Sgr A∗ exists (Koyama et al., 1996). Assuming an absorbed power-low model with a photon index of 1.7 and a column density of cm-2, the upper limit of of the dynamical center is 5.4 erg s-1 for 1999 October 28 and 1.3 erg s-1 for 2000 January 20.
References
- Cappi et al. (1999) Cappi, M. et al., 1999, A&A, 350, 777
- Collula et al. (1994) Collura, A., Reale, F., Schulman, E., Bregman, J. N. 1994, ApJ, 420, L63
- Dickey & Lockman (1990) Dickey, J. M., & Lockman, F. J. 1990, ARA&A, 28, 215
- Koyama et al. (1996) Koyama, K., Maeda, Y., Sonobe, T., Takeshima, T., Tanaka, Y., & Yamauchi, S. 1996, PASJ, 48, 249
- Kronberg, Biermann, & Schwab (1985) Kronberg, P. P., Biermann, P., & Schwab, F. R. 1985, ApJ, 291, 693
- Kronberg & Sramek (1985) Kronberg, P. P., & Sramek, R. A. 1985, Science, 227, 28
- Kronberg et al. (2000) Kronberg, P. P., Sramek, R. A., Birk, G. T., Dufton, W., Clarke, T. E., Allen, M. L. 2000, ApJ, 535, 706
- McLeod et al. (1993) McLeod, K. K., Rieke, G. H., Rieke, M. J., & Kelly, D. M. 1993, ApJ, 412, 111
- Matsumoto & Tsuru (1999) Matsumoto, H., & Tsuru, T. G. 1999, PASJ, 51, 321
- Matsushita (2000) Matsushita, S. 2000, Ph.D. thesis, The Graduate University for Advanced Studies, Japan
- Matsushita et al. (2000) Matsushita, S. et al. 2000, ApJ, submitted
- Murray et al. (1987) Murray, S. S., Chappell, J. H., Elvis, M. S., Forman, W. R., & Grindlay, J. E. 1987, Astrophys. Lett. Commun., 26, 113
- Murray et al. (1997) Murray, S. S., et al. 1997, Proc. SPIE, 3114, 11
- Muxlow et al. (1994) Muxlow, T. W. B., Pedlar, A., Wilkinson, P. N., Axon, D. J., Sanders, E. M. & de Btuyn, A. G. 1994, MNRAS, 266, 455
- Ptak & Griffiths (1999) Ptak, A., & Griffiths, R. 1999, ApJ, 517, L85
- Sakai & Madore (1999) Sakai, S., & Madore, B. F., 1999, ApJ, 526, 599
- Stevens, Strickland, & Wills (1999) Stevens, I. R., Strickland, D. K., & Wills, K. A., 1999, MNRAS, 308, L23
- Strickland, Ponman, & Stevens (1997) Strickland, D. K., Ponman, T. J., & Stevens, I. R., 1997, A&A, 320, 378
- Tanaka, Inoue, & Holt (1994) Tanaka, Y. Inoue, H., & Holt, S. S. 1994, PASJ, 46, L37
- Tsuru (1992) Tsuru T. G. 1992, Ph.D. thesis, The University of Tokyo
- Tsuru et al. (1997) Tsuru T. G., Awaki H., Koyama K., Ptak A. 1997, PASJ, 49, 619
- Ueda et al. (1999) Ueda, Y. et al. 1999, ApJ, 518, 656
- Umemura, Fukue, & Mineshige (1997) Umemura, M., Fukue, J., & Mineshige, S., 1997, ApJ, 479, L97
- Weisskopf et al. (1995) Weisskopf, M. C., O’Dell, S. L., Elsner, R. F., & Van Speybroeck, L. P. 1995, Proc. SPIE, 2515, 312
- Weliachew, Fomalont, & Greisen (1984) Weliachew, L., Formalont, E. B., & Greisen, E. W. 1984, A&A, 137, 335
| Number | Source NameaaSources are named according to the Chandra Source Naming Convention
(http://asc.harvard.edu/udocs/naming.html).
For example, CXOM82 J095554.7+694101 is a source at (, )J2000=. |
Identification | Counting Rate ( c s-1) | |||
|---|---|---|---|---|---|---|
| InfraredbbThe Two Micron All Sky Survey (2MASS) Point Source Catalog (http://www.ipac.caltech.edu/2mass/) | RadioccMuxlow et al. (1994) | ddExtraction radius used to estimate the counting rate. The radii for Nos. 4, 5, and 6 were limited to below , because they are close to each other. | 1999 Oct 28 | 2000 Jan 20 | ||
| 1 | CXOM82 J095554.7+694101 | 0955547+694100 | 2.511.08 | 2.420.40 | ||
| 2 | CXOM82 J095552.3+694054 | 6.102.00 | 3.150.67 | |||
| 3 | CXOM82 J095551.6+694036 | 4.302.43 | 8.430.95 | |||
| 4 | CXOM82 J095551.4+694044 | 42.65+57.8 | 8.042.14 | 6.270.72 | ||
| 5 | CXOM82 J095551.1+694045 | 42.21+59.0 | 20.93.1 | 0.2920.505 | ||
| 6 | CXOM82 J095550.7+694044 | 0955507+694043 | 41.95+57.5 | 2.991.54 | 5.200.65 | |
| 7 | CXOM82 J095550.2+694047 | 41.30+59.6 or 41.5+59.7eeKronberg, Biermann, & Schwab (1985) | 71.15.9 | 5205 | ||
| 8 | CXOM82 J095547.5+694036 | 0955475+694036 | 24.83.1 | 4.890.66 | ||
| 9 | CXOM82 J095546.6+694041 | 4.631.48 | 22.81.2 | |||
| dynamical centerff = (Weliachew, Fomalont, & Greisen, 1984) | 1.791.48 | 0.1120.684 | ||||
Note. — Errors for the counting rates are given for 1 confidence.
(a) (b)