OPTICAL FOLLOW-UP OF THE REFLEX SURVEY: A NEW PERSPECTIVE IN CLUSTER STUDIES
After the completion of the catalogue built with ESO key program (REFLEX), we are beginning to explore the multiband optical characteristics of a subsample of those clusters selected in a statistically independent way. We have already observed in B, V, R, 9 of the about 50 clusters of the subsample, with . More time has been allocated by ESO for our project in March 2001. We will therefore be able to compare X-ray and optical morphologies and luminosities and, thanks to the large field of view of the WFI instrument, assess the luminosity function and the color segregation in the cluster on a robust statistical basis. In this poster we present the project, the technical problems we are facing in the reduction phase, and show the first preliminary results, which seem very encouraging.
1 Introduction
The study of individual cluster of galaxies can be considered as the repetition of the same experiment, conducted under varying sets of initial conditions. Unfortunately, the observer only has a comparatively poor knowledge of the ’exact’ initial conditions in each cluster/experiment. As the intrinsic and enviromental conditions cannot be chosen, a statistical approach is the only effective one in a proper attempt to extract the rules of the experiment, as it is very frequently the case in astronomy.
The problem of robust statistical sample selection of galaxy clusters has always been a concern, and only with X-ray astronomy — a tool which is more objective than optical identification — at astronomers’ disposal can such a selection be reliably performed. Furthermore, the X-ray luminosity offers an indirect but reliable estimate of the gravitational mass of the whole cluster as shown by the tight relation of the two cluster properties in recent work by Reiprich & Böhringer.
The cluster characteristics observed in the optical band are the goal of the present project and will be analyzed and catalogued as a function of the main X-ray properties.
1.1 The REFLEX sample
A unique opportunity in this sense is provided by the recent completion of the ESO key programme (REFLEX) aimed at the redshift measurement of all the candidate clusters selected in the ROSAT All Sky Survey (RASS) in the Southern Hemisphere. This programme (Böhringer et al. , Guzzo et al. , De Grandi et al. ) produced a well-controlled sample of 452 galaxy clusters down to a flux limit of erg sec-1 cm-2. Its X-ray luminosity vs. redshift distribution is reported in Fig. 1.


1.2 The subsample
A REFLEX subsample of about 50 clusters (Fig. 2) with redshift around 0.15 (Fig. 3) has thus been selected to begin an optical follow-up campaign in the three bands B, V, R. Nine out of these 50 clusters have already been observed in two different observation runs in the years 1999 and 2000 at the 2.2-m ESO Telescope in La Silla (Chile). Three more nights have been allocated for this project in March 2001.

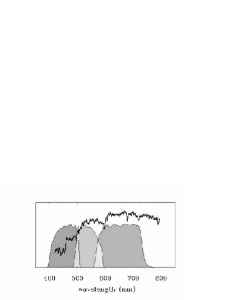
The instrument used for this study is the WFI (Wide Field Imager), which is a mosaic made of 8 CCDs to cover a total field of about 30’30’ (about 8000 8000 pxl). At redshift 0.15, this corresponds to a field of Mpc2 for each telescope pointing. This field is therefore ideal to best cover all the typical virial radii of clusters ( Mpc) and to analyze cluster properties on scales far from the centre. With the exposure times used, the limit magnitude in V is about 24. Figure 4 shows, for comparison, what we expect that a typical galaxy spectrum looks like at a redshift of 0.15. The bands we observed fall exactly in the right range to capture the 4000-break.
2 Our analysis
For the observation, we used a dithering pattern involving 6 exposures per cluster per colour which allows in the data reduction phase a reconstruction of the whole field of view with a fairly unifrom exposure ( of the exposure time). The end product shall be deep integrations of the entire virial regions of the clusters. For the calibration of the camera, we conduct observations of standard stars for each of the chips in each colour and monitor the photometric conditions with further standard star observations during the night.
For the reduction, the IRAF package has been used. In particular, the tasks esowfi and mscred are specifically designed to face mosaic reduction of ESO WFI data.
The data reduction process (still in fieri) has proved particularly demanding.
2.1 Astrometric correction
At first, the problem of astrometric correction has to be faced. The tasks used by IRAF make use of Valdes’ (1998) correction. In order to do this, the procedure we applied is the following. Given one of the images either of the 6 dithering sequence or of the standard star fields, by use of Skycat, it was compared with an external star catalogue (USNO). The comparison involves two steps:
-
1.
an initial rough spatial shift on the plane, due to the fact that the center of the CCD (and of the telescope) and of Valdes’ correction do not coincide and due to the telescope pointing imprecision;
-
2.
a more precise matching, which is obtained by three corrections applied to the image: tangent point shift, fractional scale change and axis rotation.
This latter phase is obtained by IRAF by comparing the intensity peaks of the image with the given catalogue. The choice of the points to exclude from the fit is obtained by manual correction to avoid spurious “detections” and minimize the rms.
Subsequently, another catalogue is obtained with SEXTRACTOR (Bertin & Arnouts ) from the corrected image, which is in turn used for the other images of the sequence (of dithering images or of star fields) for the astrometric correction. Clearly, it is the correspondence with this internal catalogue to be important, since, once the dithered images are corrected, when they will have to be stacked, it is the internal precision that will affect the goodness of the final (cluster) image. This second process is analogous to the aforementioned one, except for the use of the other catalogue.
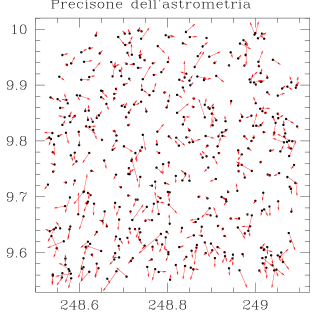
In Fig. 5 we show, as an example, the corrections applied astrometrically on one of our star field images with respect to the external catalogue. The final error we obtain in the comparison with the internal catalogue is about arcsec, well within an acceptable range, considering that the error in the USNO is about 0.4 arcsec.
2.2 Photometric correction
The procedure used for the subtraction of the flat field, should guarantee that the chip-to-chip variations are taken care of. In order for us to verify that this is actually the case, we developed a process that allows us to check that these originally non-negligible variations are effectively reduced.
In Fig. 6 we represent the 2-by-2 comparisons between different catalogues obtained from images of the same stellar field, for which a comparison of the objects on the th CCD with the same th CCD in another image is available (). These values have been averaged out and normalized to 0 (the small number on the bottom of each plot indicates the averaged number that has been added to the values for this normalization). Accepted were only those variations mag; dashed lines have then been traced.


For those couples of catalogues for which the values were acceptable, the values of the calibration (excluding the normalization) for the CCDs (with ) have been calculated, as shown in Fig. 7.
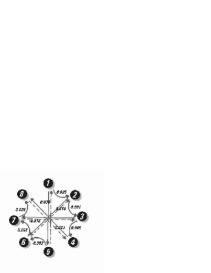
Finally, on Fig. 8 we sketched the numbers which need to be used to move from one chip to the other. Only one star field image sequence has been used to obtain those numbers and only one filter. Numbers still need refinment, but the results shown indicate that the flat field subtraction seems to be sufficient to correct for the chip-to-chip variations.
3 Preliminary results
A preliminary Luminosity Function in V of the area of the core of cluster R1540, performed on only 1 of the 6 dithered images of the cluster (1 chip) is shown on Fig. 10. Even if the image is only a number count of the objects based on a simple SEXTRACTOR result (no backgound subtracted), it still shows an interesting trend. For comparison, we show on the right panel of Fig. 10 a figure coming from Molinari . In the plot of the 5 low redshift clusters the bimodality separating the giant from the dwarf ellipticals is evident.
![[Uncaptioned image]](/html/astro-ph/0009251/assets/x9.png) Figure 9: Number counts of the core of cluster R1540. Errors are poissonian.
Bins are of 0.5 mag. Time of exposure is of the order of 7 min. For mag clearly we begin missing something.
Figure 9: Number counts of the core of cluster R1540. Errors are poissonian.
Bins are of 0.5 mag. Time of exposure is of the order of 7 min. For mag clearly we begin missing something.
![[Uncaptioned image]](/html/astro-ph/0009251/assets/x10.png) Figure 10: This image comes form Molinari 5 and shows the
bimodality between giant and dwarf ellipticals in a sample of 5 low
redshift clusters.
Figure 10: This image comes form Molinari 5 and shows the
bimodality between giant and dwarf ellipticals in a sample of 5 low
redshift clusters.
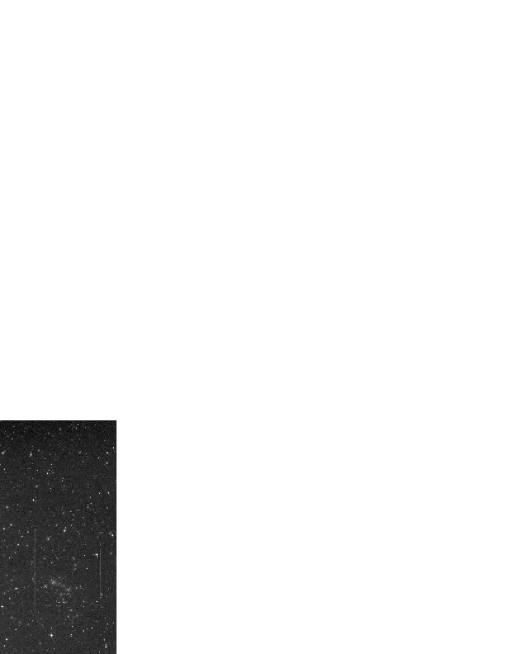
The core of cluster R1540 is the one shown in the background image of the poster presented (Fig. 11).
Acknowledgments
We would like to thank S. Benetti and A. Zacchei (TNG staff) for help in producing the poster background image (Fig. 11) and L. Rizzi for his constant help and precious tips and suggestions in the data reduction process. We are also very grateful to A. Moretti for valuable help in the clusters observations.
References
References
- [1] E. Bertin & S. Arnouts, A&AS 117, 393B (1996).
- [2] H. Böhringer, Guzzo, C.A. Collins, et al., proceedings of the 14th IAP Meeting Wide Field Surveys in Cosmology, Y.Mellier & S. Colombi (eds) , (1998), see also astro-ph/9809381.
- [3] S. De Grandi, H. Böhringer, L. Guzzo, et al., ApJ 514, 148 (1999).
- [4] L. Guzzo, H. Böhringer, P. Schuecker, et al., The Messenger 95, 27 (1999).
- [5] E. Molinari, proceedings of the Johannesburg Conference Toward a New Millenium in Galaxy Morphology, D.L. Block, I. Puerari, A. Stockton, and D. Ferreira (eds) , 685 (1999).
- [6] R.C. Kennicutt, Jr., ApJS 79, 255K (1992).
- [7] T. Reiprich & H. Böhringer, Astr. Nachr. 320, 296 (1999).