Evidence for Massive Black Holes
in Nearby Galactic Nuclei
\toctitleEvidence for Massive Black Holes
in Nearby Galactic Nuclei
*
Abstract
Masses of black holes in nearby galactic nuclei can be measured in a variety of ways, using stellar and gaseous kinematics. Reliable black hole masses are known for several dozen objects, so that demographic questions can start to be addressed with some confidence. Prospects for the near future are discussed briefly.
1 Introduction
Active galaxies and quasars are powered by physical processes in an accretion disk surrounding a massive black hole [37, 54]. The observed number of active galaxies increases towards high redshift , so that many ‘normal’ galaxies must have been active in the past [59]. This implies that inactive massive central black holes must lurk in the nuclei of nearby normal galaxies. In the past decade, much work has been done to measure the masses of these black holes, to establish the relation between black hole mass and the global/nuclear properties of the host galaxy, and to understand the role these objects play in driving internal dynamical evolution [47, 64].
A black hole of mass in a galactic nucleus dominates the gravitational potential inside the so-called radius of influence which is usually defined as , where is the gravitational constant, and is the characteristic velocity dispersion in the host galaxy. In physical units
| (1) |
For a galaxy at distance , corresponds to an angular size
| (2) |
Inside the sphere of influence, the black hole generates a central cusp in the density distribution of the stars. The resulting density and luminosity with [53]. The typical velocities scale with radius.
While many early-type galaxies have cusps in their central luminosity profiles [9, 18, 33], these by themselves are not proof of the presence of a black hole, as other processes can generate such cusps [34]. For this reason most studies concentrate on obtaining spectroscopy at the smallest angular scales, to find evidence for the expected Keplerian rise in the velocities of stars and gas. This requires high spatial resolution. For example, the black hole in the nucleus of the galaxy M87 [31] in the Virgo cluster has . The general approach is to determine the luminous mass in stars from the observed surface brightness distribution, and to compare this with the dynamical mass derived from kinematic measurements of stars or gas [32, 55]. If one can show that the mass density inside a certain radius is larger than anything that can be produced by normal dynamical processes, then the object is considered to be a black hole. In a few cases it is possible to find direct evidence for the presence of a relativistic object (§3).

Figure 1 shows as defined in eq. (1) for the best published black hole mass determinations versus the distance to the host galaxy. Lines of constant angular resolution run diagonal. The early determinations clustered near [56], but HST has pushed this to . Detailed modeling has shown that, depending on the internal dynamical structure of the host galaxy, the effects of the black hole often are visible only inside projected radii that are significantly smaller than (e.g., eq. (4.2) in [52]). This suggests that measured masses corresponding to should be treated with caution, as they are likely to be overestimates (see §4). At present, only VLBI measurements can probe the regime .
2 Stellar dynamical modeling
The nearest galactic nucleus is the center of our own Galaxy. Despite the large foreground extinction, it is possible to resolve individual stars in the Galactic center in the infrared, and to measure not only their radial velocities, but also their proper motions [15, 28], and accelerations [29]! Dynamical modeling of this remarkable data provides unequivocal proof that our Galaxy contains a central black hole of nearly three million solar masses.
The dynamics of the nuclei of nearby early-type galaxies can be probed with stellar absorption-line spectroscopy of the integrated light. This generally requires long exposure times. The orbital structure in these systems is rich [47, 64], so a true inward increase of the mass-to-light ratio must be distinguished from radial variation of the velocity anisotropy. This can be done by measuring the shape of the line-of-sight velocity distribution [27, 41]. The orbital structure is related to the intrinsic shape of the galaxy. This can be constrained by measurements along multiple position angles [5, 44], or, even better, by integral-field spectroscopy (§5).
Determination of the black hole mass and the orbital structure requires construction of dynamical models. There has been a steady increase in the sophistication of model construction in the past decade. Early isotropic spherical models were replaced by anisotropic spheres, and then by axisymmetric models with a special orbital structure (phase-space distribution function where is the orbital energy and is the angular momentum component parallel to the symmetry axis, e.g., [52]). More recently axisymmetric models with the full range of possible anisotropies, and multiple components have been used. The first such study was done for M32, and included ground-based data along four position angles and eight FOS pointings [44]. The model was constructed by a version of Schwarzschild’s [57] numerical orbit-superposition method, which fits the surface brightness distribution as well as all kinematic observables [13].
Another example of this approach is provided by the E7/S0 galaxy NGC 4342 in Virgo. This is a low-luminosity object, seen nearly edge-on, with a prominent nuclear stellar disk. Cretton & van den Bosch [12] used ground-based major-axis kinematics from the WHT and five FOS pointings [7], and compared these with general axisymmetric models containing a spheroid, a stellar disk, a nuclear disk and a black hole. Free parameters in the modeling were and the stellar mass-to-light ratio . Contours of constant in the -plane show that the best fit is obtained for , but with a significant uncertainty (Figure 2).

To date, black hole masses have been derived in this way for about fifteen objects. The full analysis has been published only for M32 [44], N4342 [12], and NGC3379 [24], all based on ground-based and FOS data. Black hole masses based on three-integral axisymmetric modeling of STIS absorption-line spectroscopy have been reported for a dozen objects by Gebhardt’s group [25], but the data and the models have not yet been published.
While in some cases axisymmetric models are consistent with the data, in others they clearly are inadequate (§5). The nucleus of M31 has been known to be asymmetric since 1974 [36]. Observations with the integral-field spectrograph TIGER revealed that the black hole resides in the secondary peak in the brightness distribution [3], and led to models with an asymmetric distribution of stars [62]. Measurements with OASIS on the CFHT [2] have shown that HST spectroscopy with FOC [60], FOS and STIS along the apparent symmetry axis of the eccentric structure has in fact missed the kinematic major axis. A comprehensive non-axisymmetric model that fits this data will teach us much about the structure and formation of this nearby nucleus.
Some nearby galactic nuclei are shrouded in dust, and their internal kinematics is best probed at longer wavelengths. This is now possible through the availability of near-IR spectrographs, which employ the CO bandhead at 2.3 to derive the stellar kinematics. Anders [1] used the MPE-built 3D integral-field unit to show that the derived nuclear kinematics in the largely dust-free nearby galaxy NGC 3115 agrees with the kinematics measured at shorter wavelengths [16], demonstrating that this approach works. 3D observations of the luminous merger remnant NGC 1316 (Fornax A) confirmed the central of 230 km/s obtained at short wavelengths from the ground and with FOS [58], suggesting [14]. Instruments such as SINFONI will probe nearby dusty nuclei with a resolution similar to HST [46].
3 Gas kinematics
Optical emission lines. The nuclei of active early-type galaxies, and those of most spirals, contain extended optical emission-line gas. Its kinematics can be used to constrain the central mass distribution. In this case the exposure times can be relatively short, but care must be taken to model possible non-circular motions and the effects of turbulence in the gas disks.
High spatial resolution emission-line kinematics (FOC, FOS and STIS), together with careful modeling, has been published for six cases: M87, NGC 4261, NGC 4374, NGC 6251, NGC 7052, IC 1459 [8, 20, 21, 38, 42, 63]. These very luminous early-type galaxies cover a modest range in total luminosity, but the derived black hole masses vary by a factor of ten.
An example of this approach is provided by the E3 galaxy IC 1459. This giant elliptical hosts a compact nuclear radio source, has a counter-rotating stellar core (), a shallow cusp in the luminosity profile, and a blue central point source [9, 23]. FOS kinematics of the emission-line gas associated with the nuclear dust-lane reveals a disk in rapid rotation (Figure 3), with significant velocity dispersion. Detailed models for the gas motions which include the effects of turbulence show that [63], which is a factor of ten smaller than the mass suggested by axisymmetric models of the ground-based stellar kinematics along the major axis. A general stellar dynamical model that incorporates major-axis STIS spectroscopy and ground-based spectroscopy along four position angles is under construction.

Kinematics of emission-line gas will provide many black hole masses in the near future. Ongoing HST programs include H emission-line spectroscopy with STIS for 21 radio-loud ellipticals (PI Baum) and 54 Sb/Sc spirals (PI Axon). These studies generally use three parallel slits to measure possible deviations from simple circular motion.
Masers. Nuclear maser emission can be measured with VLBI techniques in a few spiral galaxies. This achieves the highest spatial resolution to date, but is possible only when the circumnuclear disk is nearly edge-on. A search of 700 nuclei revealed maser emission in 22 cases, and disk-like kinematics in six of these [50]. The best black hole mass determinations are for NGC 1068, NGC 4258, and NGC 4945 [30, 49].
X rays. Recently, it has become possible to measure the profile of the Fe K line at 6.4 keV in the nuclei of nearby Seyfert galaxies [51]. The width of this line approaches km/s, which is direct evidence that the emitting gas must be near the Schwarzschild radius of a relativistic object. The mass of the black hole, and possibly its spin, can be derived from the detailed shape of the line profile [19, 45]. The latest generation of X-ray telescopes, in particular CHANDRA and XMM, will extend this work to more objects.
Reverberation mapping. The observed time-variation of broad H emission lines from Seyfert nuclei can be used to derive the radius of the broad-line region by means of the light travel-time argument [6]. In combination with simple kinematic models for the motion of the broad-line clouds, this provides an estimate of the mass of the central object responsible for these motions. Early mass determinations appeared to be systematically lower than those obtained by other means [32], but this discrepancy has now disappeared [26].
4 Demographics
For the past five years, our understanding of black hole demography was summarized in a diagram of black hole mass versus absolute bulge luminosity , where the ‘bulge’ was taken to be the entire galaxy for an elliptical or lenticular, or the actual bulge in case of a spiral [35, 55]. Early work based on simple axisymmetric Jeans models and ground-based kinematics [39] was interpreted as evidence for a tight correlation of with , and hence with the total mass of the bulge. Much effort was spent in trying to reproduce this correlation in models of galaxy formation, and in relating it to the energy production in quasars [55].
More appropriate dynamical models combined with HST kinematics have generally resulted in a downward revision of the earlier masses [25, 32, 40]. Figure 4a is the resulting demography diagram for the best determinations. It shows a rough correlation, but with a large range in at fixed . The masses are consistent with various black hole formation scenarios [40, 61], and they agree with the quasar light prediction for reasonable efficiencies [55, 59]. However, there is an observational bias against detecting small black holes in large galaxies, i.e., for cases where the radius of influence is simply smaller than the spatial resolution currently achievable.

Absolute galaxy luminosity correlates with velocity dispersion [17], so is expected to correlate with , measured outside the radius of influence of the black hole. As illustrated in Figure 4b, the scatter in this correlation is considerably less than in the versus correlation [22, 25]. A good fit is provided by , where is the velocity dispersion at , and is the effective radius [48]. This suggests yet another link between global and nuclear galaxy properties, but it is not understood what causes this link, or whether there are other parameters involved. Some of the galaxies in the diagram are not axisymmetric, so the black hole mass derived from axisymmetric modeling may need revision.
Substitution of the versus correlation in eq. (2) provides the following estimate of the formal radius of influence of the black hole:
| (3) |
As noted in §1, the actual radius of influence may be smaller. Assuming that eq. (3) is valid for all galaxies (which is not proven) allows one to use a ground-based velocity dispersion measurement to estimate the minimum resolution needed to measure a reliable black hole mass.
5 Next steps
There is strong evidence for the existence of massive black holes in most galactic nuclei, based on different measurement approaches. Our understanding of black hole demographics is still limited, because the number of reliable mass measurements is relatively modest. Significant improvement is expected through spectroscopic surveys of galactic nuclei with emission-line gas, and through further work on stellar absorption-line kinematics.
To make further progress, high-resolution observations of the nuclei obtained with STIS onboard HST, and with adaptive optics from the ground (e.g., OASIS on the CFHT, SINFONI on the VLT), need to be complemented with the wide-field kinematics of the host galaxy, in order to measure its intrinsic shape and orbital structure [5, 64]. For this reason, the dynamics groups of the universities at Lyon, Leiden, and Durham have built the special-purpose integral-field spectrograph SAURON for the WHT, with high throughput, and a field of view of sampled at [4, 65], and are using it to observe a representative sample of 80 nearby early-type galaxies.
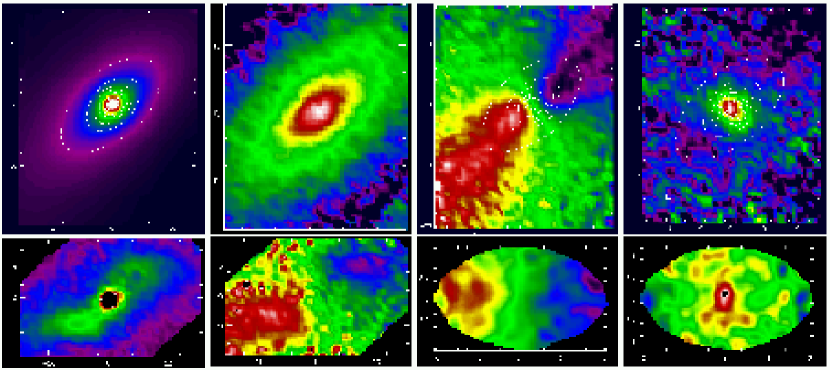
Figure 5 shows integral-field kinematics for the E6 galaxy NGC 3377 [10, 11]. The SAURON maps of the stellar and gaseous motions reveal that this galaxy is not axisymmetric. The minor axis rotation persists in the high-spatial resolution measurements with OASIS. NGC 3377 has a steep-cusped central luminosity profile, and the expectation based on general dynamical arguments is that this galaxy should be nearly axisymmetric, at least in the inner regions [47, 64]. It will be interesting to probe this galaxy at even higher spatial resolution, to establish whether the nucleus is axisymmetric and the derived black hole mass correct, or whether the non-axisymmetry persists, and our understanding of the nuclear dynamics needs modification. Either way, the codes for numerical model construction need to be generalized to triaxial geometry, and to asymmetric systems such as the nucleus of M31.
The ongoing systematic programs will reveal the black hole demographics as a function of Hubble type, radio properties, intrinsic shapes, and internal dynamics. It will also establish the rate of occurrence of gaseous and stellar nuclear disks, and of nuclear star clusters, and the importance of black hole driven secular dynamical evolution for shaping galaxies.
It is a pleasure to acknowledge comments and contributions by Nicolas Cretton, Roeland van der Marel, Gijs Verdoes Kleijn, and the SAURON team.
References
- [1] Anders S., 1999, PhD Thesis, Ludwig–Maximilians Univ., München
- [2] Bacon R., 2000, in NGST Science and Technology, eds E.P. Smith & K. Long, ASP Conf. Ser., 207, p. 333
- [3] Bacon R., Emsellem E., Monnet G., Nieto J.L., 1994, AA, 281, 691
- [4] Bacon R., et al., 2000, MNRAS, submitted
- [5] Bak J., Statler T.S., 2000, preprint (astro-ph/0003468)
- [6] Blandford R.D., McKee C.F., 1982, ApJ, 255, 419
- [7] van den Bosch F.C., Jaffe W., van der Marel R.P., 1998, MNRAS, 293, 343
- [8] Bower R., et al., 1998, ApJ, 492, L111
- [9] Carollo C.M., Franx M., Illingworth G.D., Forbes D., 1997, ApJ, 481, 710
- [10] Copin Y., 2000, PhD Thesis, ENS, Lyon
- [11] Copin Y., Cretton N., et al., 2000, in prep.
- [12] Cretton N., van den Bosch F.C., 1999, ApJ, 514, 704
- [13] Cretton N., de Zeeuw P.T., van der Marel R.P., Rix H.W., 1999, ApJS, 124, 383
- [14] Davies R.L., in Imaging the Universe in Three Dimensions, eds W. van Breugel & J. Bland–Hawthorn, ASP Conf. Ser., 195, p. 134
- [15] Eckart A., Genzel R., 1997, MNRAS, 284, 576
- [16] Emsellem E., Dejonghe H., Bacon R., 1999, MNRAS, 303, 495
- [17] Faber S.M., Jackson R., 1976, ApJ, 204, 668
- [18] Faber S.M., et al., 1997, AJ, 114, 1771
- [19] Fabian A.C., Rees M.J., Stella L., White N.E., 1989, MNRAS, 238, 729
- [20] Ferrarese L., Ford H.C., Jaffe W., 1996, ApJ, 470, 444
- [21] Ferrarese L., Ford H.C., 1999, ApJ, 515, 583
- [22] Ferrarese L., Merritt D.R., 2000, astro-ph/0006053
- [23] Franx M., Illingworth G.D., 1988, ApJ, 327, L55
- [24] Gebhardt K., et al., 2000a, AJ, 119, 1157
- [25] Gebhardt K., et al., 2000b, astro-ph/0006289
- [26] Gebhardt K., et al., 2000c, astro-ph/0007123
- [27] Gerhard O.E., 1993, MNRAS, 265, 213
- [28] Ghez A.M., Klein B.L., Morris M., Becklin E.E., 1998, ApJ, 509, 678
- [29] Ghez A.M., 2000, AGM, 16, 42
- [30] Greenhill L.J., Gwinn C.R., Antonucci R., Barvainis R., 1996, ApJ, 481, L23
- [31] Harms R.J., et al., 1994, ApJ, 435, L35
- [32] Ho L., 1998, in Observational Evidence for Black Holes in the Universe, ed. S.K. Chakrabarti (Dordrecht: Kluwer), p. 157
- [33] Jaffe W., Ford H.C., O’Connell R.W., van den Bosch F.C., Ferrarese L., 1994, AJ, 108, 1567
- [34] Kormendy J., 1993, in IAU Symp. 153 Galactic Bulges, eds H. Dejonghe & H.J. Habing (Dordrecht: Kluwer), p. 209
- [35] Kormendy J., Richstone D.O., 1995, ARA&A, 33, 581
- [36] Light E.S., Danielson R.E., Schwarzschild M., 1974, ApJ, 194, 257
- [37] Lynden-Bell D., (1969), Nature, 233, 690
- [38] Macchetto F.D., Marconi A., Axon D.J., Capetti A., Sparks W., Crane P., 1997, ApJ, 489, 579
- [39] Magorrian J., et al., 1998, AJ, 115, 2285
- [40] van der Marel R.P., 1999, AJ, 117, 744
- [41] van der Marel R.P., Franx M., 1993, ApJ, 407, 525
- [42] van der Marel R.P., van den Bosch F.C., 1998, AJ, 116, 2220
- [43] van der Marel R.P., de Zeeuw P.T., Rix H.W., Quinlan G.D., 1997a, Nature, 385, 610
- [44] van der Marel R.P., Cretton N., de Zeeuw P.T., Rix H.W., 1998, ApJ, 493, 613
- [45] Martocchia A., Karas V., Matt G., 2000, MNRAS, 312, 817
- [46] Mengel S., Eisenhauer F., Tezca M., Thatte N., Röhrle C., Bickert K., Schreiber J., 2000, SPIE, 4005, 301
- [47] Merritt D.R., 1999, PASP, 111, 129
- [48] Merritt D.R., Ferrarese L., 2000, astro-ph/0008310
- [49] Miyoshi M., et al., 1995, Nature, 373, 173
- [50] Moran J., 2000, talk at Oort Workshop April 2000, Leiden University
- [51] Nandra K., George I.M., Mushotzky R.F., Turner T.J., Yaqoob J., 1997, ApJ, 477, 602; 1999, ApJ, 523, L17
- [52] Qian E.E., de Zeeuw P.T., van der Marel R.P., Hunter C., 1995, MNRAS, 274, 602
- [53] Quinlan G.D., Hernquist L., Sigurdsson S., 1995, ApJ, 440, 554
- [54] Rees M.J., ARA&A, 22, 471
- [55] Richstone D.O., et al., Nature, 395A, 14
- [56] Rix, H.W.: 1993, in IAU Symposium 153, Galactic Bulges, eds H. Dejonghe & H.J. Habing (Dordrecht: Kluwer), p. 423
- [57] Schwarzchild M., 1979, ApJ, 232, 236
- [58] Shaya E., 1999, priv. comm.
- [59] Soltan A., 1982, MNRAS, 200, 115
- [60] Statler T.S., King I.R., Crane P., Jedrzejewski R.I., 1999, AJ, 117, 894
- [61] Stiavelli M., 1998, ApJ, 495, L91
- [62] Tremaine S.D., 1995, AJ, 110, 628
- [63] Verdoes Kleijn G.A., van der Marel R.P., Carollo C.M., de Zeeuw P.T., 2000, AJ, 120, in press
- [64] de Zeeuw P.T., 1996, in Gravitational Dynamics, eds O. Lahav, E. Terlevich & R.J. Terlevich (Cambridge University Press), p. 1
- [65] de Zeeuw P.T., et al., 2000, ING Newsletter, 2, 11