Optical Spectra of Type Ia Supernovae at 0.46 and 1.2
Abstract
We present optical spectra, obtained with the Keck 10-m telescope, of two high-redshift type Ia supernovae (SNe Ia) discovered by the High-z Supernova Search Team: SN 1999ff at =0.455 and SN 1999fv at 1.2, the highest-redshift published SN Ia spectrum. Both SNe were at maximum light when the spectra were taken. We compare our high- spectra with low- normal and peculiar SNe Ia as well as with SNe Ic, Ib, and II. There are no significant differences between SN 1999ff and normal SNe Ia at low redshift. SN 1999fv appears to be a SN Ia and does not resemble the most peculiar nearby SNe Ia.
To appear in The Astrophysical Journal Letters
1 INTRODUCTION
Cosmological tests using high-redshift type Ia supernovae (SNe Ia) rule out an =1 universe (Garnavich et al., 1998; Perlmutter et al., 1998) and provide evidence for an acceleration of the cosmic expansion (Riess et al., 1998; Perlmutter et al., 1999), attributed to a nonzero cosmological constant (). The statistical weight of these results is high, so the current focus of our High-z Supernova Search Team (Schmidt et al., 1998) is on systematic effects, most of which can be convincingly tested using SNe at 0.8, regardless of their precise nature. We expect dimming from systematic effects to grow larger with increasing redshift. However, the effect of a nonzero on apparent magnitude can decrease with increasing redshift, due to the different redshift dependence of and (see Figure 4 of Filippenko & Riess 2000). Obtaining data for SNe at 0.8 is therefore critical for testing systematic bias versus real cosmological effects and the presence of a nonzero .
In addition to photometry of high- SNe Ia needed to determine a luminosity distance for the Hubble diagram, we obtain spectra of our SNe to measure the redshift, determine the supernova type, and look for spectral differences between the low- and high- SN Ia populations that may indicate evolution of SNe with time. Here we present spectra of two high- SNe Ia and address uncertainties in using the spectra to determine redshifts and the SN type. Details of the observing program, finder charts, and light curves will be presented by Tonry et al. (2001).
2 OBSERVATIONS AND REDUCTIONS
SN 1999ff (Tonry et al., 1999) was observed with LRIS (Oke et al. 1995) on the Keck-II 10-m telescope on 1999 November 8 UT with 0.7 seeing. Use of a 1 slit and the 150 line mm-1 grating resulted in a spectral resolution of 20 Å. The total exposure time was 2200 s, divided into three exposures dithered 10 along the slit to reduce the effects of fringing. The slit was oriented at a position angle (PA) of 156∘ to include the galaxy nucleus. SN 1999fv (Tonry et al., 1999) was observed with the same setup on 1999 November 10 UT. The seeing was 0.9, and a slit width of 0.7 resulted in a spectral resolution of 16 Å. The slit was oriented to PA=252∘ to include a star. The total exposure time was 6000 s, taken in four dithered frames. SN 1999fv was also observed on 1999 November 11 UT with the 400 line mm-1 grating, with a 1.0 slit at the same PA and 1 seeing, in four dithered exposures of 1000 s each. Standard CCD processing and optimal spectral extraction were done with IRAF, and we used our own IDL routines to calibrate the wavelengths and flux of the spectra and to correct for telluric absorption bands. The SN 1999fv data from both nights were combined, after binning to the same resolution. Only the first two exposures from November 11 were used, as the last two were overwhelmingly dominated by sky noise.
3 DISCUSSION
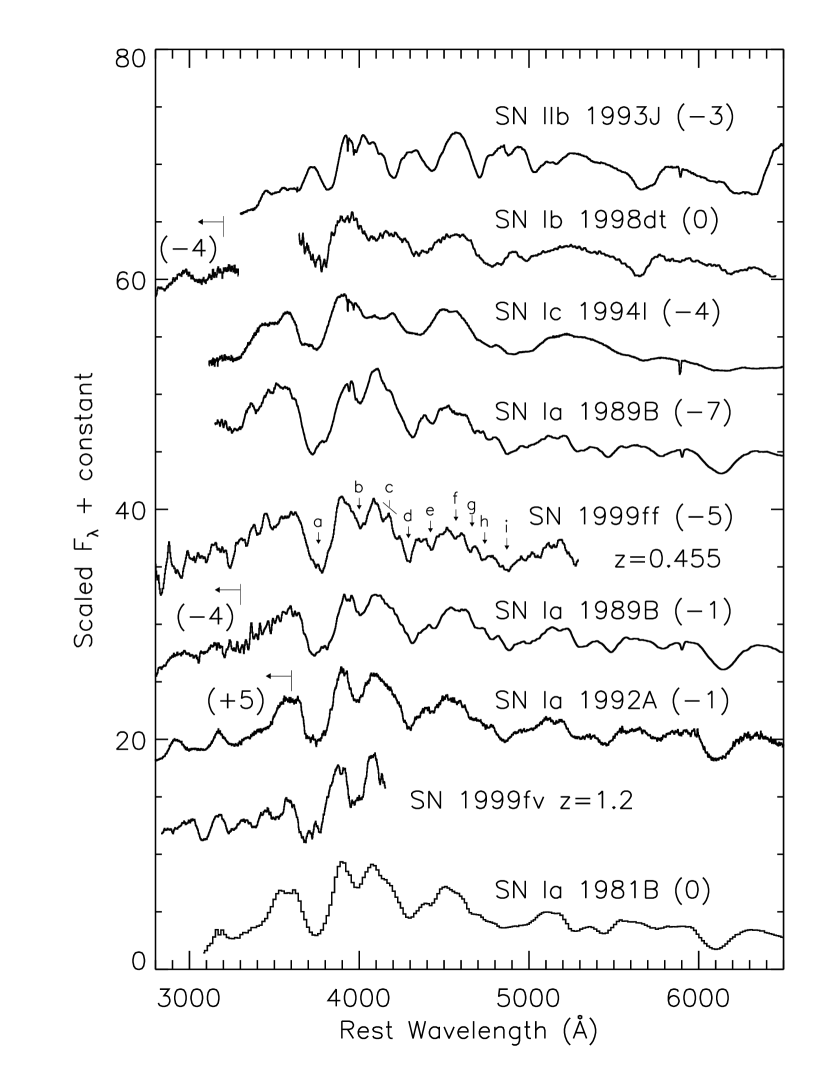
Rest-frame spectra of SN 1999ff and SN 1999fv are shown in Figure 1. The observed wavelength range for SN 1999ff is 4050–7700 Å, corresponding to 2785–5290 Å in the rest frame, while for SN 1999fv the observed wavelength range is 6200–9150 Å, corresponding to 2830–4180 Å in the rest frame. SN 1999ff is located 2′′ from the center of a large, bright elliptical galaxy with =19.1 mag, whereas the SN was 23 mag. To eliminate contamination from the host galaxy, we scaled and subtracted the host galaxy spectrum from the SN spectrum. The high- spectra have been smoothed with a Savitsky-Golay filter (Press et al., 1992), a polynomial fit that preserves line features better than boxcar smoothing. The spectra of SN 1999ff and SN 1999fv were heavily smoothed with a 70 Å and 180 Å filter width, respectively, in the rest frame.
For SN 1999ff we estimate the age based on its spectral features (Riess et al., 1997) to be –5 2 days. Photometric data of SN 1999ff will be presented by Tonry et al. (2001) and will determine the true epoch of maximum brightness. SN 1999fv was significantly fainter and we were unable to get a reliable spectral age for it, in part due to the lack of available early-time spectra of low- SNe Ia that extend blueward of 4000 Å.
The redshift of the host galaxy of SN 1999ff is =0.455 0.001, as determined by Balmer absorption lines in its spectrum, and we adopt this redshift for the SN. The host galaxy of SN 1999fv was not visible in our images, and to calculate the redshift of this SN we cross-correlated the high- spectrum with several low- SN Ia spectra near maximum light (as defined by the -band maximum), the ages of which are determined from their light curves. Correlating against a sample of 31 spectra with ages between 8 days to +5 days relative to maximum, the redshift of SN 1999fv is =1.17-1.22 for the unsmoothed spectrum, somewhat lower than the initial estimate of Tonry et al. (1999; =1.23) made at the telescope. Using the same technique on the spectrum of SN 1999ff, correlating against a sample of 18 spectra with ages between –7 and –3 days, we find =0.4580.006, consistent with the host galaxy redshift. We also include galaxy and M-star spectra among our templates for cross-correlation, which did not fit the high- spectra well.
The redshift of SN 1999fv has the quoted uncertainty (1.17–1.22) due to the low signal-to-noise (S/N) ratio of the spectrum, and to its high redshift placing key SN features near bright sky lines at observed wavelengths Å. In order to check the validity of our redshift estimates, we performed blind tests with fake spectra added to the 2D frames. We redshifted each of 14 low- SN Ia spectra by an arbitrary amount between =0.5 and =1.3, scaled the flux level down to the signal of SN 1999fv in each 1000 s exposure, and added Poisson noise. We added the spectra to the 2D frames (which are dominated by sky emission), convolving the signal with a Gaussian across several pixels perpendicular to the dispersion, imitating seeing effects. Each spectrum was then extracted, and we verified that its S/N ratio as a agreed with that of SN 1999fv. The spectrum was smoothed heavily with a Savitsky-Golay filter to get an initial redshift estimate by eye, and subsequently cross-correlated with a database of low-z spectra to find a quantitative redshift estimate and uncertainty. We obtained good results for 12 of the 14 spectra, all of which matched the input redshift to within the error bars. For one spectrum we were unable to estimate the redshift, as the signal was dominated by sky lines and SN features were not clearly visible. For another spectrum we obtained two equally likely redshifts, one of which was the correct input redshift. In neither of these two cases were we led to believe an incorrect redshift. The redshift range for SN 1999fv of z=1.17–1.22 is roughly a 95-confidence level, based on the tests done. It is important to note that the difference in luminosity distance at z=1.17 and z=1.22 is 0.11 mag (5) which is much smaller than our distance uncertainty. This redshift uncertainty therefore has negligible impact on our ability to constrain cosmology.
The largest concern with using SNe Ia in cosmological tests is a possible photometric difference between the low- and high- samples. Spectral comparisons of the distant and nearby SNe could show subtle evolutionary effects, if present. If the spectra do not show differences, this does not prove that the peak luminosities of the SNe are identical, but it does build confidence that the two samples are similar. Spectra of normal, nearby SNe Ia at the same phase are quite homogeneous (Branch et al., 1993; Filippenko, 1997; Riess et al., 1997). As a qualitative comparison with our high- spectra, we present in Figure 1 spectra of four low- SNe Ia near the same epoch: SN 1989B at both –7 and –1 days relative to maximum (Wells et al., 1994), SN 1992A at –1 day (Kirshner et al., 1993), and SN 1981B at maximum (Branch et al., 1983). The SN 1989B spectra have been dereddened by – )=0.32 mag (Wells et al., 1994). The –1 day SN 1989B spectrum is a composite of a CTIO spectrum redward of 3300 Å and an International Ultraviolet Explorer (IUE) spectrum from –4 days blueward of 3300 Å. The SN 1992A spectrum is a composite of a CTIO spectrum redward of 3600 Å and a Hubble Space Telescope () spectrum blueward of 3600 Å, taken 5 days after maximum (Kirshner et al., 1993). For comparison we also show SNe II, Ib, and Ic spectra: SN IIb 1993J (Filippenko, Matheson, & Ho, 1993), SN Ib 1998dt at maximum (Jha et al., 1998), and SN Ic 1994I at –4 days, dereddened by – )=0.45 mag (Filippenko et al. 1995; see Filippenko 1997 for a discussion of SN subclasses). The SN 1998dt spectrum has been smoothed with a 30 Å Savitsky-Golay filter. We also show an IUE spectrum of SN Ib 1983N at –4 days from 2800 Å to 3300 Å (Cappellaro, Turatto, & Fernley, 1995) at the blue end of the SN Ib 1998dt spectrum to compare with the high- spectra. The SN IIb 1993J spectrum, taken 16 days past discovery and –3 days relative to maximum, resembles a relatively normal SN II.
The SN 1999ff spectrum exhibits many of the features seen in the low- SN Ia spectra, most prominently the deep Ca II H&K absorption (“a”), the Si II 4130 dip blueshifted to 4000 Å (“b”), Fe II 4555 and/or Mg II 4481 (“d”), and Si II 5051 (“i”). There are several weaker features seen in all of the low- SN Ia spectra that are also apparent in the spectrum of SN 1999ff, including a shoulder blueward of Fe II 4555 (“c”), Si III 4560 (“e”), S II 4816 (“f”), and Fe II/S II blends (“g” and “h”). All line identifications (but not the specific letter labels) are from Jeffery et al. (1992), Kirshner et al. (1993), and Mazzali et al. (1993). Unfortunately, the SN 1999ff spectrum does not extend to rest wavelength 6150 Å, where the Si II 6355 feature is prominent in SNe Ia and much less apparent in SNe Ic/Ib. This line is the usual diagnostic for distinguishing between SNe Ia and Ib/Ic. SN 1999ff does not, however, resemble the spectra of SN Ib 1998dt or SN Ic 1994I, in which the Si II and Si III features “b” and “e” are either very weak or absent. The SN Ib and Ic spectra also have a broad peak centered at 5250 Å that is not seen in SN 1999ff or the SN Ia spectra. A comparison with the SN IIb 1993J spectrum shows that while SN 1993J does have Ca II H&K (“a”) and absorption at 3980 Å due to blueshifted H which results in a double-peak centered just blueward of 4000 Å, the resemblance with SN 1999ff redward of 4100 Å is poor. Very early SN II spectra are blue and nearly featureless and would be easily classified; they begin to resemble the SN IIb 1993J spectrum shown here a few weeks after discovery.
Due to its high redshift, the spectrum of SN 1999fv does not have broad rest-frame coverage and does not extend redward of 4200 Å. SN 1999fv does display the Ca II H&K feature (“a”) as well as Si II 4130 (“b”). In the UV region of the spectrum, there are perhaps hints of small rises at 3150 Å and just blueward of 3000 Å, as seen in the IUE spectra of SN Ia 1992A and SN Ic 1983N. SN 1999fv is bluer than the low- spectra below 3700 Å. Our discovery image for this object does not reveal an obvious host galaxy, and it is unlikely that the blue color is due to host galaxy contamination as SN 1999fv was at least 1 to 1.5 mag brighter than the host. The SN Ib 1998dt and SN Ic 1994I spectra provide a worse match to SN 1999fv around 4000 Å than do the normal SNe Ia. While the spectrum of SN 1999fv has a limited rest-frame wavelength range, the presence of the Si II 4130 (“b”) feature is very important, as it results in a broad double-peak in the spectrum centered at 4000 Å that is not seen in SN Ib/Ic spectra (Clocchiatti et al., 2000), which show a small dip at this wavelength but lack a strong peak just redward at 4100 Å. Thus, even for 1 SNe with noisy spectra, it is possible to distinguish features that differentiate SNe Ia from Ib and Ic events near 4000 Å. The SN IIb 1993J spectrum has a double-peak centered near 4000 Å, but the widths of the features blueward of 4200 Å are significantly narrower than in the SN Ia spectra and the SN 1999fv spectrum.
In general, substantial contamination of the high- SNe Ia sample with SNe Ic, Ib, and II seems unlikely. First, typical SNe Ic, Ib, and IIb are much fainter than SNe Ia; on average, the -band peak brightness of SNe Ib and Ic is 1.5 mag lower, while SNe II are 1.8 mag lower (Miller & Branch 1990; Richmond et al. 1998). However, Clocchiatti et al. (2000) have found a very luminous SN Ic, and if such objects are common at high redshift they might contaminate the sample. Second, nearby SNe Ic, Ib, and IIb are rarer than SNe Ia, with a relative rate of 0.25 to 0.5 (Cappellaro et al., 1997, 1999), though the relative rates are likely to increase at high redshift. Additional photometric data (light-curve shapes) are useful in ruling out contamination from SNe Ic, Ib, IIb, and II. We do not believe that there is confusion with very luminous, peculiar SNe Ic, also known as “hypernovae,” in the high- sample, as their spectra are quite dissimilar from those of our high- objects (Iwamoto et al., 1998, 2000).
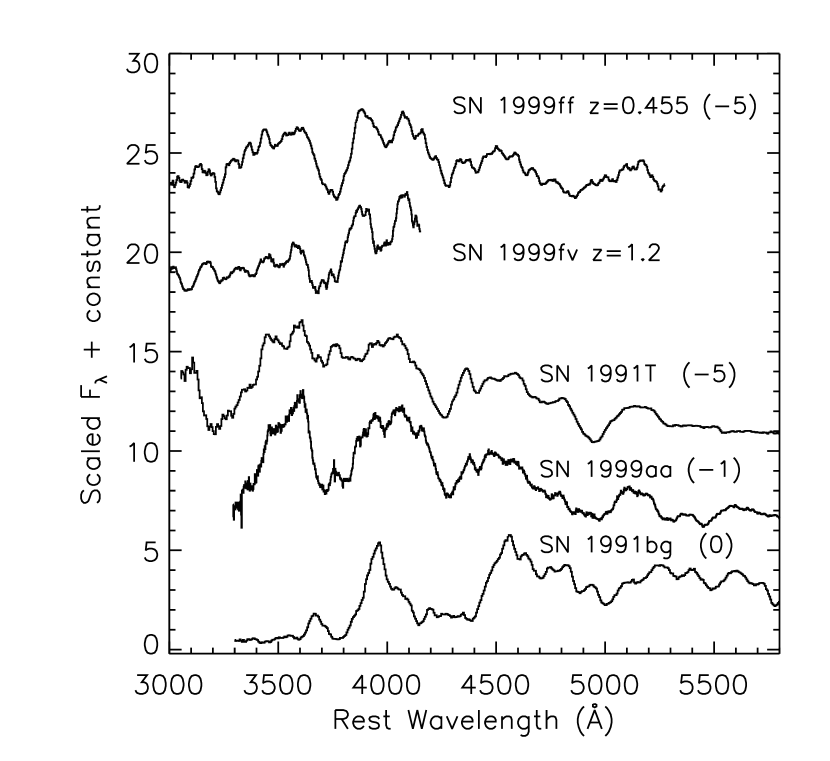
Although the analysis techniques of Hamuy et al. (1996) and Riess et al. (1998), in which light-curve shapes are used to derive luminosity corrections, can be applied to SNe Ia having a range of luminosities and light-curve shapes, it is of interest to determine whether the proportion of peculiar high- SNe Ia differs from that at low-. In Figure 2 we compare our spectra of SN 1999ff and 1999fv to the two archetypical, very peculiar SNe Ia: overluminous SN 1991T at –5 days (Filippenko et al., 1992a) and underluminous SN 1991bg at maximum (Filippenko et al., 1992b). Our two high- SNe Ia do not appear to be these kinds of peculiar events, as seen by the lack of correlation of their spectral features with those of SN 1991T and SN 1991bg. SN 1991T lacks Ca II H&K as well as Si II 4130, 5051, and exhibits strong Fe III lines that are not seen in SN 1999ff and SN 1999fv. SN 1991bg, on the other hand, shows prominent Ca II H&K absorption but lacks the usual Si II lines and has several Ti II features not seen in the high- spectra or in normal SNe Ia.
As a further comparison with peculiar SNe Ia, we show in Figure 2 a spectrum of SN 1999aa taken at –1 day. This object is similar to SN 1991T but also exhibits Ca II H&K absorption. Several recent low- SNe Ia of this nature have now been classified (Li et al., 2000, 2001). While our two high- SNe Ia are not peculiar in the sense of SN 1991T-like and SN 1991bg-like events, they do share some features with the spectrum of SN 1999aa. However, they agree best with the normal SNe Ia shown in Figure 1. We conclude that SN 1999ff is a relatively normal SN Ia, and we do not see any compelling evidence for SN 1999fv being a very peculiar SN Ia, though wider wavelength coverage and higher S/N ratios would permit a more definitive comparison. In addition, more UV SN Ia spectra are needed to better understand the nature of peculiar and normal SNe Ia at these wavelengths.
4 CONCLUSIONS
We present spectra of two high- SNe Ia discovered during our late-1999 High- SN Search campaign (Tonry et al., 1999). A 35 min. exposure of a SN at 0.5 yields a high-quality spectrum with detailed features from which a spectral age can be derived. A 130-min. exposure of a SN at 1.2 results in a moderate-quality spectrum with prominent, broad features. The redshift of SN 1999ff is 0.455, as given by stellar absorption lines in the host galaxy, and from spectral features we estimate the age to be –5 days. For SN 1999fv we use the spectrum to determine a redshift of 1.17–1.22. We find that the double-peak in the spectrum centered at 4000 Å and the strength of the Si II 4130 line can be used as a diagnostic for distinguishing SNe Ia from SNe Ib and Ic when the usual Si II 6355 feature is not available, as is often the case for high- SNe. However, moderate-quality spectra are needed to determine the SN type, especially for 1 SNe. We conclude that SN 1999ff is most consistent with normal SNe Ia, and that SN 1999fv is a SN Ia and is not peculiar in the sense of SN 1991T and SN 1991bg-like objects.
This research was supported by NSF grants AST-9417213 and AST-9987438 to A.V.F., by an NSF Graduate Research Fellowship to A.L.C., and by NASA grants GO-7505 and G0-8177 to the High-z SN Search Team from the Space Telescope Science Institute, which is operated by the Association of Universities for Research in Astronomy, Inc., under NASA contract NAS5-26555. The Keck Observatory is operated by the California Institute of Technology, The University of California, and NASA. We are grateful to the Keck staff for their assistance with the observations. We thank Ryan Chornock and Weidong Li for useful discussions and the referee for valuable comments.
References
- Branch et al. (1993) Branch, D., Fisher, A., & Nugent, P. 1993, AJ, 106, 6
- Branch et al. (1983) Branch, D., Lacy, C. H., McCall, M. L., Sutherland, P. G., Uomoto, A., Wheeler, J. C., & Wills, B. J. 1983, ApJ, 270, 123
- Cappellaro et al. (1999) Cappellaro, E., Evans, R., & Turatto, M. 1999, A&A, 351, 459
- Cappellaro et al. (1997) Cappellaro, E., Turatto, M., Tsvetkov, D. Yu., Bartunov, O. S., Pollas, C., Evans, R., & Hamuy, M. 1997, A&A, 322, 431
- Cappellaro, Turatto, & Fernley (1995) Cappellaro, E., Turatto, M., & Fernley, J. 1995, ESA-SP 1189
- Clocchiatti et al. (2000) Clocchiatti, A. et al. 2000, ApJ, 529, 661
- Filippenko (1997) Filippenko, A. V. 1997, ARA&A, 35, 309
- Filippenko, Matheson, & Ho (1993) Filippenko, A. V., Matheson, T., & Ho, L. C. 1993, ApJ, 415, L103
- Filippenko & Riess (2000) Filippenko, A. V., & Riess, A. G. 2000, Type Ia Supernovae: Observations and Theory, ed. J. Niemeyer and J. Truran (Cambridge: Cambridge Univ. Press), 1
- Filippenko et al. (1992a) Filippenko, A. V. et al. 1992a, ApJ, 384, L15
- Filippenko et al. (1992b) Filippenko, A. V. et al. 1992b, AJ, 104, 1543
- Filippenko et al. (1995) Filippenko, A. V. et al. 1995, ApJ, 450, L11
- Garnavich et al. (1998) Garnavich, P. et al. 1998, ApJ, 493, L53
- Hamuy et al. (1996) Hamuy, M., Phillips, M. M., Schommer, R. A., & Suntzeff, N. B. 1996, AJ, 112, 2391
- Iwamoto et al. (1998) Iwamoto, K. et al. 1998, Nature, 395, 672
- Iwamoto et al. (2000) Iwamoto, K. et al. 2000, ApJ, 534, 660
- Jeffery et al. (1992) Jeffery, D. J., Leibundgut, B., Kirshner, R. P., Benetti, S., Branch, D., & Sonneborn, G. 1992, ApJ, 397, 304
- Jha et al. (1998) Jha, S., Garnavich, P., Challis, P., Kirshner, R., & Calkins, M. 1998, IAU Circ. 7011
- Kirshner et al. (1993) Kirshner, R. P. et al. 1993, ApJ, 415, 589
- Li et al. (2000) Li, W., Filippenko, A. V., Treffers, R. R., Riess, A. G., Hu, J., & Qiu, Y. 2000, ApJ, in press (astro-ph/0006292)
- Li et al. (2001) Li, W. et al. 2001, in preparation
- Mazzali et al. (1993) Mazzali, P. A., Lucy, L. B., Danziger, I. J., Gouiffes, C., Cappellaro, E., & Turatto, M. 1993, A&A, 269, 423
- Miller & Branch (1990) Miller, D. L., & Branch, D. 1990, AJ, 100, 530
- Oke et al. (1995) Oke, J. B. et al. 1995, PASP, 107, 375
- Perlmutter et al. (1998) Perlmutter, S. et al. 1998, Nature, 391, 51
- Perlmutter et al. (1999) Perlmutter, S. et al. 1999, ApJ, 517, 565
- Press et al. (1992) Press, W. H., Teukolsky, S. A., Vetterling, W. T., & Flannery, B. P. 1992, Numerical Recipes, 2ed (Cambridge Univ. Press)
- Richmond et al. (1998) Richmond, M. W., Filippenko, A. V., & Galisky, J. 1998, PASP, 110, 553
- Riess et al. (1997) Riess, A. G. et al. 1997, AJ, 114, 722
- Riess et al. (1998) Riess, A. G. et al. 1998, AJ, 116, 1009
- Schmidt et al. (1998) Schmidt, B. P. et al. 1998, ApJ, 507, 46
- Tonry et al. (1999) Tonry, J. et al. 1999, IAU Circ. 7312
- Tonry et al. (2001) Tonry, J. et al. 2001, in preparation
- Wells et al. (1994) Wells, L. A. et al. 1994, AJ, 108, 2233