MACS: A quest for the most massive galaxy clusters in the universe
Abstract
We describe the design and current status of a new X-ray cluster survey aimed at the compilation of a statistically complete sample of very X-ray luminous (and thus, by inference, massive), distant clusters of galaxies. The primary goal of the MAssive Cluster Survey (MACS) is to increase the number of known massive clusters at from a handful to hundreds. Upon completion of the survey, the MACS cluster sample will greatly improve our ability to study quantitatively the physical and cosmological parameters driving cluster evolution at redshifts and luminosities poorly sampled by all existing surveys.
To achieve these goals we apply an X-ray flux and X-ray hardness-ratio cut to select distant cluster candidates from the ROSAT Bright Source Catalogue. Starting from a list of more than 5,000 X-ray sources within the survey area of 22,735 square degrees we use positional cross-correlations with public catalogues of Galactic and extragalactic objects, reference to Automated Plate Measuring Machine (APM) colours, visual inspection of Digitized Sky Survey images, extensive CCD imaging, and finally spectroscopic observations with the University of Hawaii’s 2.2m and the Keck 10m telescopes to compile the final cluster sample.
We discuss in detail the X-ray selection procedure and the resulting selection function, and present model predictions for the number of distant clusters expected to emerge from MACS. At the time of this writing the MACS cluster sample comprises 101 spectroscopically confirmed clusters at ; more than two thirds of these are new discoveries. Our preliminary sample is already 15 times larger than that of the EMSS in the same redshift and X-ray luminosity range.
1 Introduction
The evolution of clusters of galaxies over cosmological timescales is primarily driven by gravitational processes, such as the initial gravitational collapse of overdense regions in the primordial universe and their subsequent growth through accretion and cluster mergers. The formation rate of the final products of this process – relaxed, massive galaxy clusters – can be modeled straightforwardly for different world models (Press & Schechter 1976). The abundance of clusters as a function of redshift is thus an important diagnostic of cosmological parameters, primarily the normalized present-day matter density of the universe, , and the amplitude of fluctuations in that matter, (e.g. Oukbir & Blanchard 1997; Eke et al. 1998; Henry 2000).
Although cosmological studies can, in principle, be conducted with poor clusters, their slow evolution in all models of cluster formation means that very large, statistically well defined samples at very high redshift () are required to obtain significant constraints. In contrast, observations of the most massive systems, which are rarest and evolve fastest in all cosmologies, provide tight constraints already at moderate redshift. For instance, the predicted space density of galaxy clusters with intra-cluster gas temperatures of keV at is more than a factor of ten higher in a flat or open universe with than in a closed universe with ; at the difference approaches two orders of magnitude (Viana & Liddle 1996; Eke et al. 1996). For yet hotter (i.e., more massive) clusters the dependance of the formation rate on the chosen world model is even stronger.
As long as all systems are assumed to be virialized, only global cluster properties (total X-ray luminosity, global gas temperature, total mass) need to be known to constrain cosmological parameters. Virialization is, however, only one and often an intermittent state, preceded and, likely, interrupted by periods of growth through mergers, accretion, and internal relaxation. A statistically complete, large sample of massive, distant clusters would be invaluable to investigate in detail the physical mechanisms governing these evolutionary processes for the three main cluster components dark matter, gas, and galaxies. Such an investigation is, again, most feasible for massive clusters which are – scatter in the respective relations notwithstanding – likely to be also the most X-ray luminous and optically richest. They are therefore prime targets for studies of the density and temperature distribution of the intra-cluster gas as well as of the properties of the cluster galaxy population. Galaxy clusters also act as powerful gravitational lenses distorting the images of background galaxies behind the cluster, and create observable changes in the shape of the spectrum of the cosmic microwave background (CMB) radiation passing through them (Sunyaev-Zel‘dovich [SZ] effect). Lensing observations and detections of the SZ effect allow independent measurements of the distribution of dark matter and gas in clusters, and yet again the observed signal is strongest for massive clusters.
In the local universe () dozens of massive clusters have been known and studied in some detail for a long time. What we are still lacking, and what is crucial for evolutionary studies, is a sizeable sample of the high-redshift counterparts of these well-studied local systems. In this paper we argue that the required sample of massive, distant clusters is currently best compiled at X-ray wavelengths, we present an overview of previous X-ray cluster surveys, and show that the ROSAT All-Sky Survey can be used efficiently to compile this sample (Section 2). In Section 3 we introduce the MAssive Cluster Survey (MACS), describe its characteristics and selection function, and discuss predictions for the MACS sample size based on a no-evolution model. Finally, we present a status report which demonstrates the efficiency of our approach (Section 4).
We assume Mpc s km throughout. Unless explicitly stated otherwise, all X-ray fluxes and luminosities are quoted in the 0.1–2.4 keV band.
2 X-ray Cluster Surveys
The arguably least biased and most secure way of detecting massive, distant clusters is through wide-angle radio and sub-mm surveys optimised to detect the Sunyaev-Zel‘dovich (SZ) effect which is independent of cluster redshift. However, with suitable SZ surveys remaining infeasible for some time to come, the currently best way to compile statistically complete cluster samples is through the detection of X-ray emission from the hot intra-cluster gas. X-ray cluster surveys are unbiased in the sense that they exclusively select gravitationally bound objects and are essentially unaffected by projection effects (e.g., van Haarlem, Frenk & White 1997). If complete above a certain limiting X-ray flux, the resulting statistical cluster samples will have a well-defined selection function (a simple function of X-ray flux and, sometimes, X-ray extent) that immediately allows the computation of the effective survey volume for any real or hypothetical cluster. Finally, an X-ray cluster survey targeting only intrinsically X-ray luminous clusters has the additional advantage of focusing on systems that are the ones easiest to detect at any given redshift and for which the impact of contamination from unresolved X-ray point sources is lowest.
Several X-ray flux limited cluster samples have been compiled (and to different degrees published) in the past decade; an overview of the solid angles and flux limits of these surveys is presented in Fig. 1. Two kinds of surveys can be distinguished: serendipitous cluster surveys (Bright SHARC, Romer et al. 2000a; CfA 160 deg2 survey, Vikhlinin et al. 1998a; EMSS, Gioia et al. 1990a; RDCS, Rosati et al. 1998; SHARC-S, Burke et al. 1997; WARPS, Jones et al. 1998) and contiguous area surveys (BCS, Ebeling et al. 1998; BCS-E, Ebeling et al. 2000a; NEP, Henry et al. 2001; RASS-BS, DeGrandi et al. 1999; REFLEX, Guzzo et al. 1999). The former surveys use data from pointed X-ray observations, whereas the latter are all based on the ROSAT All-Sky Survey (RASS, Trümper et al. 1993). With the exception of the NEP survey, all contiguous cluster surveys cover close to, or more than, 10,000 square degrees but are limited to the X-ray brightest clusters. This fundamental difference in depth and sky coverage has important consequences. As shown in Fig. 1, the NEP survey as well as all serendipitous cluster surveys (with the possible exception of the EMSS) cover too small a solid angle to detect a significant number of X-ray luminous clusters (defined as clusters with erg s-1 in the 0.5–2.0 keV band or, equivalently, erg s-1 in the 0.1–2.4 keV band). All previous RASS large-area surveys, on the other hand, are capable of finding these rarest systems, but are too shallow to detect them in large numbers at .
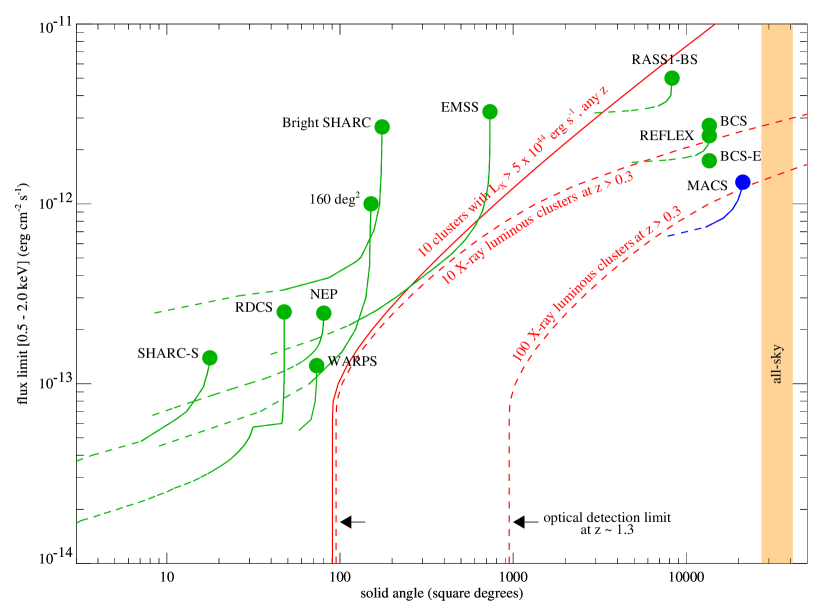
The observational situation summarized in Fig. 1 has led to the misconception that “RASS-based surveys do not have the sensitivity to detect clusters at ” (Romer et al. 2000b). As demonstrated by MACS (see the selection function shown in Fig. 1 and Section 3), the RASS provides unparalleled areal coverage and sufficient sensitivity to detect hundreds of X-ray luminous clusters at . Whether such systems actually exist in large numbers has, however, been the subject of much debate. Based on very small samples, or in fact non-detections, from serendipitous X-ray cluster surveys (the EMSS and CfA surveys) two groups have claimed to find strong negative evolution in the abundance of X-ray luminous clusters already at redshifts of (Henry et al. 1992, Vikhlinin et al. 1998b), in conflict with other studies (based on the EMSS and WARPS cluster samples) that find at best mild evolution at (Luppino & Gioia 1995; Ebeling et al. 2001). As we shall show in the following, the ROSAT All-Sky Survey holds the key to resolving this dispute which has profound implications for our understanding of cluster evolution.
3 The MAssive Cluster Survey (MACS)
MACS was designed to find the population of (possibly) strongly evolving clusters, i.e., the most X-ray luminous systems at . By doing so, MACS will re-measure the rate of evolution and test the results obtained by the EMSS and CfA cluster surveys. Unless negative evolution is very rapid indeed, MACS will find a sizeable number of these systems (see Section3.5) and thus provide us with targets for in-depth studies of the physical mechanisms driving cluster evolution and structure formation.
In this section we give the basic X-ray selection criteria used for MACS, derive the MACS selection function, and describe the procedure applied to convert detect fluxes to total cluster fluxes. We then describe the cluster identification procedure and finally present predictions for the number of clusters expected to emerge from MACS under the no-evolution assumption.
3.1 X-ray selection criteria
As indicated in Fig. 1, MACS aims to achieve the goals outlined above by combining the largest solid angle of any RASS cluster survey with the lowest possible X-ray flux limit. Our survey is based on the list of 18,811 X-ray sources contained in the RASS Bright Source Catalogue (RASS-BSC, Voges et al. 1999) which has a limiting minimal count rate of 0.05 ct s-1 within the detect cell and in the 0.1–2.4 keV band. Drawing from this list MACS applies the following X-ray selection criteria:
-
•
, to ensure observability from Mauna Kea; the resulting geometric solid angle is 22,735 deg2; 11,112 RASS-BSC sources fall within this region
-
•
X-ray hardness ratio HR greater than HR as derived from the ROSAT Brightest Cluster Sample (Ebeling et al. 1998) with the additional constraint that ; HR is defined as where and are the PSPC countrates in the soft (PHA channels 11 to 41) and hard bands (PHA channels 52 to 201), respectively; 6,750 X-ray sources remain
-
•
erg cm-2 s-1 where is the detect cell flux (see Section 3.3) in the 0.1–2.4 keV band; 5,654 RASS-BSC sources remain
-
•
detected net count limit of 17 photons (see Section 3.2); 5504 sources remain
The conversion from net count rate to X-ray flux is performed using Xspec assuming a standard Raymond-Smith plasma spectrum, a metallicity of 0.3, and a gas temperature of 8 keV; we use the Galactic value from Dickey & Lockman (1990) in the direction of each cluster to account for absorption. The assumed X-ray temperature of 8 keV is obtained from the - relation of White, Jones & Forman (1997) for an X-ray luminosity of erg s-1 (0.1–2.4 keV), typical of MACS clusters (see Section 3.3).
We stress that we do not use the X-ray extent provided in the RASS-BSC as a selection criterion. As shown by Ebeling and co-workers (1998, appendix A) for the BCS () this parameter is too unreliable to be used efficiently for the selection of cluster candidates, to the extent that at least 25% of all real clusters would be missed at any given flux limit (see also Section 4).
3.2 X-ray selection function
To compute the X-ray selection function, i.e., the effective solid angle of the MACS survey as a function of X-ray flux, we need to know the cluster detection efficiency and the depth of the RASS across our study region. The detection algorithm used for the compilation of the RASS-BSC is optimized for the detection of point sources and is known to be relatively insensitive to low-surface brightness emission (Ebeling et al. 1998). While this is a serious problem for the completeness of RASS-based cluster samples at low redshift, it does not affect MACS which, by design, targets only distant clusters. At , the limiting redshift of our survey, the canonical value of the cluster core radius of 250 kpc corresponds to an angular size of 45 arcsec, comparable to the FWHM of the RASS point-spread function (PSF, Böse 2000). Therefore the detection efficiency of distant clusters in the RASS will not differ markedly from that of point sources of similar X-ray flux. Hence, we can derive the effective detection limit using all RASS-BSC sources.
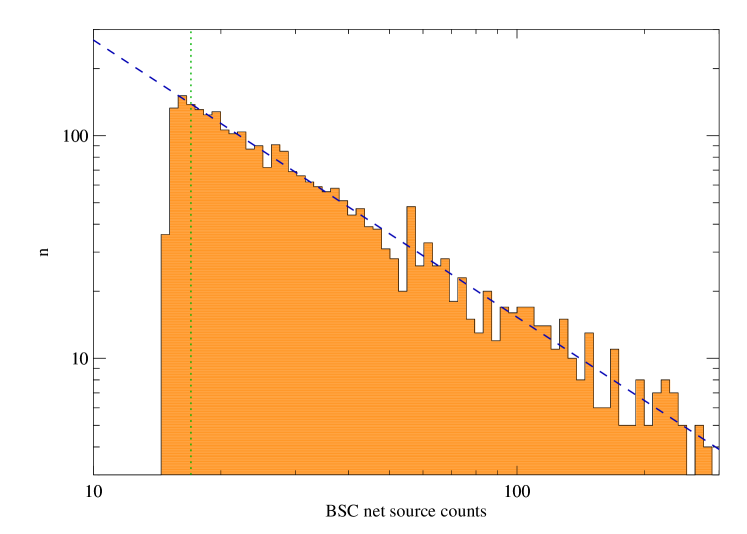
In Fig. 2 we show the histogram of the detected net counts of all RASS-BSC X-ray sources with exposure times between 200 and 300 seconds. The upper exposure time limit of 300s was chosen to eliminate artificial distortions at the low-count end of the histogram due to the presence of lower limits in the RASS-BSC in both count rate and net counts of 0.05 ct s-1 and 15 photons, respectively. An additional, lower limit of 200s in exposure time was applied to create a relatively narrow range of exposure times, thus ensuring that a complete sample can be described by a single power law111We stress that these exposure time cuts are applied only here to establish the net count limit of completeness for the RASS-BSC; they are not applied to the X-ray source list MACS is compiled from.. Figure 2 shows that, although the RASS-BSC contains sources with as few as 15 counts (as stated in Voges et al. 1999), the catalogue is not complete to this limit. Based on a comparison with the best-fitting power law we adopt instead a value of 17 net counts as the completeness limit.
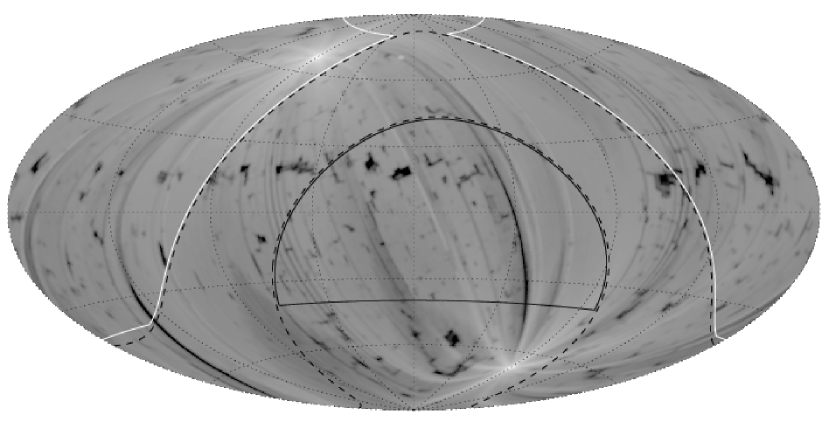
Combining the net count limit of 17 photons with the RASS exposure map (Fig. 3) yields the count rate selection function, i.e., the fractional MACS survey area for which the RASS-BSC could be complete at a given count rate. In practice, the count rate cut at 0.05 ct s-1 imposed on the RASS-BSC source list truncates this function as shown in Fig. 4. Conversion from count rate to X-ray flux as detailed in Section 3.1 transforms the count rate selection function into the desired X-ray flux selection function. As shown in Fig. 5, and as expected from the soft energy passband of the ROSAT PSPC, the selection function is not sensitive to variations in the assumed X-ray temperature from 6 to 10 keV.
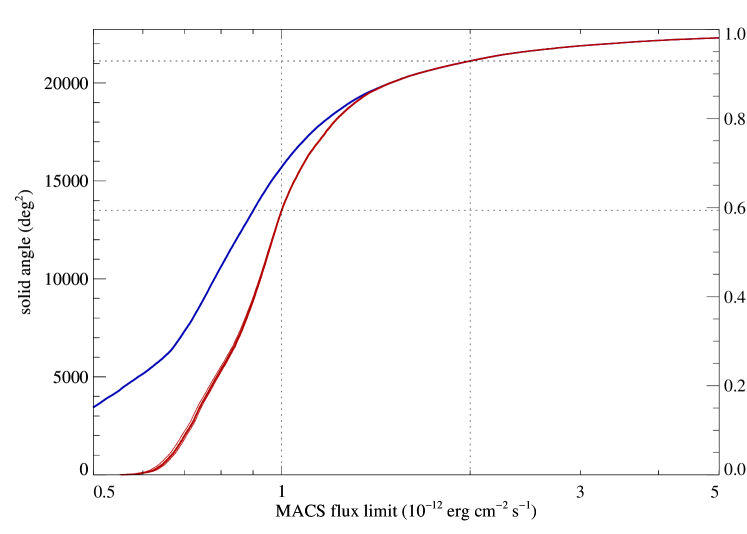
Based on the MACS selection function we divide the X-ray source list compiled by applying the criteria listed in Section 3.1 into an X-ray bright subset ( erg cm-2 s-1) and an X-ray faint extension ( erg cm-2 s-1). The bright subsample is complete over 93% of the geometric solid angle of our survey; when combined with the faint extension the effective search area decreases to 59% of the maximal survey area of 22,735 deg2.

3.3 Flux corrections
The X-ray fluxes derived from the RASS-BSC count rates as detailed above are detect fluxes, i.e., they correspond to the emission detected by the RASS-BSC detection algorithm within a specific circular aperture. The radius of this detect cell aperture depends on the apparent X-ray extent of the source and ranges from 5 arcmin (the default value) to a maximal value of 16.5 arcmin.
To convert detect fluxes into total cluster fluxes we assume that the intrinsic X-ray surface brightness profile follows a beta model, (Cavaliere & Fusco-Femiano 1976), with and core radius kpc. We then convolve this spatial emission model with the RASS PSF (Böse 2000) and compute the fraction of the observable emission that falls within a set of circular apertures of 5, 6, 7.5, 10, and 15 arcmin radius. The resulting range of flux correction factors is shown in Fig. 6. Within the MACS redshift range the flux correction factor is not a strong function of redshift; it does depend, however, strongly on the size of the extraction aperture and, at least for the smaller apertures, on the assumed value of . While the extraction radius is known for each cluster, the core radius is not. Next to the Poisson error of the number of directly detected photons, the variation of the correction factor with core radius is the second largest contributor to the uncertainty in the total X-ray fluxes and luminosities of MACS clusters.
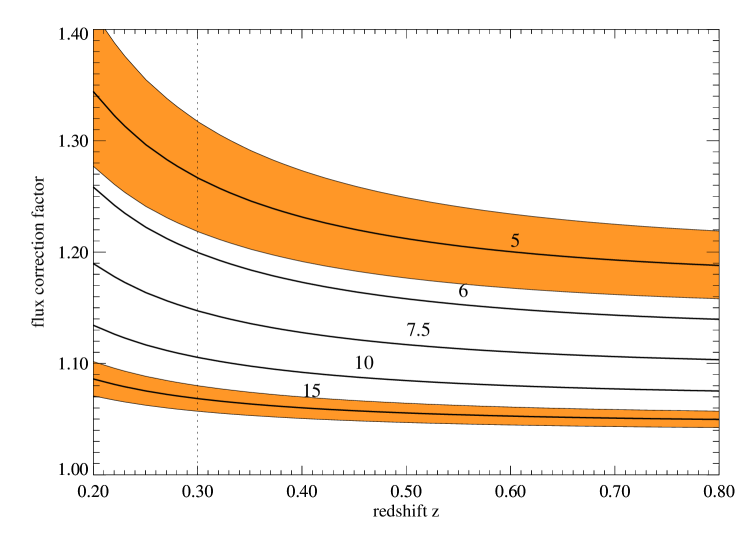
While the extraction radius associated with detections of nearby clusters () is often greater than the default value (25% of the nearby clusters feature values greater than five arcmin), large extraction radii become rare as the angular extent of the cluster emission decreases with increasing cluster redshift. At , the MACS redshift range, the nominal aperture size of five arcmin radius is used for more than 97% of all clusters. Using the flux correction factor for this default extraction radius and assuming kpc we derive limiting (minimal) total cluster luminosities of 4.7 and erg s-1 for the faint and bright MACS subsamples at ; at the two subsamples contain only clusters with luminosities in excess of 8.1 and erg s-1, respectively.
3.4 Cluster identification
The cluster identification procedure adopted for MACS involves five steps:
-
1.
Cross-correlation of the list of 5504 RASS-BSC sources with all objects in the SIMBAD and NED databases. Possible counterparts of an X-ray source are extracted within a search radius of 1 arcmin (stars, galaxies, active galactic nuclei [AGN], QSOs) or 3 arcmin (supernova remnant [SNRs], galaxy clusters). These search radii are consistent with the uncertainty of the RASS-BSC source positions of 1 arcmin (98% limit of error distribution) for point sources and 2 arcmin (98% limit) for extended sources, and account for an additional uncertainty of about 1 arcmin in the positions of catalogued supernova remnants and clusters of galaxies.
-
2.
Visual inspection of Digitized Sky Survey (DSS) images (second generation where available). The size of these images is arcmin2 corresponding to at least Mpc2 within the redshift range of our survey ().
-
3.
Search for extremely blue () or red () counterparts in the APM (Automated Plate Measuring machine; Irwin, Maddox & McMahon 1994) object catalogue to tentatively identify stars, AGN, and BLLac objects. Only objects within 25” of the RASS-BSC X-ray position are considered. The quoted colour and angular separation thresholds correspond to 95% confidence limits for identifications with these types of objects obtained from cross-correlations of the APM catalogue with known AGN and stars.
-
4.
CCD imaging in the R (bright source list) or I band (faint source list) of all X-ray sources without (or with ambiguous) identifications as well as of all possibly distant () cluster candidates with the University of Hawaii’s 2.2m telescope. At exposure times of min in R and min in I these imaging observations are deep enough to unambiguously detect rich clusters out to 222 The WARPS team discovered the rich clusters ClJ0152.71357 (, Ebeling et al. 2000b) and ClJ1226.9+3332 (, Ebeling et al. 2001) in the first of three 4 min I band exposures taken with the same instrumentation at the UH2.2m telescope as is used by us for MACS. The mentioned two WARPS clusters constitute a complete sample at this redshift.
-
5.
Spectroscopic observations with the UH2.2m and Keck 10m telescopes of all confirmed clusters with estimated redshifts of .
For an RASS-BSC source to be flagged as a non-cluster before CCD images are obtained, the cross-correlation with Galactic and extragalactic object catalogues has to yield an unambiguous non-cluster identification that is supported by the appearance of the field in the DSS finders, as well as by the APM colour (where available) of the counterpart. Typical examples of such obvious identifications are bright stars and nearby galaxies (with and without nuclear activity). We stress that DSS finders are obtained and examined for all RASS-BSC sources meeting the initial X-ray selection criteria (Section 3.1), and that we do proceed to CCD imaging in spite of the presence of a listed non-cluster counterpart if, for instance, a catalogued QSO is not clearly visible in the DSS image or if, in addition to the QSO, an overdensity of faint objects is apparent in our finders.
Unless a RASS-BSC source has been firmly identified as a non-cluster, or as a cluster at (where can be a measured or estimated redshift), CCD images of the source over a arcmin2 field-of-view are obtained with the University of Hawaii’s 2.2m telescope. Since MACS clusters, in contrast to the majority of the systems detected in serendipitous cluster surveys, are by design and without exception very X-ray luminous (Section 3.3) they are usually also optically rich and thus obvious even in shallow CCD images. All distant clusters () confirmed by imaging observations are subsequently targeted in spectroscopic observations where we obtain redshifts of at least two cluster members, one of them the apparent brightest cluster member.
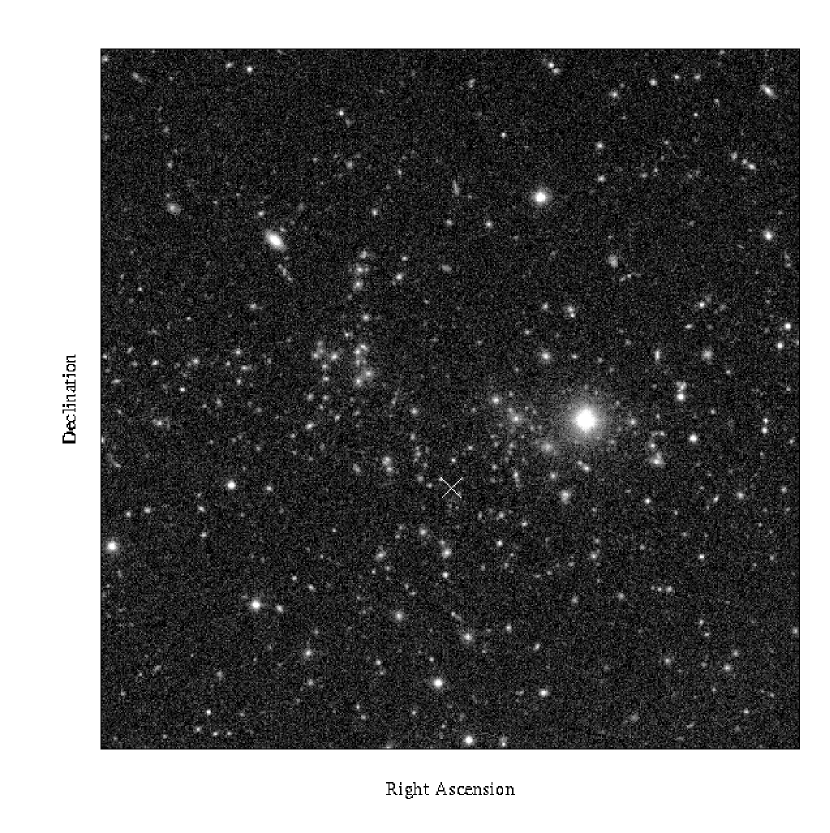
A systematic effect that is difficult to quantify is the impact of X-ray contamination on our sample. We cannot rule out that we may have included a small number of clusters at that are significantly contaminated by X-ray point sources and would fall below our flux limit if the non-diffuse emission were subtracted. We attempt to identify possibly contaminated clusters by obtaining deeper ( min) optical images in each of three passbands (V, R, I) of all MACS clusters with spectroscopic redshifts of . Fig. 7 shows such a colour image (of a newly discovered MACS cluster at ) and illustrates how the optical richness of MACS clusters allows an unambiguous identification already from relatively shallow CCD images. A (by MACS standards) low optical richness of a system in these colour images is one possible indicator of contamination, as is the presence of unusually red or blue objects close to the X-ray position. In future follow-up work we shall attempt to obtain spectra of potential contaminants identified in this manner. However, ultimately we will be not be able to quantify the level of X-ray contamination until deeper pointed X-ray observations of all MACS clusters have been performed.
While we believe to have taken all feasible precautions against missing distant clusters, the above procedure (or any other) can never be failsafe. Albeit unlikely, a distant cluster might be obscured by a bright star which we accepted as the X-ray counterpart. Alternatively, a very distant cluster which is not visible on the DSS finder can be missed if an acceptable optical counterpart to the X-ray source is present in the foreground (catalogued AGN or QSO at lower redshift). While, in both of these examples, the eventually accepted identification is likely to contribute to the observed X-ray emission, we can not rigorously rule out that we have missed a small number of distant clusters above our X-ray flux limit. As for all cluster surveys, the size of the cluster sample emerging from MACS, as well as all volume-normalized quantities derived from it, should thus be considered to represent lower limits.
3.5 No-evolution prediction
A prediction for the size of the final MACS sample under the no-evolution assumption can be obtained by folding the local cluster X-ray luminosity function (XLF) as measured from the ROSAT Brightest Cluster Sample (Ebeling et al. 1997) through the MACS selection function shown in Fig. 5. In this process, we use our usual assumptions to convert from X-ray luminosity to flux and from total cluster flux to detect cell flux (see Sections 3.1 and 3.3) and integrate the cluster XLF out to .
The resulting model prediction is shown in Fig. 8. Although the uncertainties introduced by the errors in the Schechter function parameterization of the local XLF () are considerable, it is safe to say that about 300 clusters are expected to emerge from MACS if there is no evolution in the cluster XLF out to . Only at would the number of MACS clusters approach or fall below about ten, thus entering the Poisson regime.
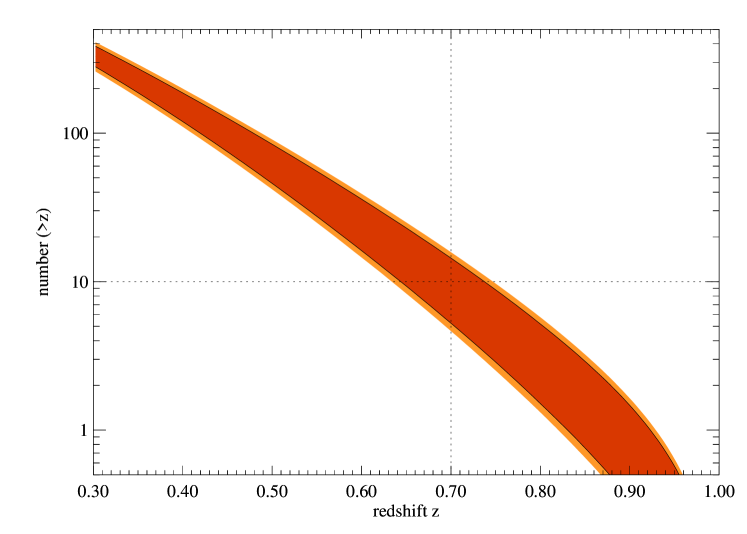
These numbers are sufficiently high for us to be confident that MACS will produce not only the largest sample of massive, distant clusters compiled to date (a relative statement), but also a sizeable one in absolute terms, even in the presence of strong negative evolution.
4 MACS: Status as of December 2000
As part of the procedure described in detail in Section 3.4 we have, so far, obtained 349 CCD images of MACS cluster candidates and measured redshifts for 131 clusters confirmed by the imaging observations. As of December 2000, we have identified more than 850 clusters of galaxies at all redshifts; Fig. 9 shows the redshift distribution of the 787 systems with spectroscopic redshifts. As a by-product, MACS has thus already delivered by far the largest X-ray selected cluster catalogue to emerge from the RASS to date.
The redshift distribution shown in Fig. 9 is skewed toward high redshifts because our spectroscopic follow-up observations target exclusively systems with . Up to December 2000 101 clusters were found to have ; a further 37 clusters confirmed in imaging observations and with still await spectroscopic confirmation. Of the 101 clusters in the preliminary MACS sample only 29 were previously known. These 29 hail from a wide variety of projects, including the optically selected GHO sample (Gunn, Hoessel & Oke 1986), the Abell catalogue (Abell, Corwin & Olowin 1989) and the X-ray selected EMSS333The less than a handful EMSS clusters rediscovered by MACS constitute the largest statistically complete previous cluster sample in this redshift and X-ray luminosity range. (Gioia & Luppino 1994) and BCS (Ebeling et al. 1998, 2000) cluster samples.
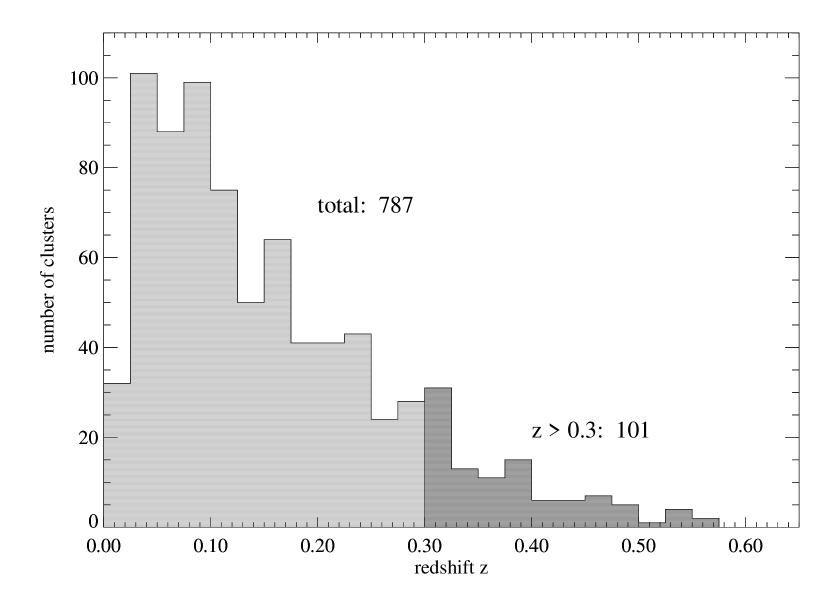
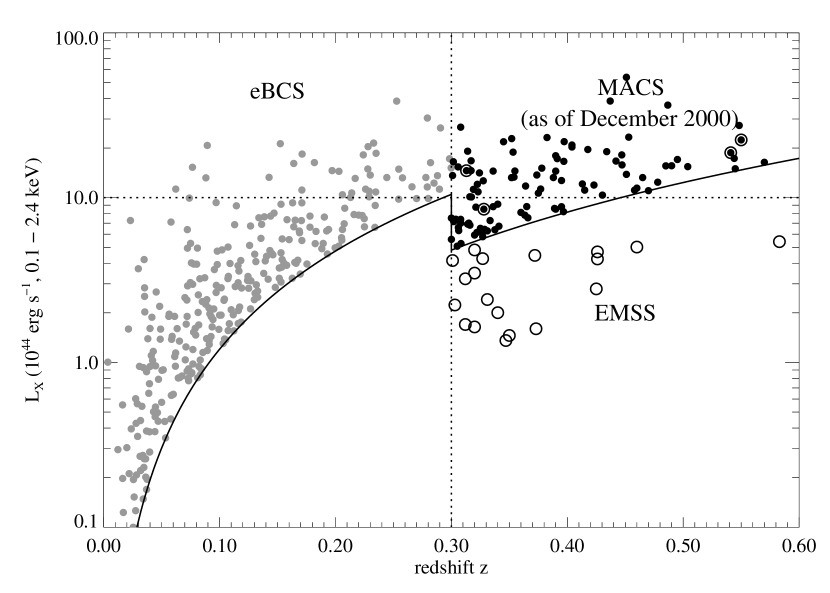
Figure 10 shows the X-ray luminosity–redshift distribution of our preliminary sample at , compared to the one for the BCS at , and the one for the EMSS at . Note how MACS extends the redshift baseline for studies of the most X-ray luminous clusters ( erg s-1) from to , and how MACS clusters are, in general, much more X-ray luminous than EMSS clusters. In fact only six EMSS clusters come close to the X-ray luminosities sampled by MACS at ; four of these are rediscovered by us (MS2137.32353, MS1358.4+6245, MS0451.60305, and MS0015.9+1609), the other two (MS0353.63642 and MS1008.11224) lie just below our flux limit. MACS thus contains already more than 15 times more clusters in this cosmologically most important region of the - plane than the EMSS, providing us for the first time with a sizeable and statistically robust sample for studies of the properties of the high-redshift counterparts of the most massive local clusters.
We emphasize again that the completeness of this sample, compiled from RASS data, hinges critically upon our ignoring the RASS-BSC extent parameter. As shown in Fig. 11 34% of all MACS clusters at are classified as X-ray point sources by the RASS-BSC detection algorithm. Based on a comparison of the extent values assigned by the RASS-BSC algorithm to detections of Abell clusters and to a control set of random RASS sources, Ebeling and coworkers (1993) find that extent values below 35 arcsec are in general spurious. If this threshold value had been adopted for MACS, our survey would have missed more than half of the 101 clusters in our preliminary sample.

5 Summary
We describe the design and status of the MAssive Cluster Survey (MACS), the first X-ray cluster survey aimed at the compilation of a large, statistically complete sample of exclusively X-ray luminous ( erg s-1, 0.1–2.4 keV), distant () clusters. The systems targeted by our survey are the rarest, most massive clusters whose evolution places the tightest constraints on the physical and cosmological parameters of structure formation on cluster scales.
Based on the ROSAT Bright Source Catalogue of RASS detections, MACS uses the spectral hardness of the X-ray emission and the X-ray flux in the detect aperture to select 5504 X-ray sources in a search area of 22,735 deg2. A comprehensive identification programme has so far led to the discovery of more than 800 clusters at all redshifts; imaging and spectroscopic follow-up observations have confirmed 101 clusters at . MACS has thus already more than tripled the number of massive, distant clusters known; compared to the EMSS sample our current preliminary sample represents an improvement in size of a factor of 15 in the MACS redshift and luminosity range.
Under the no-evolution assumption, MACS is expected to uncover up to, and perhaps more than, 300 clusters at . However, if evolution is strong and negative, the total sample could comprise as few as as 100 clusters. In any case MACS will increase greatly the number of distant, massive clusters known and, hopefully, lead to similarly impressive improvements in our understanding of the properties and evolution of these most massive collapsed entities in the universe.
References
- (1) Abell G.O., Corwin H.G. Jr., Olowin R.P. 1989, ApJS, 701, 1
- (2) Böse, F.G.H. 2000, A&A Suppl., 141, 507
- (3) Burke, D.J., Collins, C.A., Sharples, R.M., Romer, A.K., Holden, B.P., Nichol, R.C. 1997 ApJ, 488, L83
- (4) Cavaliere, A. & Fusco-Femiano, R. 1976, A&A, 49, 137
- (5) De Grandi, S. et al., 1999, ApJ, 514, 148
- (6) Dickey, J.M. & Lockman, F.J. 1990, Ann. Rev. Astron. Astroph., 28, 215
- (7) Ebeling, H., Voges, W., Böhringer, H., Edge, A.C. 1993, A&A, 275, 360
- (8) Ebeling, H., Edge, A.C., Fabian, A.C., Allen, S.W., Crawford, C.S., Böhringer, H. 1997, ApJ, 479, L101
- (9) Ebeling, H., Edge, A.C., Böhringer, H., Allen, S.W., Crawford, C.S., Fabian, A.C., Voges, W., Huchra, J.P. 1998, MNRAS, 301, 881
- (10) Ebeling, H., Edge, A.C., Allen, S.W., Crawford, C.S., Fabian, A.C., Huchra, J.P. 2000, MNRAS, 318, 333
- (11) Ebeling, H., Edge, A.C., Allen, S.W., Crawford, C.S., Fabian, A.C., Huchra, J.P. 2000a, MNRAS, 318, 333
- (12) Ebeling, H. et al. 2000b, ApJ, 534, 133
- (13) Ebeling, H. et al. 2001, ApJL, accepted
- (14) Eke, V.R., Cole, S., Frenk, C.S. 1996, MNRAS, 282, 263
- (15) Eke, V.R., Cole, S., Frenk, C.S., Henry, J.P., 1998, MNRAS, 298, 114
- (16) Gioia I.M. & Luppino G.A. 1994, ApJS, 94, 583
- (17) Gioia, I.M., Maccacaro, T., Schild, R.E., Wolter, A., Stocke, J.T., Morris, S.L., Henry, J.P. 1990, ApJS, 72, 567
- (18) Gunn J.E., Hoessel J.G., Oke J.B. 1986, ApJ, 306, 30
- (19) Guzzo, L. et al. 1999, Msngr, 95, 27
- (20) Henry, J.P., Gioia, I.M., Maccacaro, T., Morris, S.L., Stocke, J.T., Wolter, A. 1992, ApJ, 386, 408
- (21) Henry, J.P. 2000, ApJ, 534, 565
- (22) Henry, J.P., Gioia, I.M., Mullis C.R., Voges, W., Briel, U.G., Böhringer, H., Huchra, J.P. 2001, ApJ, accepted
- (23) van Haarlem, M.P., Frenk, C.S. & White, S.D.M. 1997, MNRAS, 287, 817
- (24) Irwin, M., Maddox, S., McMahon, R. 1994, Spectrum, 2, 14
- (25) Jones, L.R., Scharf, C., Ebeling, H., Perlman, E., Wegner, G., Malkan, M., Horner, D. 1998, ApJ, 495, 100
- (26) Luppino, G.A. & Gioia, I.M. 1995, ApJ, 445, L77
- (27) Oukbir, J. & Blanchard, A. 1997, A&A, 317, 10
- (28) Press, W.H. & Schechter, P. 1974, ApJ, 187, 425
- (29) Romer, A.K. et al. 2000a, ApJS, 126, 209
- (30) Romer, A.K., Viana, P.T.P., Liddle, A.R., Mann, R.G. 2000b, ApJ, accepted, astro-ph/9911499v2
- (31) Rosati, P., Della Ceca, R., Norman, C., Giacconi, R. 1998, ApJ, 492, L21
- (32) Trümper, J., 1993, Science, 260, 1769
- (33) Viana, P.T.P. & Liddle, A.R. 1996, MNRAS, 281, 323
- (34) Vikhlinin, A., McNamara, B.R., Forman, W., Jones, C., Quintana, H., Hornstrup, A., 1998a, ApJ, 498, L21
- (35) Vikhlinin, A., McNamara, B.R., Forman, W., Jones, C., Quintana, H., Hornstrup, A., 1998b, ApJ, 502, 558
- (36) Voges, W. et al. 1999, A&AS, 349, 389
- (37) White, D.A., Jones, C. & Forman, W. 1997, MNRAS, 292, 419