kopts@astro.ioffe.rssi.ru, shib@stella.ioffe.rssi.ru 22institutetext: The Pennsylvania State University, Dept. of Astronomy & Astrophysics, 525 Davey Lab, University Park, PA 16802, USA
pavlov@astro.psu.edu 33institutetext: Special Astrophysical Observatory of RAS, Karachai-Cherkessia, Nizhnij Arkhyz, 357147, Russia
sokolov@sao.ru 44institutetext: Observatorio Astronomico Nacional de Instituto de Astronomia de UNAM, Ensenada, B.C., 22860, Mexico
zhar@astrosen.unam.mx 55institutetext: Astro Space Center of the Russian Academy of Sciences, Moscow, 117810, Russia
vkurt@asc.rssi.ru
Optical photometry of the PSR B0656+14
and its neighborhood
Abstract
We present the results of the broad-band photometry of the nearby middle-aged radio pulsar PSR B0656+14 and its neighborhood obtained with the 6-meter telescope of the SAO RAS and with the Hubble Space Telescope. The broad-band spectral flux of the pulsar decreases with increasing frequency in the near-IR range and increases with frequency in the near-UV range. The increase towards UV can be naturally interpreted as the Rayleigh-Jeans tail of the soft thermal component of the X-ray spectrum emitted from the surface of the cooling neutron star. Continuation of the power-law component, which dominates in the high-energy tail of the X-ray spectrum, to the IR-optical-UV frequencies is consistent with the observed fluxes. This suggests that the non-thermal pulsar radiation may be of the same origin in a broad frequency range from IR to hard X-rays. We also studied 4 objects detected in the pulsar’s 5″ neighborhood.
Key Words.:
stars: neutron – pulsars: individual: PSR B0656+14, Geminga1 Introduction
The radio pulsar PSR B0656+14 was discovered by Manchester et al. (1978). Its basic parameters are presented in Table 1. This pulsar has been detected in X-rays, at –10 keV, with the space observatories Einstein (Córdova et al. (1989)), ROSAT (Finley et al. (1992); Anderson et al. (1993)), EUVE (Finley et al. (1994); Foster et al. (1996)), and ASCA (Greiveldinger et al. (1996); Zavlin et al. (2000)). Together with Geminga, PSR B105552, and, perhaps, the Vela pulsar, it belongs to a group of middle-aged pulsars with thermal-like soft X-ray spectra (Becker & Trümper (1997), and references therein). The X-ray radiation of PSR B0656+14 can be described as a combination of radiation from the entire surface of a cooling neutron star (NS) and radiation from hotter regions, presumably polar caps heated by relativistic particles produced in the pulsar magnetosphere. An excess over the hot thermal component at energies above keV was interpreted as nonthermal radiation from pulsar’s magnetosphere (Greiveldinger et al. (1996)). The pulsar has also been marginally detected in gamma-rays ( MeV), at a 3 level (Ramanamurthy et al. (1996)).
The optical counterpart of PSR B0656+14 was detected by Caraveo et al. (1994) with the ESO 3.6-meter and NTT telescopes in the V band (V). It was observed in the long-pass filter F130LP ( = 2310–4530 Å) with the Faint Object Camera (FOC) aboard the Hubble Space Telescope (HST) by Pavlov et al. (1996; hereafter P (96)), who showed that the bulk of radiation in this band is of a nonthermal origin. Pavlov et al. (1997; hereafter P (97)) measured the pulsar’s fluxes in narrower FOC bands, F430W, F342W and F195W, and estimated thermal and nonthermal contributions to the optical-UV flux. Mignani et al. (1997) measured the flux in the F555W filter of the HST Wide Field Planetary Camera (WFPC2). Coherent optical pulsations with the radio pulsar period have been detected in the B-band by Shearer et al. (1997). Kurt et al. (1998; hereafter K (98)) presented first results of the ground-based BVRI photometry of the pulsar with the 6-meter Big Alt-azimuth Telescope (BTA) of the Special Astrophysical Observatory of the Russian Academy of Sciences (SAO RAS).
| Observed | Derived | ||||||||||
|---|---|---|---|---|---|---|---|---|---|---|---|
| ms | cm-3 pc | deg | deg | mas yr-1 | mas yr-1 | Myr | G | erg | kpc | ||
| 384.87 | 5.50 | 14.0 | 201.1 | 8.3 | 0.11 | 0.2–0.8 | |||||
| aPulsar proper motion (Mignani et al. (2000)). | |
|---|---|
| bEstimates obtained from interpretations of X-ray data give –0.5 kpc; the dispersion-measure distance is kpc. |
The optical-UV data obtained in the above-described observations have shown that the pulsar’s optical flux exceeds the Rayleigh-Jeans extrapolation of the thermal spectrum seen in soft X-rays. P (97) fit the observed optical-UV fluxes with a two-component model, a sum of the power-law and Rayleigh-Jeans spectra. The slope of the nonthermal component , although poorly constrained in these fits, looks steeper than that in X-rays. The thermal component is characterized by the Rayleigh-Jeans parameter, –6, where is the brightness temperature in K, km the apparent NS radius, and pc the distance. To tighten the constraints on the parameters of the thermal and nonthermal components, the fluxes should be measured in a broader wavelength range.
The pulsar field has been recently observed with the HST Near Infrared Camera and Multi-Object Spectrometer (NICMOS) in three broad bands, F110W, F160W, and F187W (Harlow et al. 1998). The pulsar was detected in all the three bands, but the near-IR fluxes appeared to be significantly lower than the extrapolation of the BVRI fluxes measured by K (98).
K (98) also detected four unresolved, faint () optical objects within from the pulsar counterpart. Because of low spatial resolution of the ground-based observations, it was impossible to determine whether they are just background objects (point-like or extended) or some structures associated with the pulsar.
In this paper we report the results of new optical observations of PSR B0656+14 and the objects in its nearest neighborhood taken with BTA. We incorporate the available HST NICMOS, WFPC2, and FOC observations111Observations with the NASA/ESA Hubble Space Telescope were obtained at the Space Telescope Science Institute, which is operated by the Association of Universities for Research in Astronomy, Incorporated, under NASA contract NAS5-26555., analyze them together with the new and old BTA data, and obtain new estimates of the pulsar magnitudes in the BVRI and near-IR bands. We also discuss the morphology, color spectra and possible nature of the objects in the pulsar vicinity.
The observations and data reduction are described in Sect. 2. Multicolor photometry of the pulsar and the objects in its vicinity is presented in Sect. 3. The broad-band spectra and the nature of the objects are discussed in Sect. 4.
Band Date Seeing Sky Sky s UT deg arcsec DN s-1 pix-1 mag arcsec-2 B 11.11.96a 2400 - 34.30 1.7 2.47 21.96 V 11.11.96a 2400 - 33.76 1.5 6.43 21.20 R 11.11.96a 3000 - 33.82 1.5 18.17 20.44 26.11.97 500 00:49 31.82 1.6 20.91 20.30 500 01:11 33.92 1.6 21.70 20.25 Sume 4000 - 33.59 1.6 18.96 20.40 I 11.11.96a 3300 - 33.65 1.4 29.93 19.04 26.11.97 600 22:37 33.56 1.5 29.32 19.07 600 22:49 32.42 1.5 28.68 19.09 600 00:37 30.90 1.6 30.46 19.03 Sume 5100 - 33.14 1.5 29.77 19.05
a Summed data sets d Zenith distance of 1996 (K (98)) e Summed R and I exposures b Exposure duration of 1996 and 1997 c Starting UT of the exposure
2 Observations and data analysis
2.1 BTA observations
We include in our analysis the data obtained in two BTA observations – of 1996, November 11/12 (described by K (98)) and 1997, November 26/27. Both observations were carried out with a CCD photometer, with a pixel size of . The response curves of the filters used are close to those of the B, V, Rc, and Ic filters of the Johnson-Cousins system (referred to as BVRI hereafter). Other technical details can be found in K (98).
The 1997 observations were performed with the R and I filters only. Because of poor seeing and high sky background, we had to exclude from consideration seven of ten images taken with the I filter and three of five images obtained with the R filter. Observational conditions for the accepted exposures are presented in Table 2.
We reduced the data using the ESO MIDAS and STScI IRAF software. We summed the new R and I images with the corresponding images taken on November 1996. This decreases the statistical errors of flux measurements in comparison with the previous measurements based on 1996 data alone.
The instrumental stellar magnitudes for each filter (B,V,R,I) are
| (1) |
where is the flux in counts (DN) for a given aperture, is the correction for finite aperture derived from the point spread function (PSF) of bright stars, is the extinction factor, for which we used average values of the BTA observatory: , 0.21, 0.15, and 0.10 for the B, V, R, and I filters, respectively (Neizvestny (1983)). The signal-to-noise ratios and the magnitude uncertainties were calculated as
| (2) |
| (3) |
where is the standard deviation of flux in counts, is the number of pixels in the source aperture, is the gain, and is the number of pixels used for background measurement. The instrumental magnitudes were then transformed to the Johnson-Cousins magnitudes using the equations
| (4) |
where the transformation coefficients were determined with the aid of secondary photometric standards described by K (98). The absolute fluxes (in erg cm-2 s-1 Hz-1) were calculated using the following equation
| (5) |
with the zero-points provided by Fukugita et al. (1995):
| (6) |
2.2 HST data
We also studied the PSR B0656+14 field using the HST data obtained by Mignani et al. (1997) in the WFPC2 F555W band and by Harlow et al. (1998) in the NICMOS F110W, F160W and F187W bands. The standard reduction scheme described in the HST Data Handbook was applied to the WFPC2 images processed by pipeline. The data were processed with the STScI IRAF software, summed with the IRAF task crrej, and a 116″ 116″ mosaic image containing three WFC and one PC field, corrected for the HST geometric distortion, was constructed. We applied the photometric formulae similar to Eqs. (1) and (3), with allowance for the WFPC2 cooldown and decontamination corrections. The correction for the finite aperture was performed with the aid of the PSF image gb71613du from the WFPC2 PSF Library.
For the primary reduction of the NICMOS data, we used the standard
procedure
calnica222We made use of the calibration files
i7l12297n, h421621an, h4214599n,
i7l1653gn,
h2413242n, h241323pn, h241323qn, icb15080n, icb1507pn,
and icb1507qn, and the dark calibration file created by Brian Monroe
(NICMOS Helpdesk at STScI)..
For rejection of anomalously “cold” pixels, we applied the
IRAF task cosmicrays to inverted images.
To remove the pedestal effect333See
http://www.stsci.edu/instruments/nicmos/anom_pedestal.html
and to subtract the background,
the IRAF task pedsky444See
STAN (Space Telescope Analysis Newsletter) No. 18.
www.stsci.edu/instruments/nicmos/NICMOS_stans/stan_018.asci
was implemented,
with the same reference flatfield.
It significantly suppressed the pedestal level,
but increased the background level
near the edges of the images,
which is not critical for our purposes since the objects of interest
are near the image centers.
To combine the individual dither images
and get rid of cosmic rays, we
made use of the package ditherII by Fruchter et al. (1998)
and followed the recipe
described in the example supplied with the package
release555http://www.stsci.edu/fruchter/dither/ditherII.ps.
The shifts of single images were calculated
making use of three bright stars in the field.
The PSF images were generated by the TinyTim
code666http://www.stsci.edu/software/tinytim.
Aperture sizes were chosen to maximize the signal-to-noise ratio.
To estimate the flux errors for the sources observed with the HST, we neglected possible systematic uncertainties which are smaller than statistical errors for faint objects, including the pulsar. Conversion of the fluxes to the Vega system magnitudes for the HST bands were performed using Eq. (5) and the following zero-points, calculated by the pipeline:
| (7) |
2.3 Astrometry
For astrometrical referencing of the BTA images, we used the mosaic WFPC2/F555W image which covers a fraction of the BTA field. The coordinates of five relatively bright stars in this overlapping region were determined in the WFPC2 and BTA images. Then, a six-parameter coordinate transformation was constructed. The uncertainties of the transformation are equal to for the R,I images and 015 ( 0.5 pixel) for the B,V images. This allows us to relate the BTA and HST images with accuracy better than the BTA pixel size.
3 Multicolor photometry of PSR B0656+14 and objects in its neighborhood
3.1 Morphology of PSR B0656+14 field in different bands
14″14″ fragments of the smoothed BTA BVRI images777These and other images are available in FITS format at http://www.ioffe.rssi.ru/astro/NSG/obs/0656-phot.html containing the pulsar are presented in Fig. 1. In Figs. 2 and 3 we show a smoothed 116116 fragment of the HST/WFPC2 image and non-smoothed 10″10″ fragments of the HST/NICMOS images, respectively. All the images are oriented as indicated in Fig. 2. The contour plots of the images in Figs. 1, 2 and 3 are smoothed over the areas of 33, 77, and 55 pixels for the BTA, WFPC2, and NICMOS images, respectively. The isophotes correspond to the following levels (in counts) above the background:
| (8) |
where is the mean sky value near the pulsar, ; is the sky standard deviation related to one pixel; is the scaling factor. We used = 1.25, 2 and 3, = 10, 10 and 18, for the BTA, WFPC2 and NICMOS contour plots, respectively. All the images confirm the detection by K (98) of five faint objects, o1–o5 (marked in Figs. 1 and 2), within ″ around the pulsar position.
| Band | Sourceb | Mage | Flux | ||||
|---|---|---|---|---|---|---|---|
| pix | DN s-1 | mag | Jy | ||||
| B+ | 10 | 3 | 0.839(80) | 0.41 | 2.44 | 24.98(13) | 0.409(36) |
| V+ | 9.0 | 3 | 1.26(14) | 0.25 | 2.07 | 24.97(12) | 0.369(39) |
| R+ | 16 | 3 | 2.77(17) | 0.18 | 2.15 | 24.48(7) | 0.488(32) |
| I+ | 10 | 3 | 2.26(22) | 0.12 | 2.05 | 23.87(11) | 0.675(65) |
| B× | 8.1 | 3 | 0.661(81) | 0.41 | 2.44 | 25.25(13) | 0.319(36) |
| V× | 9.2 | 3 | 1.25(14) | 0.25 | 2.07 | 24.97(12) | 0.369(39) |
| R× | 11 | 3 | 2.24(19) | 0.18 | 2.15 | 24.71(9) | 0.394(31) |
| I× | 9.5 | 3 | 2.02(21) | 0.12 | 2.05 | 23.99(11) | 0.604(58) |
| F555W | 23 | 4 | 0.0853(38) | - | 1.12 | 24.90(7) | 0.393(24) |
| F110W | 11 | 2 | 0.119(11) | - | 1.55 | 24.38(10) | 0.336(30) |
| F160W | 14 | 3 | 0.185(13) | - | 1.50 | 23.22(8) | 0.575(41) |
| F187W | 8.0 | 3 | 0.127(16) | - | 1.65 | 22.62(13) | 0.779(97) |
| + | Aperture centered at the position determined by the center/gauss fit in the BTA images |
|---|---|
| × | Aperture centered at the positions determined from the WFPC2 image, (see ‘+’ and ‘’ marks in Fig. 1) |
| a | Aperture radius in pixels |
| b | Source count rate within the aperture |
| c | Correction for atmospheric extinction |
| d | Factor to correct for the finite aperture |
| e | Johnson-Cousins and Vega magnitudes, for the BTA and HST images, respectively |
Because of worse seeing during the BTA observations, we cannot determine from the BTA images whether the faint objects are point-like or extended, except for o2 which is clearly extended and looks as associated with the pulsar. With the aid of the WFPC2 and NICMOS images, we infer that the pulsar counterpart o1 (, , as determined from the NICMOS images888This and other absolute positions in the HST images are given as directly measured with the IRAF imcntr task, without correcting for possible HST pointing errors.) and the stellar object o5 (96, = 14∘14′219; west of the pulsar) have point-like source profiles, whereas o2, o3, and o4 are extended.
The extended sources are most clearly resolved in the NICMOS/F160W band. The object o2 shows a compact bright nucleus at 16, = 14∘14′232 (185 north of the pulsar). The nucleus is surrounded by a faint elongated nebula which occupies an area of . The minimum distance between the nebula’s southern edge and the pulsar, 11 in the F160W band, is smaller than the BTA seeing. This explains naturally the apparent association of the pulsar and o2 in the R and I bands. In the F555W band, whose response curve is very close to that of the Johnson’s V filter, o2 looks like a faint elongated clump without a pronounced nucleus. Also, o2 is barely seen as a very faint extended source in the FOC/F130LP image obtained by P (96).
The extended object o3 (23, = 14∘14′251) is 4″ north of the pulsar. It has an irregular structure with a bright knot at its eastern edge. Being at only 1″ from the northern edge of o2, the object o3 appears to be associated with o2 in the F160W image. The structure of the object o4 (84, = 14∘14′220; 5″ west of the pulsar) varies strongly from band to band.
3.2 Consistency of the BTA and HST data
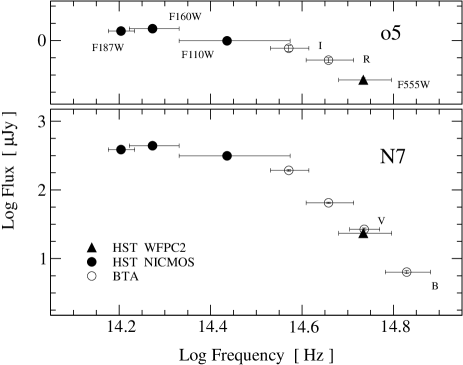
To check consistency of our data reduction and photometry of the objects observed with the different telescopes and detectors, we measured the magnitudes of a relatively bright star (marked N7 in Fig. 2, following the notation by K (98)) seen in all the BTA and HST images. The raw broad-band spectrum of this star (Fig. 4 and Table 4) looks rather smooth and shows no jumps between the BTA and HST bands. Moreover, the fluxes in the almost equivalent V and F555W bands are in good agreement with each other. This indicates that there are no major inconsistencies between the reduced BTA and HST data. The colors and magnitudes of N7 correspond to an M5V star (Bessel (1990)) at a distance of 440 pc.
3.3 Flux measurements
| Object | B | V | F555W | R | I | F110W | F160W | F187W | ||||||||||||||||
|---|---|---|---|---|---|---|---|---|---|---|---|---|---|---|---|---|---|---|---|---|---|---|---|---|
| o2 |
|
|
|
|
|
|
|
|
||||||||||||||||
| o3 |
|
|
|
|
|
|
|
|
||||||||||||||||
| o4 |
|
|
|
|
|
|
|
|
||||||||||||||||
| o5 | - | - |
|
|
|
|
|
|
||||||||||||||||
| N7 |
|
|
|
|
|
|
|
|
The objects of interest are faint and strongly blurred in the BTA images, especially in the R and I filters. This leads to additional uncertainties of their center positions and fluxes. To evaluate the uncertainties, we determined the positions (and the corresponding fluxes) of the unresolved objects using two approaches. First, we applied the center/gauss task of the MIDAS package to our BTA images. These positions are marked by the ‘+’ signs at the contour plots in Fig. 1. (The center of o5 cannot be determined by this method in the B and V images because o5 is hidden in the background.) Second, we measured the positions of o1 (PSR), o5 and o3 in the WFPC2 image and transformed them to the BTA positions as described in the Sect. 2.3. These positions are marked by the ‘’ signs (o4 cannot be centered in this way because it is resolved in the WFPC2 image.) We see from Fig. 1 that the ‘+’ positions of the point sources (o1 and o5) are systematically closer, by 1–2 BTA pixels, to the nearest extended objects (o2 and o4, respectively) than the ‘’ positions. This means that the fluxes of the faint, point-like sources may be contaminated by the nearby extended objects, and the Gaussian fits of their profiles may not be reliable.
We measured the stellar magnitudes and fluxes of point-like objects for a range of aperture radii . For each of these objects in the BTA images, we chose pixels as an optimal value and measured the background over the annulus with inner and outer radii and pixels, centered at the source. To measure the fluxes in the HST images, we used the task phot from the IRAF package apphot. For the NICMOS images (pixel size is 0075), we chose pixels (except for the pulsar in F110W – see Table 3), and , pixels (, pixels for N7). We used , , pixels for the WFPC2 image (pixel size is 0045). The results are presented in Tables 3 and 4.
We see from Table 3 that the B, R and I fluxes of the pulsar, measured with the apertures centered on the ‘’ positions are systematically lower, by 10–30%, than those obtained with the ‘+’ positions. In the V band both fluxes coincide with each other and are consistent with the F555W flux, within the errors. Similar differences between the ‘’ and ‘+’ fluxes are found for o3 if it is considered as a point-like source. Furthermore, the ‘’ fluxes yield a smooth broad-band spectrum of o5 (see Table 4 and Fig. 4) while its ‘+’ flux in the I band stands out of the smooth spectrum by , an excess hardly plausible for an ordinary object. Based on these measurements, we believe that the ‘’ fluxes of the point-like sources are more realistic than the ‘+’ fluxes, and even the ‘’ fluxes are likely overestimated because of contamination from nearby extended sources.
We also estimated integral fluxes of the extended sources in different bands. For consistency, the fluxes were measured with the same circular aperture for all the objects and bands; its diameter, 164, was chosen in accordance with the BTA seeing conditions in the I band. To measure the fluxes of o2, we centered the aperture at the center of its nucleus in the F160W image (this position was transformed into the BTA and WFPC2 images using the pulsar and o5 as reference objects). Although this aperture does not include the whole o2 nebula, the contribution of the outer parts of the nebula to the integral flux is only a few percents, smaller than the errors of our measurements. To estimate the BTA BVRI fluxes, we corrected the measured fluxes for the finite aperture as if o2 were a point-like object. Such corrections are negligible for the HST images. The same approach was used for o3 and o4. For these objects, the contributions into the measured integral fluxes from the nearby objects o2 and o5 are not significant.
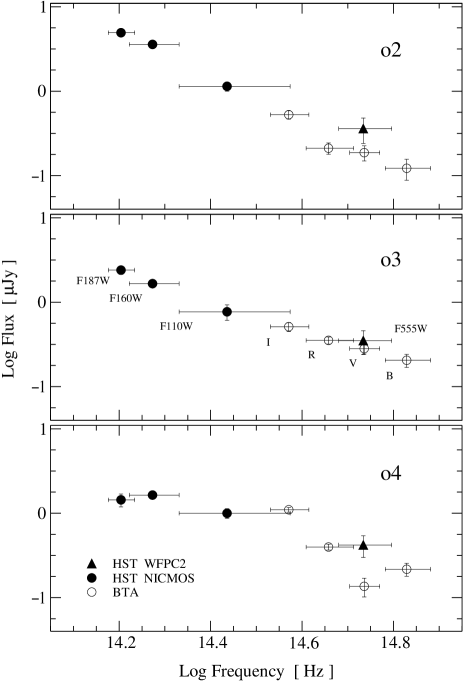
The magnitudes and the raw broad-band spectra of the extended objects are presented in Table 4 and Fig. 5. For o2 and o3, the spectra are similar and can be crudely approximated by a power law, , with and , respectively. The spectrum of o4 appears to be more complicated. However, the estimated fluxes of this object are less definite because of its clumpy morphology and rather low ( 1.5–2), particularly in the B, V and F555W bands.
3.4 Contamination of the pulsar flux by the object o2 in the R and I bands
We see from Tables 3 and 4 that the ‘’ fluxes of the pulsar in the R and I bands are comparable with the corresponding fluxes of o2 whereas the ‘+’ fluxes are higher in both filters. The reason is that the ‘+’ positions are shifted towards o2 by 04, so that the ‘+’ fluxes are stronger contaminated. Therefore, we consider the ‘’ fluxes more reliable.
If o2 had a point-like profile, its contribution in the pulsar’s aperture would be negligible, about 3% in the I band and even less than that in the R band. If o2 had the same surface brightness at the pulsar position as the brightness measured over the rectangular aperture of 4.6 arcsec2 (see Fig. 2), its contribution to the flux measured in the pulsar’s aperture would be 847% and 966% in the R and I bands, respectively. Since o2 is not a point-like object, and it is spatially separated from the pulsar, the obtained estimates can be considered only as lower and upper limits on the contamination.
An intermediate, more realistic estimate can be obtained based on the fact that the brightness distribution of o2 in the F160W image is almost symmetrical with respect to its major and minor axes. We assumed the same source symmetry in the I and R bands, and measured the I and R fluxes in the aperture with the radius of 082 (3 pixels) centered at the point marked by the ‘’ sign in Fig. 2, correcting the fluxes for the finite PSF as if there were a point source. No excess over the background level was detected at this position in the R image. In the I image we detected Jy, i.e., 2710% of the pulsar flux , which can be considered as an estimate for the contamination. This value is comparable with the 3 uncertainty of the flux measured in the pulsar’s aperture as well as with the difference between the and fluxes (see Table 3). Notice, however, that some contribution to the flux at the ‘’ position can also be provided by o3, so that the real contamination from o2 may be somewhat lower than estimated above. Moreover, the assumption on symmetry of o2 in the I band should be taken with caution because, according to Fig. 1, the brightness distribution of o2 (and, perhaps, of o3) in this filter appears to be different from those in the other bands.
The exposure in the B band was too short to estimate the contamination. Since Jy is comparable to , we can expect that the pulsar’s B flux can also be contaminated by o2. Although this object is not seen in the adjacent F430W filter and in the other HST UV bands, its southern fragment is seen in the much wider F130LP filter whose band-pass strongly overlaps with that of the B filter.
Given the large uncertainty of the contamination, it is very difficult to obtain accurate values of the B, R and, particularly, I fluxes. Since the fluxes, measured by K (98), are obviously overestimated, we can choose either or as most probable values. Since , and is difficult to measure, we choose and as “best-guess values”. As for the I flux, we present both the and values in Table 5, where we collected all optical data for the PSR B0656+14. Only observations with spatial resolution better than 1″ can improve the accuracy of the flux measurements in the BRI bands.
4 Discussion
4.1 Spectrum of PSR B0656+14
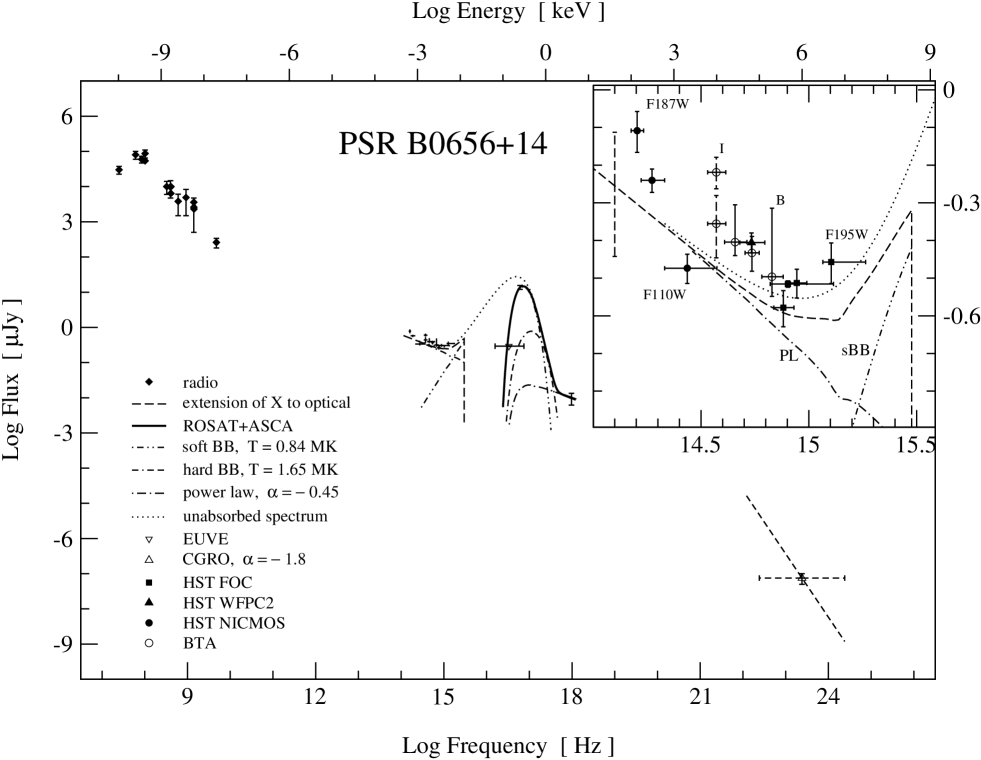
In Fig. 6 we combined our optical data with the available multiwavelength data on PSR B0656+14 (Malofeev (1999); P (96); P (97); Korpela & Bowyer (1998); Ramanamurthy et al. (1996); Zavlin et al. (2000)). The spectrum generally fades towards higher frequencies, showing a hump of thermal radiation in soft X-rays.
In X-rays, the EUVE, ROSAT and ASCA data fit well with a three-component spectral model (Zavlin et al. (2000)). The model consists of a soft blackbody component describing thermal emission from the entire NS surface with a radius km and temperature K, a hard blackbody component representing thermal emission from pulsar hot polar caps with K and km, and a power-law non-thermal component, presumably formed in the NS magnetosphere, phot cm-2 s-1 keV-1, where is photon energy in keV, and . The radii and are related to the pulsar distance pc; column density of the interstellar matter towards the pulsar is cm-2. The sum of the three components is displayed with the bold line in Fig. 6; the unabsorbed spectrum is shown with the dotted line; the dashed line represents an absorbed extension of this three-component model to the optical domain; the dot-dashed lines represent contributions of different components of the fit. The soft thermal component from the entire surface of the cooling NS dominates in soft X-rays and in the EUVE band. The non-thermal component is responsible for the high energy tail in X-rays. It is also apparently detected in -rays, but its slope is highly uncertain and likely different from that in X-rays.
The IR-optical-UV range is blown up in the inset of Fig. 6. It is seen that the observed broad-band spectrum is consistent, within the uncertainties, with the continuation of the X-ray fit to the optical range. A typical uncertainty of the extrapolated flux is indicated by the dashed error-bar on the left side of the inset. The power-law component becomes dominating in the optical-IR range. This suggests that a single mechanism of non-thermal radiation may operate in a broad frequency range from IR to hard X-rays. The slope of the non-thermal component is less steep than it was deduced by K (98) and P (97) based on the previous optical-UV data. The overall optical spectrum has a shallow minimum at Hz ( Å). Above this crossover frequency, the Rayleigh-Jeans part, , of the soft thermal component apparently dominates in the pulsar spectrum (P (97)).
From the new BTA and NICMOS data we cannot exclude nonmonotonous behavior of the broad-band IR-optical spectrum, which might indicate the presence of unresolved spectral features. There are an apparent excess in B (K (98); P (97)), an increase towards RI, and a dip in F110W, accompanied by a steep increase towards the IR frequencies. The BRI excesses could be partially due to contamination of the pulsar flux by the nearby extended object o2. In the R and B filters they could be caused by Hα and Hβ emission from an unresolved pulsar-wind nebula (PWN) around the pulsar (e.g., Cordes (1996)). For typical ISM temperatures and densities, the pulsar’s velocity, km s-1 is supersonic, so that the PWN would be a bow shock at a stand-off distance pc, where is the baryon number density of the ambient medium, . For instance, such a shock, with an Hα flux photons cm-2 s-1, was observed at ( pc for erg s-1) from the millisecond pulsar J0437–4715 (Bell et al. (1995)). Since , where is the fraction of neutral hydrogen atoms, the expected Hα flux from a bow shock at – from PSR B0656+14 can be estimated by simple scaling: photons cm-2 s-1, for km s-1, pc, pc. This corresponds to an R-band energy flux Jy from the whole Hα emitting region. The contribution of this flux in the observed R flux would be very substantial at . However, PSR B0656+14 is much younger than J0437–4715, and its hot NS creates an ionization zone of a radius –0.5 pc (–) around the pulsar (e.g., Shvartsman (1970)). Since at () is expected to be orders of magnitude smaller than , the contribution of the bow-shock Hα emission in should be negligible. The estimated angular size of the ionization zone is much larger than our apertures, its emission is hidden in background and cannot contribute to the measured point source flux.
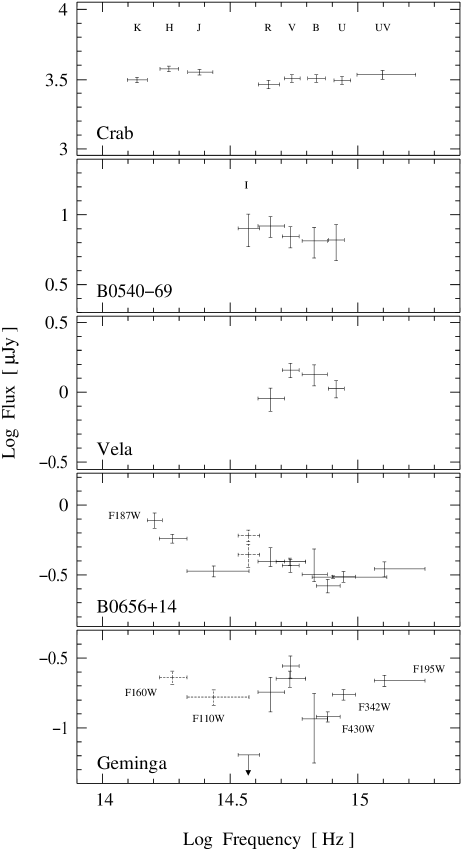
A similar excess, albeit in the V band, is also present in the broad-band spectrum of the other well-studied middle-aged pulsar Geminga. Its possible explanations have been suggested by Bignami et al. (1996) and Martin et al. (1998) based on various combinations of the synchrotron or ion cyclotron emission/absorption in an upper atmosphere or low magnetosphere of the NS. In Fig. 7 we plot the optical-UV fluxes (from Mignani et al. (1998)) of Geminga together with our estimates of the NICMOS F110W and F160W fluxes detected by Harlow et al. (1998). We also show the available dereddened color spectra of the Crab pulsar (Percival et al. (1993); Eikenberry et al. (1997)), PSR B054069 (Middleditch et al. (1987)), the Vela pulsar (Nasuti et al. (1997)), and PSR B0656+14 (see Table 5). We neglected the extinction for PSR B0656+14 and Geminga, which gives rather small corrections for these nearby pulsars. It is seen that the broad-band spectra of PSR B0656+14 and Geminga are qualitatively similar to each other. This suggests that the unresolved spectral features associated with the apparent optical excesses in their spectra could be of the same nature. On the other hand, the spectra of the middle-aged pulsars appear to be different from the flat and featureless spectra of the young Crab and B054069 pulsars, which is evidence of evolution of optical emission with pulsar age. To confirm the difference and reveal its nature, spectroscopic observations of the middle-aged pulsars are needed.
| Band | Flux | Referencesb | |||||
|---|---|---|---|---|---|---|---|
| Jy | data / measured by | ||||||
| B | 25.25 | 0.32 | tw | ||||
| V | 24.97(12) | 0.369(39) | tw | ||||
| R | 24.72 | 0.39 | tw | ||||
| Ic |
|
|
tw | ||||
| F555W | 24.90(07) | 0.393(24) | M97a / tw | ||||
| F110W | 24.38(10) | 0.336(30) | H98 / tw | ||||
| F160W | 23.22(08) | 0.575(41) | H98 / tw | ||||
| F187W | 22.63(13) | 0.779(97) | H98 / tw | ||||
| F430W | - | 0.264(29) | P (97) | ||||
| F342W | - | 0.307(27) | P (97) | ||||
| F195W | - | 0.349(43) | P (97) | ||||
| F130LP | - | 0.305(06) | P (96) |
4.2 Nearby objects
Object o5. Faintness of the stellar object o5 suggests that it might be a main sequence star located near the edge of our galaxy. Taking into account the total interstellar galactic extinction towards the pulsar field (, ; , , , , , , – see Schlegel et al., (1998)), we obtain the dereddened color indices of o5: and . This would be compatible with a K6V main sequence star (Bessel (1990)). However, typical absolute magnitude of the K6V stars are = 82–85. This yields a distance range of 20–23 kpc, incompatible with the Galaxy size. Therefore, it is more likely that o5 is a white dwarf with K and , at a distance of pc. However, in the absence of spectral information one cannot rule out also that this is a quasar.
Extended objects.
There were unsuccessful attempts to search for a PWN around
PSR B0656+14 on scales ″ in radio (Frail & Scharringhausen (1997)) and X-rays (Becker et al. (1999)).
However, an expected PWN size,
,
where is the pressure of the ambient medium, can be smaller
than , and, in principle, the object o2 might be a PWN candidate.
The morphology of o2 looks like that of a faint
spiral galaxy seen edge-on.
However, its size, 3″ 07,
is larger than the mean size,
1″ 05,
of galaxies of close magnitudes,
, in the South
Hubble Deep Field NICMOS catalog999See
nicmos_v1generic.cat, presented at
http://www.stsci.edu/ftp/science/hdfsouth/hdfs.html.
taken with the exposure 4992 s close to
the pulsar field exposure 5098 s in the F160W band.
The broad-band spectrum of o2
is close to a power law with a photon index of about .
If it were a nebula powered by relativistic particles ejected
by the pulsar,
its observed flux could be provided by synchrotron radiation
from a region with approximately the same parameters
as those estimated by Hester et al. (1995)
for the optical structures (wisps, knots)
in the synchrotron nebula around the much more energetic Crab pulsar
(e.g., from a volume cm3
with a magnetic field G
and a steep power-law distribution
of relativistic electrons with a slope ,
number density cm-3,
and minimum Lorentz factor ).
However, the morphology of o2 looks very unnatural for a PWN,
particularly with account of the pulsar’s proper motion (see Fig. 2),
the slope of the power-law spectrum is too steep compared with
other known synchrotron sources,
and PSR B0656+14 can hardly supply relativistic particles at a rate needed
to support the amount required.
Thus, we conclude that o2 is most likely a faint background galaxy,
as are the other extended objects o3 and o4.
Deep subarcsecond optical, radio and X-ray observations of the PSR B0656+14 field are needed to search for possible unresolved structures associated with activity of PSR B0656+14. In this respect, it would be useful to confirm and investigate a knot-like structure seen at a level above the background at 004 from the pulsar position in the FOC/F342W image101010We are grateful to R. Mignani who checked this independently..
Acknowledgements.
Partial support for this work was provided by grant 1.2.6.4 of Program ”Astronomia”, by INTAS (grant 96–0542), RFBR (grant 99-02-18099), and by NASA through grant number GO-07836-01-96A from the Space Telescope Science Institute, which is operated by the Association of Universities for Research in Astronomy, Incorporated, under NASA contract NAS5-26555. We are grateful to Roberto Mignani for the HST/WFPC2 data, to Jason Harlow, Richard Hook, Andrew Fruchter, Brian Monroe (NICMOS Helpdesk), and Lindsey Davis (IRAF Helpdesk) for the assistance, to Victorija Komarova for careful reading.References
- Anderson et al. (1993) Anderson, S.B., Córdova, F.A., Pavlov, G.G., Robinson, C.R., & Thompson, R.J., 1993, ApJ, 414, 867
- Becker et al. (1999) Becker, W., Kawai, N., Brinkmann, W., & Mignani, R., 1999, A&A, 352, 532
- Becker & Trümper (1997) Becker, W. & Trümper, J. 1997, A&A, 326, 682
- Bell et al. (1995) Bell, J.F., Bailes, M., Manchester, R.N., Weisberg, J.M., Lyne, A.G., 1995, ApJ, 440, L81
- Bessel (1990) Bessel, M.S., 1990, PASP, 102, 1181
- Bignami et al. (1996) Bignami, G.F., Caraveo, P.A., Mignani, R., Edelstein, J., & Bowyer, S. 1996, ApJ, 456, L111
- Caraveo et al. (1994) Caraveo, P.A., Bignami, G.F., & Mereghetti, S., 1994, ApJ, 422, L87
- Cordes (1996) Cordes, J., 1996, in Pulsars: Problems & Progress, ASP Conf Series, 105, 393
- Córdova et al. (1989) Córdova, F.A., Middleditch, J., Hjellming, R.M. & Mason, K.O., 1989, ApJ, 345, 451
- Eikenberry et al. (1997) Eikenberry, S.S., Fazio, G.G., Ransom, S.M., Middleditch, J., Kristian, J., & Pennypacker, C.R., 1997, ApJ, 477, 465
- Finley et al. (1994) Finley, J.P., Ögelman, H., & Edelstein, J., 1994, BAAS, 26, 870
- Finley et al. (1992) Finley J P, Ögelman H, Kiziloğlu, Ü., 1992 ApJ, 394, L21
- Foster et al. (1996) Foster, R.S., Edelstein, J., & Bowyer, S., 1996, in Astrophysics in Extreme Ultraviolet, Proc. IAU Coll, # 152, eds. S. Bowyer and R.F. Malina (Kluwer: Dordrecht), p. 437
- Frail & Scharringhausen (1997) Frail, D.A. & Scharringhausen, B.R., 1997, ApJ, 480, 364
- Fruchter et al. (1998) Fruchter, A.S., Hook, R.N., Busko, I.C., & Mutchler, M., 1998, in 1997 HST Calibration Workshop, eds. S. Casertano, R. Jedrzejewsky, T. Keyes, and M. Stevens (STScI)
- Fukugita et al. (1995) Fukugita, M., Shimasaku, K., & Ichikawa, T., 1995, PASP, 107, 945
- Greiveldinger et al. (1996) Greiveldinger, C., Camerini, U., Fry, W., Markwardt, C.B., Ögelman, H., Safi-Harb, S., Finley, J. P., Tsuruta, S., Shibata, S.,Sugawara, T., Sano, S. & Tukahara, M., 1996, ApJ, 465, L35
- Harlow et al. (1998) Harlow J.J.B., Pavlov G.G., & Halpern J.R., 1998, AAS Meeting 193, #41.07
- Hester et al., (1995) Hester, J.J., Scowen, P.S., Sankrit, R., Burrows, C.J., Gallagher III, J.S., Holtzman, J.A., Watson, A., Trauger, J.T., Ballester, G.E., Casertano, S., Clarke, J.T., Crisp, D., Evans, R.W., Griffiths, R.E., Hoessel, J.G., Krist, J., Lynds, R., Mould, J.R., O’Neil, E.J. Jr., Stapelfeldt K.R., & Westph al J.A., 1995, ApJ, 448, 240
- Korpela & Bowyer (1998) Korpela, E.J. & Bowyer, S., 1998, AJ, 115, 2551
- K (98) K98: Kurt, V.G., Sokolov, V.V., Zharikov, S.V., Pavlov, G.G., & Komberg, B.V., 1998, A&A, 333, 547
- Malofeev (1999) Malofeev, V.V., Catalog of spectra of radio pulsars., 1999, preprint of the Radio Astronomical Observatory, Puschino, Scientific Center of the Russian Academy of Sciences
- Manchester et al. (1978) Manchester, R.N., Lyne, A.G., Taylor, J.H., Durdin, J.M., Large, M.I., Little, A.G., 1978, MNRAS, 185, 409
- Martin et al. (1998) Martin, C., Halpern, J.P., & Schiminovich, D., 1998, ApJ, 494, L211
- Middleditch et al. (1987) Middleditch, J., Pennypacker, C.R., & Burns, M.S., 1987 ApJ, 315, 142
- Mignani et al. (1997) Mignani, R.P., Caraveo, P.A., & Bignami, G.F., 1997, The Messenger, 87, 43
- Mignani et al. (1998) Mignani, R.P., Caraveo, P.A., & Bignami, G.F., 1998, A&A, 332, L37
- Mignani et al. (2000) Mignani, R.P., DeLuca, A., & Caraveo, P.A., 2000, astro-ph/0005184, accepted to ApJ
- Nasuti et al. (1997) Nasuti, F.P., Mignani, R., Caraveo, P.A., & Bignami, G.F., 1997 A&A, 323, 839
- Neizvestny (1983) Neizvestny, S.I., 1983, Izvestiya SAO RAS, 17, 26
- P (96) P96: Pavlov, G.G., Stringfellow, G.S., & Córdova, F.A., 1996, ApJ, 467, 370
- P (97) P97: Pavlov, G.G., Welty, A.D., & Córdova, F.A., 1997, ApJ, 489, L75
- Percival et al. (1993) Percival, J.W., Biggs, J.D., Dolan, J.F., Robinson, E.L., Taylor, M.J., Bless, R.C., Elliot, J.L., Nelson, M.J., Ramseyer, T.F., van Citters, G.W., & Zhang, E. 1993, ApJ, 407, 276
- Ramanamurthy et al. (1996) Ramanamurthy, P.V., Fichtel, C.E., Harding, A.K., Kniffen D.A., Sreekumar, P., & Thompson, D.J., 1996, A&AS, 120, 115
- Shvartsman (1970) Shvartsman, V.F., 1970, Soviet Astronomy – AJ, 14, 662
- Shearer et al. (1997) Shearer, A., Redfern, R.M., Gorman, G., Butler, R., Golden, A., O’Kane, P., Beskin, G.M., Neizvestny, S.I., Neustroev, V.V., Plokhotnichenko, V.L., & Cullum, M., 1997, ApJ, 487, L181
- Schlegel et al., (1998) Schlegel, D.J., Finkbeiner, D.P., Davis, M., 1998, ApJ, 500, 525
- Taylor et al. (1993) Taylor, J.H., Manchester, R.N., & Lyne, A.G., 1993, ApJS, 88, 529.
- Zavlin et al. (2000) Zavlin, V.E., Pavlov, G.G, & Halpern, J.P., 2000, in preparation