The template type Ia supernova 1996X††thanks: Based on observations collected at ESO-La Silla.
Abstract
UBVRIJ photometry and optical spectra of the Type Ia SN 1996X obtained at ESO during a one-year-long observational campaign are presented, and supplemented by late time HST photometry. Spectroscopically, SN 1996X appears to be a ‘normal’ SN Ia. The apparent magnitude at maximum was , and the colour . The luminosity decline rate, , is close to average for a SN Ia. The best estimate of the galactic extinction is , and there is evidence that reddening within the parent galaxy is negligible.
Detailed comparison of the light and colour curves of various ‘normal’ SNe Ia shows that the assumption that multicolour light curves can be described simply as a one-parameter family is not perfect. Together with problems in the calibration of the templates, this may explain the discrepancies in the distance modulus derived adopting different calibrations of the absolute magnitude vs. light curve shape relations. Indeed we found that MB ranges from to and range from 32.02 to 32.48 depending on the method used [1996a, 1999, 1998a].
Computations of model light curve and synthetic spectra for both early- and late-times, confirm that 1996X is a normal Type Ia SN and that a satisfactory fit can be obtained using a W7 progenitor structure only if we adopt the short distance. A larger distance would imply a too large Ni mass for this fainter than average SNIa.
keywords:
supernovae: general - supernovae: individual (SN 1996X) - galaxies: individual(NGC 5061)1 Introduction
One of the most exciting and unexpected results in recent astronomy is the apparent necessity for a finite cosmological constant, the result of measuring cosmic distances using Type Ia Supernovae (SNe Ia) as distance indicators. This result relies heavily on the assumption that the absolute magnitude of SNe Ia can be accurately calibrated based on the observed luminosity evolution [1998a, 1999].
The suggestion that the absolute magnitude of SNe Ia correlates with the luminosity decline rates dates back to Pskovskii (1967, 1977). However, only in the last decade, with the improvement in photometric accuracy made possible by CCD detectors, has this correlation been quantified, although its calibration and range of application are still debated (Phillips 1993; Phillips et al. 1999; Hamuy et al. 1996a,b,c; Riess et al. 1996, 1998a). Nearby SNe are essential for this approach because their absolute luminosity can be calibrated accurately using other distance indicators, e.g. Cepheid variables [1996, 1999] or the Globular Cluster Luminosity Function [1998, 1999].
Theoretically, the effort to build a scenario consistently linking progenitor and explosion to explain the observed diversity of SNe Ia is still in the very early stages [1998, 1999]. At this stage, high signal-to-noise observations of the spectroscopic and photometric evolution of nearby SNe Ia can provide valuable information. Unfortunately, good photometric coverage around maximum light and sufficient monitoring of the decline phase is available only for very few nearby SNe Ia, and thus it is very important to enlarge the sample. SN 1996X is one such object.
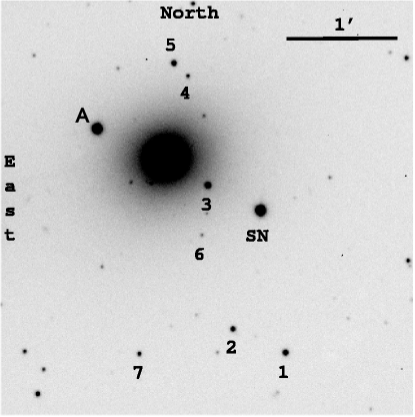
SN 1996X, wasdiscovered independently by Evans and Takamizawa on April 12.5 UT (I.A.U. Circ. No. 6380). The SN was located at , DEC. 50’ 45”.3 (equinox 2000.0), that is 52”W and 31”S of the nucleus of the elliptical galaxy NGC 5061 (Fig. 1). Early spectroscopic observations at different sites (cf. I.A.U. Circ. 6381) showed that SN 1996X was a type Ia caught before maximum light, which motivated an extensive observational campaign with ESO telescopes.
SN 1996X was also observed at other observatories, in particular at CTIO
[1999] (http//www.ctio.noao.edu\~riccov/sn96x.gif) and at
Mt. Whipple. A near-infrared spectrum was published by Bowers et al.
[1997].
Interestingly, Wang, Wheeler & Höflich [1997] claimed that SN 1996X showed evidence of intrinsic polarisation, suggesting an asphericity of in the elements distribution in the region of partial burning. This is the first time polarisation was measured in a SN Ia.
Finally, the SN field was observed at two late epochs with the WFPC2 on board HST (HST Data Archive).
In this paper we present the ESO observations, summarised in the UBVRIJ light curves and in the description of the evolution of the optical spectra. In addition we discuss some spectral modelling, and compare SN 1996X with other SNe Ia in the framework of using SNe Ia as distance indicators.
2 Observations and data reduction
2.1 Photometry
Photometry of SN 1996X was obtained mainly using the Dutch 0.9m telescope at ESO - La Silla (CCD TK33; scale 0.44 arcsec/pixel). In addition we used the ESO/MPI 2.2m telescope with EFOSC2 (CCDs TK19, 0.33 arcsec/pixel; Loral 40, 0.26 arcsec/pixel), the ESO 3.6m telescope with EFOSC1 (CCD TK26; 0.34 arcsec/pixel) and the ESO 1m DENIS telescope (CCD TK, 0.7 arcsec/pixel). Other observations were obtained at Asiago with the 1.82m telescope (CCD TK512M; 0.34 arcsec/pixel).
The frames were reduced using standard IRAF packages. Photometric nights were calibrated with observations of Landolt [1992] standard stars and used to define a local standard sequence which, in turn, was used to calibrate frames obtained under non-photometric conditions. The stars of the local sequence are identified in Fig. 1 and their magnitudes are listed in Table 1 along with r.m.s. deviations of the measurements obtained on different nights.
Infrared photometry was obtained at the ESO/MPI 2.2m telescope, equipped with IRAC2 (detector NICMOS-3 + lens LB, scale 0.278 arcsec/pixel), and at the ESO 1m DENIS telescope (NICMOS-3, 2.81 arcsec/pixel).
Calibration of the infrared photometry was performed as described in Lidman, Gredel & Moneti [1997]. As a check for photometric conditions we monitored star A (identified in Fig. 1), which was measured at J .
| id | U | B | V | R | I |
|---|---|---|---|---|---|
| 1 | 17.99.02 | 17.26.01 | 16.34.01 | 15.78.02 | 15.25.01 |
| 2 | 18.35.03 | 17.76.01 | 16.90.02 | 16.43.01 | 15.97.01 |
| 3 | 17.27.02 | 16.82.01 | 15.90.01 | 15.38.01 | 14.89.01 |
| 4 | 18.89.03 | 18.74.01 | 17.94.01 | 17.49.01 | 17.08.01 |
| 5 | 17.15.02 | 17.16.01 | 16.48.02 | 16.04.01 | 15.66.03 |
| 6 | 19.52.01 | 19.62.02 | 19.02.01 | 18.70.02 | 18.26.02 |
| 7 | 19.03.03 | 18.51.02 | 17.67.01 | 17.16.01 | 16.67.01 |
| 8 | 23.44.04 | 22.52.04 | 21.24.04 |
The SN was located in a region of smoothly varying background, and thus reliable estimates of the SN magnitude could in principle be obtained with plain aperture photometry. However, we preferred to use a point spread function (PSF) fitting technique [1993], because: the number of stars in the field is sufficient to measure the PSF and this method is less sensitive than aperture photometry to contamination by bad pixels and cosmic rays.
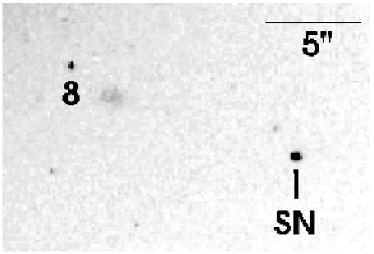
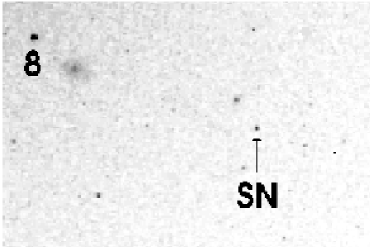
Observations of SN 1996X at late phases were obtained with the WFPC2 on board HST on two epochs: April 5 (F555W and F814W filters) and September 1, 1997 (F439W, F450W, F555W and F606W filters). The calibrated exposures were retrieved from the ST-ECF HST archive, properly aligned and combined to eliminate cosmic rays. At the two epochs pointing and camera orientation were quite different and the field overlap is only a small area around the SN. The instrumental magnitudes of the SN and of a foreground star (#8 in the Fig.2) were converted to the Landolt UBVRI system following the prescription of Holtzman et al. [1995]. The Apr 5 observations are bracketed by ground based observations, so that it was possible to verify that, within the errors, the converted HST and ground-based photometry are consistent.
The SN optical magnitude is reported in Table 2, and the IR ones in Table 3. The error estimates include the uncertainties in the internal calibration of the local sequence and in the PSF fitting. The latter dominates at late phases when the SN becomes faint.
| Date | Phase∗ | U | B | V | R | I | Telescope |
|---|---|---|---|---|---|---|---|
| [days] | |||||||
| 14/04/96 | 12.71 .03 | 13.29 .05 | 13.30 .02 | 13.3 .02 | 13.42 .03 | ESO/Dutch 0.9m | |
| 15/04/96 | 12.75 .03 | 13.34 .02 | 13.35 .02 | 13.26 .01 | 13.39 .03 | ESO/Dutch 0.9m | |
| 16/04/96 | 12.79 .02 | 13.27 .01 | 13.29 .02 | 13.25 .01 | 13.38 .01 | ESO/Dutch 0.9m | |
| 16/04/96 | – | – | 13.22 .01 | 13.17 .01 | – | ESO 3.6m+EFOSC | |
| 17/04/96 | 12.77 .04 | 13.25 .01 | 13.28 .01 | 13.23 .02 | 13.43 .01 | ESO/Dutch 0.9m | |
| 18/04/96 | 0.9 | – | 13.22 .15 | 13.30 .05 | 13.27 .02 | – | Asiago 1.82m |
| 19/04/96 | +1.9 | 12.94 .05 | 13.30 .01 | 13.21 .01 | 13.18 .01 | 13.54 .02 | ESO/Dutch 0.9m |
| 20/04/96 | +2.9 | 13.17 .09 | 13.30 .01 | 13.22 .01 | 13.19 .01 | 13.59 .01 | ESO/Dutch 0.9m |
| 23/04/96 | +5.9 | – | 13.51 .01 | 13.41 .01 | 13.34 .01 | 13.81 .02 | ESO/Dutch 0.9m |
| 24/04/96 | +7.2 | – | 13.62 .01 | 13.41 .01 | 13.43 .02 | 13.83 .02 | ESO/Dutch 0.9m |
| 25/04/96 | +8.2 | – | 13.70 .01 | 13.45 .01 | 13.51 .01 | 13.97 .01 | ESO/Dutch 0.9m |
| 26/04/96 | +9.2 | – | 13.79 .01 | 13.48 .01 | 13.55 .02 | 13.98 .02 | ESO/Dutch 0.9m |
| 27/04/96 | +10.1 | – | 13.91 .01 | 13.58 .01 | 13.60 .01 | 14.00 .01 | ESO/Dutch 0.9m |
| 28/04/96 | +11.1 | – | 13.99 .01 | 13.67 .01 | 13.69 .01 | 14.11 .01 | ESO/Dutch 0.9m |
| 04/05/96 | +15.9 | – | – | – | – | 14.11 .02 | ESO 1m + DENIS |
| 05/05/96 | +16.9 | – | – | – | – | 14.11 .02 | ESO 1m + DENIS |
| 05/05/96 | +17.0 | 15.15 .02 | 14.83 .03 | 14.11 .02 | 14.07 .02 | 14.16 .02 | ESO/Dutch 0.9m |
| 06/05/96 | +17.9 | – | – | – | – | 14.09 .01 | ESO 1m + DENIS |
| 07/05/96 | +18.9 | – | – | – | – | 14.08 .01 | ESO 1m + DENIS |
| 07/05/96 | +19.0 | 15.37 .01 | 15.10 .01 | 14.21 .02 | 13.96 .03 | 14.06 .02 | ESO/Dutch 0.9m |
| 09/05/96 | +22.0 | 15.73 .02 | 15.29 .01 | 14.23 .01 | 14.00 .02 | 13.88 .01 | ESO/Dutch 0.9m |
| 10/05/96 | +23.0 | 15.77 .04 | 15.50 .01 | 14.35 .01 | 14.03 .02 | 13.73 .03 | ESO/Dutch 0.9m |
| 11/05/96 | +24.0 | – | – | – | – | 14.00 .01 | ESO 1m + DENIS |
| 12/05/96 | +25.0 | – | – | – | – | 13.97 .01 | ESO 1m + DENIS |
| 13/05/96 | +26.3 | – | – | – | 14.14 .02 | 13.87 .03 | ESO/Dutch 0.9m |
| 13/05/96 | +26.3 | 16.04 .01 | 15.79 .01 | 14.53 .01 | 14.16 .02 | 13.81 .03 | ESO/Dutch 0.9m |
| 14/05/96 | +27.2 | 16.20 .01 | – | 14.68 .01 | 14.22 .01 | 13.97 .02 | ESO/Dutch 0.9m |
| 17/05/96 | +29.2 | 16.26 .04 | 16.01 .01 | 14.80 .02 | 14.44 .01 | 14.03 .03 | ESO/Dutch 0.9m |
| 19/05/96 | +31.3 | 16.25 .16 | 16.09 .03 | 15.01 .02 | 14.51 .01 | 14.13 .02 | ESO/MPI 2.2m + EFOSC2 |
| 22/05/96 | +34.2 | 16.53 .01 | 16.22 .02 | 15.10 .02 | 14.71 .01 | – | ESO/Dutch 0.9m |
| 26/05/96 | +39.2 | 16.75 .02 | 16.44 .01 | 15.36 .01 | 14.95 .01 | 14.64 .01 | ESO/Dutch 0.9m |
| 21/06/96 | +64.0 | – | – | – | 15.90 .04 | 15.91 .02 | ESO/Dutch 0.9m |
| 24/06/96 | +67.1 | – | – | 16.12 .01 | 16.01 .01 | 16.10 .01 | ESO/Dutch 0.9m |
| 28/06/96 | +72.0 | – | 16.95 .01 | 16.17 .02 | – | – | ESO/Dutch 0.9m |
| 15/07/96 | +89.2 | – | 17.08 .02 | 16.67 .01 | 16.61 .01 | 16.81 .01 | ESO 3.6m + EFOSC |
| 21/07/96 | +95.1 | 17.92 .01 | 17.19 .01 | 16.77 .02 | 16.84 .01 | 17.03 .01 | ESO/Dutch 0.9m |
| 06/09/96 | +142.1 | – | 18.10 .02 | – | – | – | ESO/MPI 2.2m + EFOSC2 |
| 02/01/97 | +259.3 | – | 19.73 .06 | 19.72 .03 | 20.40 .04 | – | ESO/Dutch 0.9m |
| 10/02/97 | +298.5 | – | 19.98 .03 | 20.28 .03 | – | – | ESO 3.6m + EFOSC |
| 31/03/97 | +347.0 | – | 21.00 .09 | 21.06 .07 | 21.63 .12 | – | ESO/Dutch 0.9m |
| 5/04/97 | +351.6 | – | – | 21.10 .08 | – | 20.86 .05 | HST + WFPC2 |
| 5/04/97 | +351.6 | – | – | 21.04 .05 | – | 20.78 .05 | HST + WFPC2 |
| 18/04/97 | +365.0 | – | 21.36 .10 | 21.34 .09 | – | – | ESO/Dutch 0.9m |
| 1/09/97 | +501.2 | – | 23.72 .13 | 23.71 .13 | – | – | HST + WFPC2 |
| 1/09/97 | +501.2 | – | 23.68 .20 | 23.89 .13 | – | – | HST + WFPC2 |
An external check on the reliability of the SN photometry can be obtained by comparing our results with those recently published by Riess et al. [1999].
This is done in Fig. 3, where we plot for the various photometric bands the difference between our estimates of the SN 1996X magnitudes and those of Riess et al. These have been interpolated to the epochs of our observations using cubic splines, but only if the phase difference was less than 3 days. Error bars were obtained adding in quadrature the errors on the individual points as reported for each source.

Although it is comforting that systematic differences are small (in all bands ), the deviations of single points are larger than expected from the combined errors. A similar conclusion was reached by Jha et al. [1999] when comparing their own photometry of SN 1998bu with that of Suntzeff et al. [1999]. They attributed this problem to differences in the filters used at different observatories (which are enhanced by the peculiar and fast evolving SN spectra) and to the difficulty in measuring the SN itself (see also Suntzeff 2000). Indeed, the deviations appear more pronounced in the I band, which is difficult to define and maintain properly because CCDs do not provide a fixed red-wavelength cut-off. The same is true for the U band at the other end of the optical spectrum but, since Riess et al. did not publish U photometry for SN 1996X, a similar test could not be performed.
Therefore one should be wary of overinterpreting small differences in the light curves of SNe Ia obtained with different instruments, especially for the U and I bands.
| date | phase∗ | J | H | K’ |
|---|---|---|---|---|
| [days] | ||||
| 29/04/96 | +12.3 | 15.24.05 | 14.19.04 | 14.17.06 |
| 04/05/96 | +16.0 | 15.05.11 | – | 14.0 |
| 05/05/96 | +16.9 | 15.02.10 | – | – |
| 06/05/96 | +17.9 | 14.89.10 | – | – |
| 07/05/96 | +18.9 | 15.12.13 | – | – |
| 11/05/96 | +24.0 | 14.67.07 | – | – |
| 12/05/96 | +25.0 | 14.56.07 | – | – |
| 23/08/96 | +128.0 | – | 17.0 | 15.0 |
Relative to the epoch of B maximum JD=2450191.5
2.2 Spectroscopy
Most of the spectroscopic observations were obtained with the ESO 1.5m telescope equipped with a Boller & Chivens spectrograph. Other observations were obtained using the ESO/MPI 2.2m + EFOSC2 and the ESO 3.6m + EFOSC1. One spectrum was obtained at Asiago with the 1.82m telescope and a B&C spectrograph.
The journal of the spectroscopic observations is given in Table 4. The overall spectral evolution is shown in Fig. 9. Two of the spectra displayed are the result of merging spectra obtained using different grisms during the same night.
Spectra were reduced using standard IRAF routines. He-Ar lamp exposures were used for wavelength calibration, and observations of spectrophotometric standard stars [1992, 1994] for flux calibration. The absolute flux calibration of the spectra was checked against the photometry and the flux scale was adjusted if necessary.
| date | phase∗ | Range | Res. | Instrument |
|---|---|---|---|---|
| [days] | [Å] | [Å] | ||
| 14/04/96 | -3.8 | 4600-6700 | 2.5 | ESO1.5+B&C+gr10 |
| 16/04/96 | -1.7 | 3700-7000 | 16 | ESO3.6+EF+B300,R300 |
| 17/04/96 | -0.8 | 4600-6700 | 2.7 | ESO1.5+B&C+gr10 |
| 18/04/96 | 0.2 | 3100-10700 | 18 | ESO1.5+B&C+gr2 |
| 19/04/96 | 1.2 | 3100-10700 | 15 | ESO1.5+B&C+gr2 |
| 21/04/96 | +3.9 | 4200-8600 | 30 | Asiago1.8+B&C+150tr |
| 25/04/96 | +7.2 | 3100-10500 | 11 | ESO1.5+B&C+gr2 |
| 30/04/96 | +12.1 | 4100-6800 | 14 | ESO1.5+B&C+gr5 |
| 10/05/96 | +22.0 | 3100-10600 | 11 | ESO1.5+B&C+gr2 |
| 12/05/96 | +24.3 | 3100-10600 | 11 | ESO1.5+B&C+gr2 |
| 19/05/96 | +31.3 | 3200-9100 | 11 | ESO2.2+EF2+gr6,5,1 |
| 13/06/96 | +56.0 | 3100-10400 | 13 | ESO1.5+B&C+gr2 |
| 14/06/96 | +57.1 | 3100-10400 | 14 | ESO1.5+B&C+gr2 |
| 14/07/96 | +87.6 | 3100-10600 | 15 | ESO1.5+B&C+gr2 |
| 20/12/96 | +246.0 | 3500-9300 | 8 | ESO1.5+B&C+gr25 |
| 10/02/97 | +298.4 | 3700-6900 | 16 | ESO3.6+EF+B300 |
Relative to the epoch of B maximum JD=2450191.5
3 Interstellar absorption
SN 1996X exploded in the outskirts of an early-type galaxy, and therefore extinction in the parent galaxy should be negligible. Indeed, our higher resolution spectra show no evidence of interstellar absorption lines at the host galaxy rest frame.
However, a faint narrow NaI D absorption (EW=0.27Å) is detected at the rest wavelength. This can be attributed to interstellar gas in our own Galaxy. Indeed, Munari & Switter [1997], studying a sample of galactic early type stars, have shown that there is a tight correlation between EW(NaI D) and interstellar reddening. Using their calibration we obtain for SN 1996X, mag, while a similar relation obtained by Barbon et al. (1990) for SNe Ia gives mag. These values are in excellent agreement with other estimates of the galactic absorption in the direction of NGC 5061. Burstein & Heiles [1984] found from H I/galaxy counts, while Schlegel, Finkbeiner & Davis [1998] deduced from the COBE/DIRBE and IRAS/ISSA maps. In this paper we adopt as the fiducial value for the total extinction.
4 The light curves

The UBVRIJ light curves of SN 1996X are shown in Fig. 4. We estimated that the SN reached B maximum on Apr 18, 1996 (JD) at a magnitude . Following the definition of Phillips [1993], we measured mag for SN 1996X, in good agreement with previous estimates, i.e. [1998a] and [1999]). 111the correction to caused by the presence of reddening (cf. sect. 5) is very small [1999] and has been neglected.
The apparent magnitudes in the different bands at the epoch of the respective maxima are listed in Table 5, along with other light curve parameters. As is normally observed in SN Ia, V and R maxima occured 2-3d later than B maximum, while the U and I maxima preceded it by 4d.
The I light curve shows the secondary maximum typical of “normal” SNe Ia. This occurs days after B maximum at a magnitude of 13.90, i.e. 0.50 mag fainter than the first maximum. At the same epochs a noticeable shoulder appears in the R curve, and a weaker one in V. The few available J observations appear to occur in the brightening phase to secondary maximum.
The light curves of SN 1996X are similar to those of other “normal” SNe Ia, e.g. SN 1994D or SN 1992A. The decline rate of SN 1996X is the same as that of SN 1994D , and slightly smaller than for SN 1992A, mag [1999].
In Fig. 5 we plot the difference between the photometry of SN 1996X and those of other well studied SNe Ia. The light curves were normalised to the apparent maximum in the given band and to the epoch of B maximum, and the differences were computed relative to the phase of SN 1996X observations (the light curves of the other SNe were interpolated when necessary). We selected as comparison the normal SNe 1992A and 1994D, and also SNe 1991bg (), 1998bu () and 1991T () to cover the entire range of SN Ia luminosity evolution.
Some systematic differences are apparent from this figure. In the B band the difference is greatest at around phase 20d, and then it remains constant or decreases. This is of course the reason why is so effective in discriminating between SNe Ia light curves. In the V and R bands, the picture is less clear. Whereas in the B band the SNe closest to SN 1996X are SNe 1992A and 1994D, as expected because of the similar , in the R band the best match to SN 1996X is SN 1998bu. This is true also in the I band. Indeed in SNe 1996X and 1998bu the I secondary maximum occurred at the same phase, i.e. 4-5 days later than in SN 1994D and was 0.15 mag fainter with respect to the first maximum.

SN 1996X is one of the very few SNe for which observations at epochs larger than 1 yr are available. The importance of the late light curve is that it provides useful insights into the process of radioactive energy deposition. The photometry of SN 1996X at day 500 is particularly accurate because it was obtained with HST, whose superior angular resolution allows a positive target identification and a more accurate background subtraction. It is also important that observations were obtained in different bands, giving an estimate of the B-V colour. The result is , which shows that the colour, and thus possibly the spectral shape as well, did not change significantly after day 150.
After day 150, and up to the epoch of the last observation, the light curves are remarkably linear in all bands. The decline rate is 1.7 mag (100d)-1 in B and V, and slightly smaller (1.4 mag (100d)-1) in R, although the photometric coverage in this band is not so good.
A comparison between the late V light curves of SN 1996X and those of the SNe Ia 1993L and 1992A [1997], normalised to the epoch and magnitude of maximum, is shown in Fig. 6. Up to day 400 the three light curves are similar, but later on SN 1996X declines at a much faster rate than the other two objects. The luminosity decline of SNe 1992A and 1993L is very close to the decline of energy release from 56Co decay, which translates to 0.98 mag (100d)-1. Since at such late phases -ray deposition is very small, this pattern may be taken to indicate that complete deposition of positrons is the principal source of power for the light curve. Indeed, Cappellaro et al. [1997] could fit one very late point (1000d) in mthe light curve of SN 1992A using a very large positron opacity, thus suggesting complete positron deposition. On the other hand, a normal value cm2 g-1 can successfully explain the point at 500d in the light curve of SN 1996X.

| maximum | U | B | V | R | I |
|---|---|---|---|---|---|
| JD (+2450000) | |||||
| 12.0.6 | 6.2.1 | 4.0.3 | 0.21 | ||
| 2.1.2 | 2.52.09 | 2.96.07 | 3.7 | ||
| – | 1.73.05 | 1.40.2 | – | ||
| colours# | UB | BV | VR | VI | |
# Measured at the epoch of B maximum
5 The colour curves
With the remarkable exception of the few “subluminous” SNe Ia, e.g. 1991bg and 1997cn (Turatto et al. 1996,1998), the colour curves of normal SNe Ia have similar shapes. Indeed, the colour evolution of SN 1996X is very similar to those of the “normal” SNe 1992A and 1994D but also to that of the bright SN 1991T, whose luminosity decline was much slower ( mag, Phillips 1993).
However, a detailed examination of the early phases shows that even after correction for galactic reddening small shifts remain between the colour curves of different SNe. This may be attributed to reddening in the host galaxy or to intrinsic differences between the SNe or more likely to both effects. However, the discrepancy between the photometry from different groups shown in Fig 3 and in Jha et al. [1999] suggests that differences in colour smaller than 0.1 mag should not be overinterpreted. This implies that the comparison of the colour curves cannot yield a reliable estimate of the absorption if this is smaller than A mag. For SN 1996X all we can say is that the colour curve is consistent with negligible reddening in the SN host galaxy.

6 The absolute magnitude of SN 1996X
The absolute magnitude of SN 1996X can be derived from the distance of the parent galaxy or conversely we can use the relation between light curve shape and SN absolute magnitude and hence derive the distance.
An estimate of the distance to NGC 5061 can be obtained from the recession velocity and the Hubble law. After correcting the measured heliocentric velocity (206546 km s-1, [1998]) for the Local Group infall onto Virgo (1949 km s-1) and using we obtain a distance modulus .
Faber et al. [1989] estimated the distance using the relation. On the same distance scale they obtained a much smaller value, .
| Source | M(B) | |
|---|---|---|
| - Faber et al. (1989) | ||
| v | ||
| (B) & Hamuy et al. (1996) | ||
| (B) & Phillips et al. (1999) | ||
| Riess et al. (1998a,1998b) | 32.4 |
Alternatively, we can use the relation between vs to calibrate the SN absolute magnitude. Depending on the calibration adopted, we obtain M, [1996a] or M [1999] which corresponds to a distance modulus of and respectively. The large offset between the two calibrations has been attributed to the use of different recipes for the correction of both galactic and host galaxy extinction [1999].
The absolute magnitude of SNe Ia can also be calibrated using the Multicolour Light-Curve Shapes (MLCS) method (Riess et al. 1996, 1998a). In this approach, the light curve of the SN under study is compared with those of template objects to obtain a simultaneous estimate of the “luminosity correction” and of the extinction. Although from a statistical point of view this method is expected to be more robust than the simple relation, the results are actually very sensitive to the calibration of the template objects, in particular the adopted distance and reddening. This is because the purported monotonic relation between absolute magnitude and colour, with intrinsically brighter SN being bluer, is not yet fully confirmed. This is manifested in the large difference in the template colour curve calibration between Riess et al. [1996] and Riess at al. [1998a].
With reference to SN 1996X, Riess et al. (1998a; their Fig. 13) showed that the MLCS fit of the V and B-V curves yields , and a calibrated absolute magnitude . Therefore the distance to NGC 5061 is derived to be (see also Riess et al. 1998b). This is the same result as obtained from the latest calibration of the relation [1999]. However there is an inconsistency with regard to the total observed reddening, which was estimated to be negligible whereas the evidence for significant galactic reddening is compelling. (cf.3). Some inconsistencies in the determination of the reddening using the MLCS method were also noticed by Turatto et al. (1998) in the case of SNe 1997cn and 1991bg.
The implication of the difference of the SN absolute magnitude calibration for the modeling will be addressed in the next sections.
Given that NGC 5061 is an elliptical galaxy, a further independent determination of the distance could be obtained using the globular cluster luminosity function method.
7 The bolometric light curve

Combining HST UV data, UBVIR data in the optical and JHK data in the IR for SN 1992A, Suntzeff [1996] computed the so-called uvoir bolometric luminosity, which integrates the flux emitted in the range 200-2200 nm, but only up to day 77. In all other cases the bolometric light curve of SN Ia was calculated from data with incomplete wavelength coverage assuming that “normal SNe Ia” behave similarly. This is the approach we adopt here to derive the uvoir bolometric light curve of SN 1996X, since only optical-band observations are available. We integrated the flux emitted in the Johnson-Cousins U,B,V,R,I passbands at the epochs for which measurements are available (for a few epochs the U magnitude was interpolated between points adjacent in time). This was then corrected to the 200-2200 nm adopting the appropriate “bolometric” correction as given in Suntzeff [1996] for SN 1992A.
As a justification for using this approach we note that the optical spectra and the light curve of SN 1996X are similar to those of SN 1992A. It is also important that at any epoch the UV and infrared emission account for at most 25 of the total flux.
For at least the one epoch when J, H and K’ photometry for SN 1996X is available we could measure the IR luminosity contribution. We find that on day +12 the infrared luminosity is about 10 of the total uvoir luminosity, in very good agreement with the estimates of Suntzeff [1996] for the same epoch. Day 77 is the latest epoch for which Suntzeff gives a “bolometric correction” for the optical flux. For later epochs a constant optical to bolometric correction was adopted.
The uvoir bolometric light curve for the first 100d, corrected for galactic reddening and for a distance modulus is plotted in Fig.8 (if we adopted the bolometric light curve would peak at ). For comparison we also show the uvoir bolometric light curve of SN 1994D obtained using the data of Patat et al (1996) and assuming and .
The observed light curves of SN 1996X were compared to a synthetic light curve obtained with the simple Monte Carlo light curve code used in Cappellaro et al. (1997). The synthetic bolometric light curve was computed for a W7 density structure, with an ejecta mass of and a synthesised 56Ni mass of . The synthetic light curve reproduces the uvoir bolometric light curves of both SNe 1994D and 1996X quite well near maximum. On the other hand, if we adopt the Phillips et al. [1999] calibration (M), the fit of the light curve peak requires a Ni mass of . This estimate, does not depend much on the particular model of the ejecta, would place SN 1996X near the high-Ni mass end of Chandrasekhar mass models of SNe Ia. If we consider that for its decline rate SN 1996X is expected to be fainter than the average of ‘normal’ SNe Ia, other SNe would be very difficult to explain within the Chandrasekhar mass explosion scenario.
About two weeks past maximum the observed luminosity decline becomes steeper. This is an epoch when the rapidly decreasing temperature may lead to a decreasing optical opacity. Also, the opacity is probably a function of element abundance in the ejecta, and the combination of these two effects is possibly at the basis of the observed “Phillips relation” between and . Since the optical opacity was treated as constant in our code (cm2g-1), this behaviour is not reproduced.
At later epochs (d) positron deposition becomes the dominant source of power for the light curve. The synthetic curve was computed using the standard value for the positron opacity, cm2 g-1. As the bolometric correction at these phases is unknown, we compared the model with the V observations, after matching the magnitude at maximum (Fig. 6). This comparison is justified if the bolometric correction is constant which, for epochs days, is supported by the fact that the colour remains costant. It results that the model reproduces the V light curve of SN 1996X between 250 and 500 days rather well, considering also the large errors in the photometry at these advanced epochs. Both SNe 1992A and 1993L lie well above the synthetic light curve at d. As already discussed by Cappellaro et al. (1997), this difference may imply that positron deposition was more efficient in those SNe than in SN 1996X. Whether this requires different explosion models, magnetic field characteristics or degree of ionization is not yet clear [1999].
8 The spectral evolution
Spectra of SN 1996X have been obtained at sixteen epochs, from phase –4d to +298d, following the rapid evolution during the early phases in detail and sampling more sparsely the slow late evolution. They are presented in Fig. 9.
The spectral evolution of SN 1996X is similar to that of other normal SNe Ia. At early phases the continuum is very blue and it is dominated by lines attributed to Fe-group (Fe, Co) and intermediate mass elements (in particular Si, Ca, S, Mg). The lines exhibit the characteristic P-Cygni profiles with the minima of the absorption components shifting towards longer wavelengths (smaller expansion velocities) with time. At two-three months after maximum the continuum is significantly redder ( 5-6000∘K), and nebular lines of [FeII] and [FeIII] begin to appear. At about 300 days these are the dominant features in the spectrum.
Exceptionally bright or dim SNe Ia (eg. SN 1991T and SN 1991bg) can easily be distinguished on the basis of their spectra, but differences also exist among ‘normal’ SNe Ia. These are more evident before maximum and in the nebular phase, but they disappear in the 2-3 months following maximum (cf. Li et al., 1999). In any case, differences among the spectra of ‘normal’ SNe Ia are small and can be appreciated only when observations of high signal to noise are compared.
In Fig. 10 we compare the spectra of SN 1996X with those of two SNe with a similar luminosity decline, SN 1992A and SN 1994D. The comparison is made at three different epochs: near maximum, two months and 300 days after maximum. The spectra are almost identical. One difference is that near maximum the 6355 Å SiII absorption in SN 1992A is more blue-shifted than in both SN 1996X and SN 1994D. This indicates that the average SiII velocity is larger by km s-1 in SN 1992A. A similar difference in velocity is seen in other SiII lines, e.g. the 5958-5979 Å line, which produces the weak absorption near 5800Å, but not in lines of SiIII or SII.
Another difference near maximum is a faint line at 4950Å, which appears to be stronger, or better resolved, in the spectrum of SN 1996X. This feature is probably due mostly to FeIII lines, and may indicate a higher degree of ionization in SN 1996X compared to the other two SNe.
Finally, the ratio of the deep FeIII absorption at 4250Å and of the neighbouring weak SiIII line near 4400Å is very different in the three SNe. This may be a temperature effect, since the SiIII line requires a much higher ionisation/excitation temperature, or an abundance effect, deserving further quantitative investigation.

The line velocities of Si II (6355 Å) and Ca II H&K have been measured from the minima of the P-Cygni absorption features, after correcting the spectra for the heliocentric velocity of the galaxy. These values can be taken to represent approximately the photospheric velocity. The velocities are listed in Table 7 and plotted in Fig. 11. They are similar to those of other normal type SNe Ia at equivalent phases (Barbon et al. 1990, Turatto et al. 1996). Closer inspection (Fig. 10) shows that whereas near maximum the expansion velocity of SN 1996X is similar to that of SN 1994D, and 10 smaller than that of SN 1992A, the velocity decrease of SN 1996X is slow, so that two weeks later the velocities of SN 1996X are comparable to those of SN 1992A.
Lentz et al. (1999) computed emergent photospheric-phase spectra for a grid of SN Ia atmospheres, and argued that a blueshift of the SiII 6355Å line could be indicative of an increased metallicity of the SN Ia progenitor. To reproduce the observed range in expansion velocity with the Lentz et al. (1999) models, a change of the metallicity by 2 order of magnitudes, from 0.1 to 10 times solar, is required. It should be noted that the parent galaxies of the three SNe shown in Fig. 11 are all of early type, either S0 (for SNe 1992A and 1994D) or E (for 1996X), and variations by two orders of magnitude in metallicity between those galaxies are not expected.


The velocity of the CaII H&K absorption has a different behaviour. It is very similar to the velocity of the same line in SN 1994D, indicating an expansion velocity 2000 km s-1 slower than for SN 1992A. This supports the conclusions of Wells et al. (1994) that m15(B) and the SiII velocity do not appear to be correlated, while m15(B) and the Ca II velocity are. This is not easy to explain since CaII H&K is a stronger line than SiII 6355Åand therefore it is even less indicative of the true photospheric expansion velocity.
We have also measured in the near-maximum spectra the (Si II) and (Ca II) ratios introduced by Nugent et al. (1995). The values for SN 1996X are 0.25 and 1.39, respectively, very similar to the values typical for ‘normal’ SNe Ia, in particular SN 1994D, for which the values are 0.29 and 1.38, respectively. According to Nugent et al. (1995), this indicates that the temperature and therefore the Ni mass are similar in these two objects. However, this may be contradicted by the very different strength of the SiIII line.
Mazzali et al. (1998) included SN 1996X and other SNe Ia in a diagram showing a correlation between (B) and the FWHM of the 4700 Å nebular feature, which is a blend of [FeII] and [FeIII] lines, and should thus reflect the mass and distribution of 56Ni. Since the preliminary measurements used by Mazzali et al. (1998) for their plot are confirmed here, that result is also confirmed.
| ph∗ | Si II | (SiII ) | Ca II | (CaII) |
|---|---|---|---|---|
| [Å] | [ km s-1] | [Å] | [ km s-1] | |
| -3.8 | 61584 | 11.4.2 | — | – |
| -1.7 | 61618 | 11.2.4 | 38243 | 11.8.2 |
| -0.8 | 61622 | 11.2.1 | — | – |
| +0.2 | 61654 | 11.0.2 | 38204 | 12.0.3 |
| +1.2 | 61654 | 11.0.2 | 38224 | 11.9.3 |
| +3.9 | 61695 | 10.9.2 | — | – |
| +7.2 | 61674 | 10.9.2 | 38224 | 11.9.3 |
| +12.1 | 61734 | 10.7.2 | — | – |
| +22.0 | 61854 | 10.1.2 | 38264 | 11.6.3 |
| +24.3 | 61904 | 9.9.2 | 38284 | 11.4.3 |
| +31.3 | 61945 | 9.7.2 | 38294 | 11.2.4 |
| +56.0 | — | — | 38405 | 10.6.2 |
| +57.1 | — | — | 38399 | 10.8.5 |
| +87.6 | — | — | 38418 | 10.4.3 |
Relative to the epoch of B maximum JD=2450191.5
9 Synthetic spectra
We fitted three early-time and one late-time spectra with our various codes in order to gain a deeper understanding of the properties of SN 1996X.
In particular, we modelled the spectra using two different distances. One set of models was computed for , which is the value obtained from the Hamuy et al. [1996a] calibration of the relation. This value makes SN 1996X an average SN Ia, comparable to SN 1994D, and somewhat brighter than SN 1992A, even when the larger GCLF distance to this SN is adopted. In fact, SN 1992 has a slightly larger value of than the other two SNe. Another set of models was computed for the largest distance, , which was obtained after Phillips et al. [1999]. This value makes SN 1996X brighter (). Different distances imply that different parameters are necessary to produce a synthetic spectrum that fits the observations.
We fitted the early-time spectra using our Monte Carlo code (Mazzali & Lucy 1993), which has been recently improved to include photon branching (Lucy 1999; Mazzali 2000). The code is based on the Schuster-Schwarzschild approximation and uses a large (about 106) line data base extracted from the line list of Kurucz & Bell (1995). Radiative equilibrium is assumed in order to compute the temperature structure. The epoch, luminosity and photospheric velocity are input to the code. We used a W7 density structure and mixed composition (Nomoto et al. 1984). For the lower boundary a black body radiation field is used. Its characteristic temperature is determined by the temperature iteration, thus taking into account the effect of backwarming resulting from inward travelling energy packets (used to sample the radiation field instead of photons) which are reabsorbed in the photosphere after line absorption and reemission or electron scattering. Conservation of luminosity above the photosphere ensures a comparison in flux between synthetic and observed spectra.

In order to make our results more sound, we modelled 3 rather widely spaced epochs: April 18, which is the epoch of maximum; April 25 and May 10. We adopted days for the delay of B maximum relative to the epoch of explosion, so our epochs are 20, 27 and 42 days respectively. When fitting a spectrum with our Monte Carlo code, our input parameters lead to changes in the overall flux (), in the line velocity () and in the overall nature of the spectrum (the temperature, which results from both and and on the details of the explosion model used). Therefore, given an observed spectrum, an assumed epoch and distance, we may hope that the allowed range of the parameters and can be at least narrowed down based on the quality of the fit.
The quality of a synthetic spectrum is judged according to its ability to reproduce the observed spectral features. This is essentially the result of deriving an appropriate temperature structure, and hence the correct runs of ionisation and excitation with radius, which is equivalent to velocity in a homologously expanding medium such as the SN ejecta.
Since we tested distance moduli that are different by 0.4 mag, our two sets of models have ’s that differ by almost a factor of 1.5 in order to reproduce the observed flux level. If this change in is not accompanied by a simultaneous change in , the two sets of models will have temperatures different by a factor . This would lead to significant differences in the synthetic spectra. On the other hand, an almost identical temperature can be obtained if the increase in by a factor 5 is accompanied by an increase in by a factor . In this case the temperature of the two models is the same, but the photosphere moves significantly in radius/velocity space, and thus the line features have different redshifts: a larger means bluer lines. This is particularly noticeable for those lines that are reasonably well isolated in wavelength space. A second-order effect is also that for a large the amount of ejecta above the photosphere, with which the energy packets released at the photosphere can interact, is smaller. This leads to reduced backwarming and to a flatter temperature structure. If is very large, a given explosion model may not have sufficient mass above the photosphere to yield the observed line strengths. All these tests are useful to determine which is the better value of the distance, at least given a particular explosion model. We now briefly discuss the models for the three epochs.
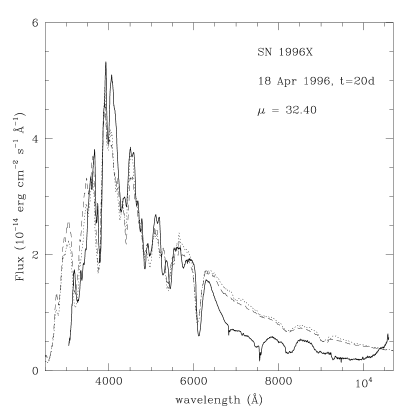
9.1 18 April 1996, day 20 past explosion
The observed spectrum shows signs of a high temperature through the presence of the Si III line at Å, the strength of the Si II 6355Å line and of the two S II features at 5200 and 5400Å. For the shorter distance, a good fit to the spectrum can be obtained for the following parameters: (erg s-1); km s-1. Other important parameters and the photometry of the synthetic spectrum are listed in Table 8. The best-fitting model is shown in Fig. 12. When the larger distance is adopted, increases to 43.24. In order to achieve a reasonable temperature and to produce the correct excitation/ionisation regime, must increase to 10000 km s-1. The synthetic spectrum (Fig. 13, dashed line) has the correct lines, but all these lines are weaker than in the observed spectrum. Because of the large , the absorbing mass is in fact smaller than in the model for the shorter distance. Also, more flux escapes in the near-UV (below 3200Å) because line blanketing is not strong enough. Finally, the velocity of lines such as Si II and S II is larger than in the observed spectrum. This shows that the large distance leads to parameters which are less compatible with the observations. As an instructive example, we also show in Fig. 13 (dotted line) a synthetic spectrum obtained after multiplying the density by a factor of 1.6: the lines are deeper, but the velocities are still incorrect. Therefore, the shorter distance appears to be favoured.
9.2 25 April 1996, day 27 past explosion

The next epoch we modelled, day 27, is marked by a cooling of the ejecta. This is evident in the disappearance of the Si III line, the strengthening of the Si II and Ca II lines, and the overall redder colour of the spectrum. Our short distance model gives a best fit for (erg s-1); km s-1. The temperature (Table 8) is lower than on day 20. The synthetic spectrum is shown in Fig. 14. The poor fit in the red is due to our assumption of black body radiation at the lower boundary. The lack of spectral lines in the red means that the effective opacity is much lower in that region than in the and part of the spectrum, and hence our assumed photospheric radius is larger than its real value. Still, line features (e.g. the Ca II IR triplet) are well reproduced. Elsewhere, the synthetic spectrum fits the observed one well.
9.3 10 May 1996, day 42 past explosion
In the third epoch, the spectrum shows very deep absorptions, indicating that the photosphere has receded deep inside the ejecta. The overall colour is very red () and all lines are from low-ionisation species. Na I D appears as a strong line near 5700Å. Our best fit for the short distance has (erg s-1); km s-1, which is very small. The temperature is also much smaller than at earlier epochs. The synthetic spectrum (Fig. 15) fits the observations reasonably well. The problem with the red flux is now gone, because the photosphere is so deep that the relative change of with is small and the low temperature means the red flux is relatively high. As is typical at these epochs, the Na I D line could only be obtained by adding a small amount of neutral Na (Na I/Na = ) by hand. We are not aware of any calculation where the Na I D line is correctly reproduced at this advanced epoch (see e.g. the NLTE synthetic spectrum shown in Pauldrach et al. 1996).
In this case the absolute change of is small, and the overlying mass is large in both cases, so that they cannot be distinguished so easily. Also, the run of ionisation with radius is rather flat, because of the low temperature, and thus no line really marks , as did e.g. S II at earlier epochs.
At more advanced epochs the spectrum becomes contaminated by nebular emission and cannot be successfully modelled with our Monte Carlo code. Note that the used at the three epochs are consistent with the values of derived from the observations in Fig. 8.
9.4 10 Feb 1997, day 318
We used a 1-zone NLTE code to compute the nebular spectrum at 10 months. The code computes the instantaneous deposition of -rays and positrons from the decay of 56Co and uses this as the heat input into the SN nebula, which is bounded by an outer velocity and is composed mostly of Fe at this late epoch. The outer nebular velocity is determined fitting the width of the emission lines; the temperature and density, and hence the mass of 56Ni originally synthesized, by fitting the ratio of the two strong lines in the blue. The bluer of these lines is in fact a blend of mostly Fe III] lines, while the redder one contains about equal contributions of Fe II] and Fe III] lines.
The spectrum can be fitted equally well for both distances if different 56Ni masses are used. The outer velocity is 9250 km s-1. For the short distance a good fit is obtained for M⊙ and a total mass in the nebula (i.e. within the outer velocity) of 0.70 M⊙. This can be compared with M⊙ and a total mass of 0.85 M⊙ contained within 9500 km s-1 in W7. The fit is shown in Fig. 16. These values indicate that SN 1996X can be regarded as a ’normal’ SN Ia.
If on the other hand the long distance is used, a good fit requires M⊙ and a total mass in the nebula within 9500 km s-1 of 1.00 M⊙. This values are larger than in W7, and may lead to a total ejected mass larger than the Chandrasekhar limit if a density distibution similar to that of W7 were adopted at velocities larger than the outer nebular velocity. Clearly, the estimate of the distance has consequences on the interpretation of the properties of SN 1996X.
| Date | epoch | Teff | TBB | M(ab) | W | MBol | |||||||
|---|---|---|---|---|---|---|---|---|---|---|---|---|---|
| d | log erg/s | km/s | K | K | g/cm3 | M | synthetic | ||||||
| 18/04/96 | 20 | 43.05 | 8000 | 9500 | 12000 | -13.35 | 0.70 | 0.50 | 12.96 | 13.30 | 13.21 | 12.85 | -18.90 |
| 25/04/96 | 27 | 42.91 | 6750 | 8200 | 9700 | -13.54 | 0.84 | 0.36 | 13.70 | 13.70 | 13.35 | 13.11 | -18.55 |
| 10/05/96 | 42 | 42.41 | 2500 | 8200 | 10000 | -13.40 | 1.25 | 0.41 | 15.82 | 15.67 | 14.38 | 14.10 | -17.30 |


10 Conclusions
We have presented photometric and spectroscopic data of Supernova 1996X obtained at ESO-La Silla and Asiago.
By examining the UBVRIJ light curves, the colour curves and the spectra, we conclude that SN 1996X is a ‘normal’ SN Ia, i.e. it does not show peculiarities resembling ‘overluminous’ or ’underluminous’ SNe Ia. We measure (B) = 1.310.08 mag, similar to the values found for the ‘normal’ SNe Ia 1992A and 1994D, the most similar to SN 1996X also in their spectroscopic evolution.
Different absolute magnitudes are obtained if one adopts the distance modulus for the host galaxy obtained by Faber et al. (1989) using the D relation or that derived from the distance-redshift relation.
The value of the interstellar extinction A reported by Schlegel et al. (1998) is consistent with the value we find using the relation between the equivalent width of the Na I D line in the spectra and the interstellar extinction. However, both the Multicolour Light-curve Shape and the snapshot methods by Riess et al. (1996, 1998a) yield as a result that the absorption is zero. The problem is that the relations between light curve shape and colour and the absolute magnitude of a SN Ia are not yet fully reliable, probably because of problems in estimating distance and reddening in the sample used for the calibration. The same problems may explain the discrepancy between different calibration of the relation [1996a, 1999].
We have modelled four spectra at various epochs, using our Monte Carlo code and a 1-zone NLTE nebular code, to investigate the problems related to determining the distance. We found that a large distance is difficult to accomodate. If we use the distance obtained from Hamuy et al. [1996a] calibration of the relation, , reasonable synthetic spectra for the photospheric-epoch can be obtained using a standard W7 density structure. The late-time spectra can be fitted using M⊙, which is appropriate for W7, and a similar value is also necessary to reproduce the light curve near maximum with a Monte Carlo code. However, if we use a larger distance, , the early-time spectra are better reproduced for a photospheric velocity larger than the observed one, the late-time spectra require a larger 56Ni mass, and models in general models favour an ejecta mass larger than the Chandrasekhar mass. For the shorter distance, the opposite problem arises.
One of the main problems in our understanding the properties of SN Ia is that we do not know enough yet about the progenitors and the explosion mechanism of SN Ia. Objects with similar (B) and general spectral behaviour could have different evolution and intrinsic characteristics, in particular different expansion velocities, as is shown in Figure 11, and perhaps also different absolute magnitudes.
We need to get more high quality data for nearby SN Ia and their host galaxies to clarify this, as SN Ia are now the most reliable distance indicators on a cosmological scale, and the value of their absolute magnitude has to be calibrated using nearby objects.
Since the host galaxy of SN 1996X is an elliptical galaxy, the Globular Cluster Luminosity Function (GCLF) method (Drenkahn & Richtler, 1999, Della Valle et al., 1998) could provide a velocity-independent estimate of its distance.
Acknowledgments
We thank all the astronomers who kindly observed SN 1996X for us at ESO-La Silla: Chevallier, L., Tappert, C., Metanomski, A.D.F., Massone, G., Wickmann, L.A., Van Bemmel, I., Spyromilio, J., Zanin, C.. We especially thank Fouque, P., who provided reduced IJK data of the SN obtained at the DENIS 1m telescope.
References
- [1990] Barbon, R., Benetti, S., Cappellaro, E., Rosino, L., Turatto, M., 1990, A&A, 237, 79
- [1997] Bowers, E. J. C., Meikle W. P. S., Geballe, T. R., Walton, N. A., Pinto, P. A., Dhillon, W. S., Howell, S. B., Harrop-Allin, M. K., 1997, MNRAS, 260, 663
- [1984] Burstein, D., Heiles, C., 1984, ApJS, 54, 33
- [1997] Cappellaro, E., Mazzali., Benetti, S., Danziger, I. J., Turatto, M., Della Valle M., Patat, F., 1997, A&A, 328, 203
- [1998] da Costa, L. N. , et al. 1998, AJ, 116, 1
- [1998] Della Valle, M., Kissler-Patig, M., Danziger, J., Storm, J., 1998, MNRAS, 299, 267
- [1999] Drenkhahn, G., Richtler, T., 1999, A&A, 349, 877
- [1989] Faber, S. M., Wegner, G., Burstein, D., Davies, R. L., Dressler, A., Lynden-Bell, D., Terlevich, R. J., 1989, ApJS, 69, 763
- [1992] Hamuy, M., Walker, A. R., Suntzeff, N. B., Gigoux, P., Heathcote, S. R., Phillips, M. M., 1992, PASP, 104, 533
- [1994] Hamuy, M., Suntzeff, N. B., Heathcote, S. R., Walker, A. R., Gigoux, P., Phillips, M. M., 1994, PASP, 106, 566
- [1996a] Hamuy, M., Phillips, M. M., Schommer, R., Suntzeff, N. B., Maza, J., Avilés, R., 1996a, AJ, 112,2391
- [1996b] Hamuy, M., Phillips, M. M., Suntzeff, N. B., Schommer, R., Maza, J., Avilés, R., 1996b, AJ, 112, 2398
- [1996c] Hamuy, M., Phillips, M. M., Suntzeff, N. B, Schommer, R., Maza, J., Smith, C., Lira, P., Avilés, R., 1996c, AJ, 112, 2438
- [1998] Höflich, P., Wheeler, J. C., Thielemann, F., 1998, ApJ, 495, 617
- [1995] Holtzman, J.A., Burrows, J.C., Casertano, S., Hester, J.J., Trauger, J.T., Watson, A.M., Worthey, G., PASP, 107, 1065
- [1999] Jha, S. et al., 1999, astro-ph/9906220
- [1993] Kurucz, R.L., Bell, B. 1995, Kurucz CD-ROM No. 23
- [1992] Landolt, A. U., 1992, AJ, 104, 340
- [1999] Lentz, E. J., Baron, E., Branch, D., Hauschildt, P. H., Nugent, P. E., 1999, astro-ph/9906016
- [1999] Li, W. D., Qiu, Y. L., Zhu, X. H., Hu, J. Y., Richmond, M. W., Filippenko, A. V., Treffers, R. R., Peng, C. Y., Leonard, D. C., 1999, AJ 117, 2709
- [1997] Lidman, C., Gredel, R., Moneti, A., 1997, IRAC2b User Manual, ESO
- [1999] Lucy, L. B., 1999, A&A, 345, 211
- [1999] Madore, B. F. et al., 1999, ApJ, 515, 29
- [1993] Mazzali, P. A., Lucy, L. B., 1993, A&A, 279, 447
- [1998] Mazzali, P. A., Cappellaro, E., Danziger, I. J., Turatto, M., Benetti, S., 1998, ApJ Letters 499, L49
- [2000] Mazzali, P. A., 2000, A&A, submitted
- [1999] Milne, P.A., The, L.-S., Leising, M.D., 1999, ApJS, 124, 503
- [1997] Munari, U., Zwitter, T., 1997, A&A, 318, 269
- [ 1984] Nomoto, K., Thielemann, F.-K., Yokoi, K., 1984, ApJ, 286, 644
- [1995] Nugent, P., Phillips, M., Baron, E., Branch, D., Hauschildt, P., 1995, ApJ, 455, L147
- [1998] Patat, F., Benetti, S., Cappellaro, E., Danziger, I. J., Della Valle, M., Mazzali, P. A., Turatto, M., 1996, MNRAS, 278, 111
- [1996] Pauldrach, A. W. A., Duschinger, M., Mazzali, P. A., Puls, J., Lennon, M., Miller, D. L. 1996, A&A, 312, 525
- [1999] Perlmutter, S. et al., 1999, ApJ, 517, 565
- [1993] Phillips, M. M., 1993, ApJ, 413, L105
- [1999] Phillips, M. M., Lira, P., Suntzeff, N. B., Schommer, R. A., Hamuy, M., Maza, J., 1999, AJ, 118, 1766
- [1967] Pskovskii, IU. P., 1967, Sov. Astron., 11, 570
- [1977] Pskovskii, IU. P., 1977, Sov. Astron., 21, 675
- [1996] Riess, A. G., Press, W. H., Kirshner, R. P., 1996, ApJ, 473, 88
- [1998a] Riess, A. G.,Filippenko, A. V., Challis, P., et al., 1998a, AJ, 116, 1009
- [1998b] Riess, A. G., Nugent, P. , Filippenko, A. V., Kirshner, R. P., Perlmutter, S. 1998b, ApJ, 504, 935
- [1999] Riess, A. G. et al., 1999, AJ 117, 707
- [1996] Sandage, A., Saha, A., Tammann, G. A., Labhardt, L., Panagia, N., Macchetto, F. D., 1996, ApJ, 460, L15
- [1998] Schlegel, D. J., Finkbeiner, D. P., Davis, M., ApJ, 500, 525
- [ 1998] Schmidt, B. P. et al., 1998, ApJ, 507, 46
- [1996] Suntzeff, N. B., 1996, in Supernovae and Supernova Remnants, IAU Colloquium 145, ed. R. McCray, Z. Wang (Cambridge: Cambridge Universty Press), 41
- [1999] Suntzeff, N. B., Phillips, M. M., Covarrubias, R. et al., 1999, AJ, 117, 1195
- [2000] Suntzeff, N. B., 2000 astro-ph/0001248
- [1993] Turatto, M., Cappellaro, E., Benetti, S., Danziger, I. J., 1993, MNRAS, 265, 471
- [1996] Turatto, M., Benetti, S., Cappellaro, E., Danziger, I. J., Della Valle, M., Gouiffes, C., Mazzali, P. A., Patat, F., 1996, MNRAS, 283, 1
- [1998] Turatto, M., Piemonte, A., Benetti, S., Cappellaro, E., Danziger, I. J., Mazzali, P. A., Patat, F., 1998, AJ, 116, 2431
- [1999] Umeda, H. , Nomoto, K. ’I., Kobayashi, C. , Hachisu, I., Kato, M. 1999, ApJ, 522, L43
- [1997] Wang, L., Wheeler, J. C., Höflich, P., 1997, ApJ, 476, L27
- [1994] Wells, L. A. et al., 1994, AJ, 108, 2233