Dynamical and content evolution of a sample of clusters from z0 to z0.5
Abstract
In this paper, we present an analysis of the dynamics and segregation of galaxies in rich clusters from z0.32 to z0.48 taken from the CFHT Optical PDCS (COP) survey and from the CNOC survey (Carlberg et al. 1997). Our results from the COP survey are based upon the recent observational work of Adami et al. (2000a) and Holden et al. (2000) and use new spectroscopic and photometric data on six clusters selected from the Palomar Distant Cluster Survey (PDCS; Postman et al. 1996). We have compared the COP and CNOC samples to the ESO Nearby Abell Cluster Survey (ENACS: z0.07).
Our sample shows that the clusters have the same velocity dispersion versus magnitude, morphological type and radius relationships as nearby () Abell clusters. The z0.48 clusters exhibit, however, departures from these relations. Furthermore, there appears to be a higher fraction of late–type (or bluer, e.g. Butcher and Oemler, 1984) galaxies in the distant clusters compared to the nearby ones.
The classical scenario in which massive galaxies virialize before they evolve from late into early type explain our observations. In such a scenario, the clusters of our sample began to form before a redshift of approximately 0.8 and the late–type galaxy population had a continuous infall into the clusters.
galaxies: clusters: general — cosmology: observations — cosmology: large scale structure of universe
1 Introduction
Over the last 25 years, there has been significant effort in understanding the morphological evolution of galaxies and the dynamical evolution of the clusters of galaxies. The early work in this area proved very fruitful. It provided strong evidence for galaxy morphological segregation in clusters (Oemler 1974 and Melnick Sargent 1977), i.e. early–type galaxies preferentially occupy denser environments and/or are preferentially found near the cluster centers. In recent years, there have been many refinements to these initial observations e.g. Dressler (1980), Kent Sargent (1983), Whitmore Gilmore (1991), Biviano et al. (1997), Stein (1997), Adami et al. (1998), Metevier et al. (2000).
These works have, however, not fully determined whether this morphological segregation is simply a function of redshift and/or the cluster environment e.g. does the galactic content of clusters evolve with cosmic epoch or as a function of the cluster’s virial mass? To try to understand these issues, there has been considerable effort over the last two decades dedicated to studying the dynamical and morphological evolution of clusters via multi–object spectroscopy and photometric imaging; for example, Dressler (1980); Butcher & Oemler (1984); Gunn et al. (1986); Couch et al. (1991); Bower et al. (1997); Carlberg et al. (1997); Dressler et al. (1999).
Over the last few years, large surveys of distant clusters of galaxies – e.g. the Canadian Network of Observational Cosmology (CNOC) (see Carlberg et al. 1997) – have begun to provide interresting answers. For example, the red galaxies in the CNOC cluster sample (assumed to be early type galaxies) have a velocity dispersion nearly times lower than the blue galaxies (assumed to be later type galaxies).
| mean z | vel. disp. | corrected vel. disp. | sampling | center (J2000) | |
|---|---|---|---|---|---|
| PDCS16 | 0.398 | 944300 km.s-1 | 802 km.s-1 | 12 | 2h28m27.7s 0deg31’58” |
| PDCS30/45 | 0.250 | 607470 km.s-1 | 516 km.s-1 | 14 | 9h54m38.3s 47deg45’40” |
| PDCS30/45 | 0.331 | 588480 km.s-1 | 500 km.s-1 | 9 | 9h54m34.7s 47deg12’10” |
| PDCS38 | 0.469 | 1819720 km.s-1 | 1546 km.s-1 | 13 | 9h51m35.3s 47deg45’40” |
| PDCS57 | 0.459 | 1282 km.s-1 | 1090 km.s-1 | 7 | 13h23m35.3s 30deg6’10” |
| PDCS62 | 0.462 | 1757630 km.s-1 | 1493 km.s-1 | 19 | 13h23m33.7s 30deg22’48” |
We have also initiated a new study, the CFH Optical PDCS (COP) survey, described in detail in Adami et al. (2000a) and Holden et al. (2000). The COP survey contains approximately 650 galaxy redshift measurements (from 6 nights of CFHT time) towards more than 10 PDCS clusters at a mean redshift of 0.4. We have also obtained R–band photometry at the CFHT for these targets. We have combined our R-band data with the published PDCS photometry in V and I. This combined data set is allowing us to study the dynamical and morphological status of optically selected distant clusters of galaxies. We can then directly compare with the ENACS (ESO Nearby Abell Cluster survey: e.g. Katgert et al. 1996) and CNOC samples (Carlberg et al. 1997). Due to the relatively low number of galaxies, the statistics of an individual cluster are too low to compare individually to nearby clusters. Therefore, we combined the data from all the clusters in our COP study (at z0.4) whose velocity dispersions were greater than 500 km.s-1 into one composite cluster. We also applied the same technique to the available CNOC data from which we built two composite clusters, one at z0.32 and one at z0.48. Our results and conclusions, then, are based upon the comparison of the composite clusters constructed in the same way from the ENACS, COP and CNOC surveys.
In Section 2, we summarize the data and describe the methods used in analyzing them. We then discuss evolutionary effects, since our clusters extent over a relatively large redshift range and have been all analyzed in the same manner. In Section 3, we describe our measurements of galaxy segregation. In Section 4 we discuss the galaxy evolution in our cluster sample as a function of redshift and the implications that our data pose on the formation epoch of these clusters. We use q0=0 and =0. Distances are given in units of h=/100.
2 The data
In this paper we use the COP data described in Adami et al. (2000a) and Holden et al. (2000) as well as the ENACS and CNOC data. The COP survey is an imaging and spectroscopic follow-up of 10 PDCS (Postman et al. 1996) lines–of–sight which contain 15 PDCS cluster candidates at z0.4 (Adami et al. 2000a and Holden et al. 2000). Here, we compare the dynamical characteristics of the galaxies belonging to those PDCS clusters to their ENACS (Adami et al 1998) and CNOC counterparts. The low redshift data are based on a compilation from the ENACS database (Katgert et al. 1996, Mazure et al. 1996) and the literature (Adami et al. 1998). All the galaxies in the nearby sample have a redshift and a magnitude that were derived in the same manner as the current data. They have also been classified into morphological types, but no color data comparable to our COP data are available.
We also use 5 CNOC clusters available in the literature (MS0016+16, MS0302+16, MS1008-12, MS1224+20 and MS0451-03). MS1358+62 and MS1621+26 were excluded from the sample because of their distorded apparent shape. The CNOC galaxies have r and g magnitudes and are classified into spectral types according to their color and spectral distribution (Yee et al. 1996). We compute an absolute magnitude according to the redshift and the spectral type of each galaxy using the k-corrections given in Frei Gunn (1994) (see below for the definition of the CNOC spectral types).
2.1 Velocity dispersions and definition of the PDCS sample
We used the most massive () clusters in the PDCS sample in our comparison with the ENACS and CNOC surveys in order to match the same class of clusters. We compute the velocity dispersions of the massive systems detected in the COP survey (Adami et al. 2000a) using the bi–weight robust estimators of Beers et al. (1990) and applying a “3- clipping”. This is exactly the same methodology used by Adami et al. (1998) for the ENACS systems and this ensure us to have robust estimators despite the relatively low numbers of galaxies used.
Our final velocity dispersion measurements are within 5 of those presented in Holden et al. (2000) for all the clusters in common except PDCS30/45. This last group has a complicated structure in redshift space which probably produced deviations from Holden et al. in the velocity dispersion determination. However, if we excluded that cluster from our sample, the results described in the following sections do not change by more than 5. We decided, therefore, to not exclude those galaxies when building our composite cluster (see next section).
Due to the small number of redshifts per cluster in our sample (), we were unable to distinguish between inter-loper galaxies – those which are passing-through the cluster but are not physically bound to the cluster – and real cluster members. Katgert et al. (1996) showed that not excluding inter-lopers results in an increase of the velocity dispersion of the clusters by between 10 and 25. To account for this effect in our sample, we have, therefore, systematically decreased our measured velocity dispersions by 15.
For this paper, we selected only the clusters with a redshift greater than 0.25, a velocity dispersion greater than 500 km.s-1 and with more than 7 redshifts (see Table 1). In total, we have 6 clusters at a mean redshift of 0.4 and 74 cluster galaxies with measured redshift and VPDCS and IPDCS magnitudes (56 have also measured R magnitude). Only one of the clusters in our sample has fewer than 9 redshifts. This is not a problem because the velocity dispersion can be reliably estimated using bi-weight estimators with 9 or more redshifts (see Lax 1985).
2.2 The CNOC sample
We analyzed the CNOC clusters in the same way as the PDCS and ENACS clusters. First of all, we defined groups along the lines of sight by using the same gap technique as in Adami et al. (1998) or Adami et al. (2000a). This technique searches for gaps of more than 1000 km.s-1 in the distribution of the galaxies ordered by increasing redshift. The choice of 1000 km.s-1 is well adapted to the data we have (see also Katgert et al. 1996). We checked, however, that values between 600 and 1500 km.s-1 do not significantly change the results. When more than 5 galaxies were between two velocity gaps, we assumed that this was a structure. With this technique we detected all the groups defined in Carlberg et al. (1997) with very similar mean redshifts (see Table 2) plus several small and probably diffuse groups not listed by Carlberg et al.
In order to use a uniform set of selection criteria, we chose only groups with a velocity dispersion larger than 500 km.s-1. When the detected groups were found to be listed in Carlberg et al. (1997), we used the velocity dispersion quoted in that paper. For groups not detected by Carlberg et al, we computed the velocity dispersion by the same method described in the previous section. We kept only groups with velocity dispersions larger than 500 km.s-1. In total, only one structure was added to the 5 main structures in the CNOC sample (Carlberg et al. 1997). This group, in the MS0016+16 field, is at a redshift of 0.328 and has a velocity dispersion of 610 km.s-1 (denoted MS0016+162 in the following). Excluding this group did not change the results significantly.
Finally, we only used the CNOC galaxies within a radius of 1 h-1 Mpc from the center in order to match approximately the PDCS and ENACS criteria. For MS0016+162, we used the position of the brightest galaxy as the center.
| mean z | vel. disp. | sampling | |
|---|---|---|---|
| MS0016+16 | 0.548 | 1243 km.s-1 | 42 |
| MS0016+162 | 0.326 | 610 km.s-1 | 8 |
| MS0302+16 | 0.425 | 656 km.s-1 | 33 |
| MS0451-03 | 0.539 | 1354 km.s-1 | 43 |
| MS1008-12 | 0.307 | 1059 km.s-1 | 75 |
| MS1224+20 | 0.326 | 798 km.s-1 | 24 |
The end result was 6 CNOC structures (see Table 2): three of them at z0.32 (MS0016+162, MS1008-12 and MS1224+20); the other three in the redshift interval [0.4;0.55] (MS0016+16, MS0302+16 and MS0451-03, mean redshift of z0.48). We built as described in Section 2.3 two CNOC composite clusters with these structures. The z0.32 composite cluster has 107 galaxies and the z0.48 composite cluster has 118 galaxies. These numbers are similar to the number of galaxies in the COP composite cluster.
2.3 Velocity normalization
Following Adami et al. (1998), we built ”composite clusters” made by combining the data from all the individual systems. We compute galaxy velocities relative to the mean velocity and normalized to the velocity dispersion of each cluster. The normalized velocity of galaxy ”i” in cluster ”j”, v, is defined as
v = (vi-v)/,
with v being the mean velocity of cluster , being its velocity dispersion and vi the original velocity of galaxy “i”. We merged these normalized velocities into the composite clusters.
The uncertainties could be introduced by systematic errors on the ; however, the use of robust estimators prevents us from severe biases in the estimation of the . We stress that this technique of using composite clusters has been already used successfully, for example in Adami et al. (1998).
We have also investigated possible bias due to velocity dispersion inhomogeneity between the 3 composite clusters. We are not very likely to have such selection effects because at z0.32, 0.40 and 0.48, the mean velocity dispersions of the individual clusters used to make the composite clusters are 966 km.s-1, 1047 km.s-1 and 1119 km.s-1 and they are overlapping if we consider error bars.
2.4 Estimating the morphological type of the PDCS cluster galaxies
| color (z) | E | Sbc | Scd | Im |
|---|---|---|---|---|
| VI (z=0.25) | 1.69 | 1.21 | 1.00 | 0.78 |
| VR (z=0.25) | 0.74 | 0.46 | 0.42 | 0.31 |
| RI (z=0.25) | 0.95 | 0.75 | 0.58 | 0.47 |
| VI (z=0.30) | 2.00 | 1.28 | 1.08 | 0.81 |
| VR (z=0.30) | 0.87 | 0.53 | 0.48 | 0.35 |
| RI (z=0.30) | 1.13 | 0.775 | 0.60 | 0.46 |
| VI (z=0.40) | 2.22 | 1.43 | 1.24 | 0.87 |
| VR (z=0.40) | 1.13 | 0.66 | 0.60 | 0.43 |
| RI (z=0.40) | 1.09 | 0.77 | 0.64 | 0.44 |
| VI (z=0.45) | 2.33 | 1.55 | 1.34 | 0.97 |
| VR (z=0.45) | 1.12 | 0.73 | 0.64 | 0.49 |
| RI (z=0.45) | 1.21 | 0.82 | 0.70 | 0.47 |
Before we begin to discuss the morphological content of the PDCS clusters, we must first establish a common language by which we can compare our results to past and present work in the field e.g. the use of the early and late morphological types.
Our imaging data did not have the resolution necessary to allow us to assign galaxies a morphological type. We could, nevertheless, classify our galaxies in terms of their spectral energy distribution using our photometry and spectroscopy. Our first classification scheme separates galaxies into emission line and non-emission line objects. This classification relates well to the early/late morphological type classification (e.g. Biviano et al. 1997). However, in some cases early type galaxies, like SOs, can exhibit emission lines features in their spectra. In any case, Biviano et al. (1997) have shown that less than 4 of Elliptical or SO cluster galaxies have emission lines. This implies that our spectroscopically–determined ”late type galaxies” (see Fig. 4) are probably free from significant contamination by early type objects.
In other cases, some late type galaxy spectra do not have strong emission lines, however. Moreover, we used blocking filters to obtain the spectra of the COP galaxies (see Adami et al. 2000a) which significantly reduced the available spectral range. It is possible, therefore, that we missed emission line features due to this reduced spectral coverage. Our ”early type galaxies” bin may, therefore, be contaminated by late type objects.
The other classification scheme we used was based on the three-color information (V, R and I) we had for most of the galaxies in the sample (56 out of 74). Once the redshift was known, the spectral energy distribution was constrained and a rough classification between different spectral types was assigned. We used the Frei Gunn (1994) colors to classify our galaxies into 4 spectral types. Table 3 gives the VI, VR and RI colors from Frei Gunn (1994) for the 4 different morphological types we used and for the 4 redshifts of our composite clusters.
We matched the 3 colors of each object with this table. First, we transformed the VIPDCS, VRCOP and RIPDCS into the standard Johnson system used in Frei Gunn (1994). As in Postman et al. (1996) and Adami et al (2000a) we applied the following relations for the color transformations:
VI = 0.41+0.855(VIPDCS)+ 0.012(VIPDCS)2,
VR = 0.02+(VRCOP)0.056(VIPDCS)+ 0.012(VIPDCS)2, and
RI = 0.43+(RIPDCS)0.089(VIPDCS).
Each color will, in principle, correspond to a single color-type, but this did not always happen. We therefore developed a method of using the colors to uniquely determine the galaxy color-type. First, if all 3 independent color-type determinations derived by the colors did yield the same result, we selected that color-type. This occurred for 24 of the sample. Second, if 2 color-types among the 3 were identical, and if the third color-type was close to these two (for example, Im is close to Scd), we selected the two identical color-types (50 of the sample). Third, if 2 color-types among the 3 were identical, but if the third color-type was not close to these two ones (for example, Im is not close to Sbc) we again selected the two identical color-types (5 of the sample). Fourth, if the 3 color-types were different and close (for example, E, Sbc and Scd), we selected the mean color-type (14 of the sample). Finally, if the 3 color-types were different but not close (for example, E, Sbc and Im), we selected the color-type providing the lowest difference with the values of Table 3 (7 of the sample).
We have assumed that the bin of Frei Gunn (1994) was a mix of elliptical and SO galaxies, the bin was a mix of Sa, Sb and Sc galaxies, the bin was a mix of Sd and Sm galaxies and the bin contained only irregular galaxies.
This classification technique is similar to the one used in the CNOC survey (Carlberg et al. 1997), except that we used three colors instead of two, and we assigned a morphological type (called color-type hereafter) using the Frei Gunn (1994) templates. The classification estimates with the largest uncertainties are for the last two cases and they constitute only 21 of the sample. The main uncertainties in the color classification scheme came from the uncertainties in the magnitudes. Possible dust obscuration found, for example, in Cl0039+4713 (z=0.41: Smail et al. 1999) can lead to misclassifications, but we ignored this effect.
We also compare the predicted types of our two classification schemes. Overall, emission line galaxies should be mostly late type galaxies and absorption line galaxies should be mostly early type galaxies. The direct comparison shows that, on one hand, 100 of the emission line galaxies of our sample have a color-type later than Sbc (Sbc: 33, Scd:42, Im: 25). On the other hand, 14 of the non-emission line galaxies have a color-type later than Scd (e: 50, Sbc: 36, Scd:0, Im: 14). These percentages are well within our expectations (see above) and these results give strength to our classification schemes.
However, we must consider this color classification scheme (red galaxies: early types, blue galaxies: late types) only as an of the true morphological type. The spectral assignment is clearly not as reliable as the morphological types obtained, for example, via HST observations by Dressler et al. (1999) or Lubin et al. (1998). The morphology and the stellar content of a galaxy can be affected differently by various astrophysical processes and consequently the two tentative classifications by colors or spectral features described in this section must be considered only as an approximation of the morphological types. However, in order to compare our distant cluster with their local counterparts (ENACS) we needed to establish such a relation between spectral and morphological classifications.
2.5 Morphological type of the CNOC cluster galaxies
In order to relate the CNOC composite clusters with the rest of our sample (significantly increasing the number of galaxies), we decided to split the CNOC spectral classification into two bins that could be related to our previous classification. Hereafter, we refer to these subsamples as early and late type CNOC galaxies
We assigned the CNOC spectral types 1, 2 (elliptical galaxies) and 3 (E+A galaxies) to the early type class. These are mainly elliptical galaxies because the CNOC type 3 galaxies represent less than 2.5 of the sample. The CNOC types 4 and 5 are assumed to be late type galaxies. In order to compare with the ENACS data, we associated this late type bin to the bin Sc+Sd+Sm+Irr of Adami et al. (1998).
3 Evolution of the magnitude and morphological segregation
As shown in Adami et al. (1998), there exists both a magnitude and a morphological segregation of galaxies in nearby clusters that agrees with simple dynamical models of cluster formation and evolution. The bright galaxies have a lower velocity dispersion compared to the fainter ones. This variation is expected from energy equipartition in clusters. The elliptical galaxies have a lower velocity dispersion compared to the later morphological types in nearby clusters. The ratio of these dispersions between the elliptical and the late type spiral galaxies is consistent with a model where the late type spirals are currently falling into the cluster.
3.1 Magnitude segregation
We now compare the results of Adami et al. (1998) for nearby clusters with the results from the 3 distant composite clusters. We plot in Figures 1, 2 and 3 the variation of the normalized velocity dispersions versus the absolute magnitude for the 3 distant composite clusters. We made 4 bins of 17 distant galaxies for the PDCS composite cluster at z0.4 (Fig. 2), 5 bins of 17 galaxies for the CNOC composite cluster at z0.32 (Fig. 1) and 6 bins of 17 galaxies for the CNOC composite cluster at z0.48 (Fig. 3).
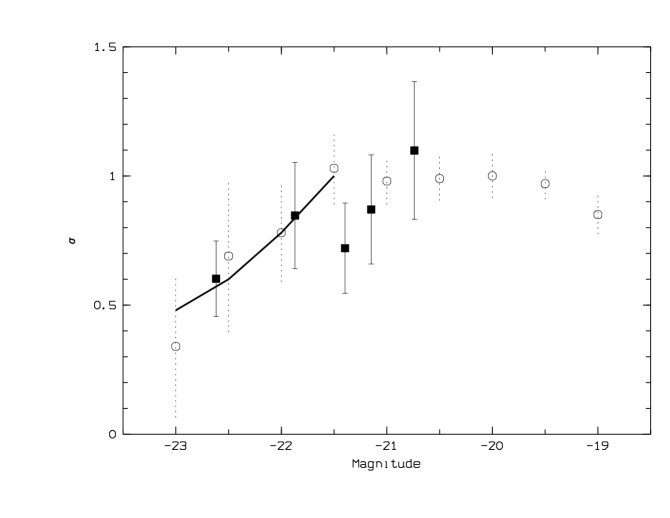
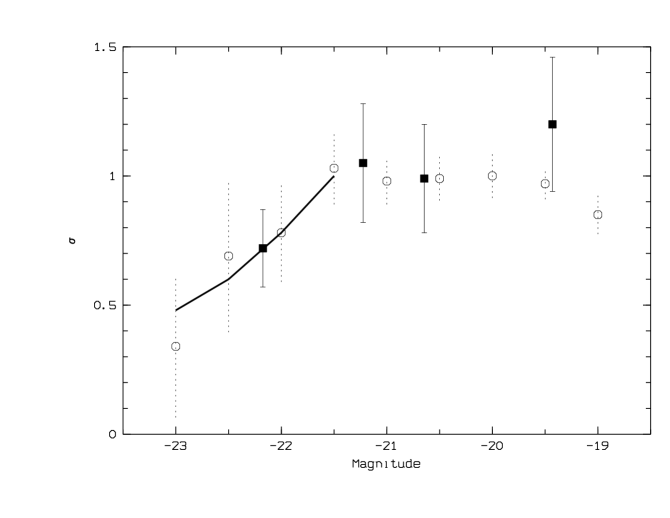
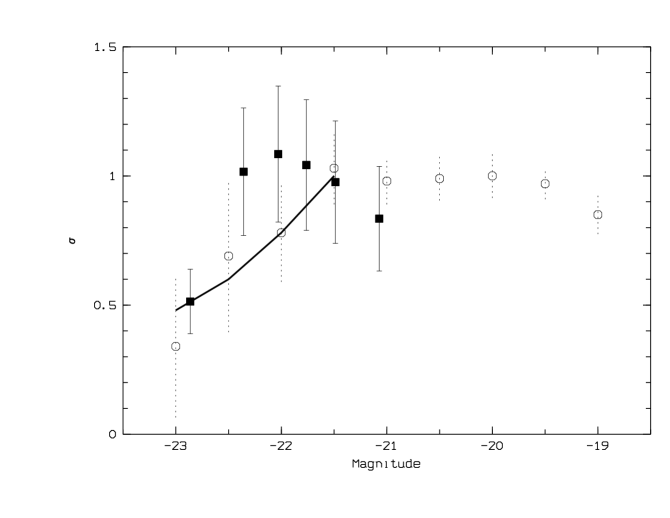
We transformed the VPDCS magnitudes into R magnitudes (VR1) to over plot the results for the PDCS composite cluster on the results for the nearby clusters (which used R magnitudes). We have not modified the values of the CNOC r magnitudes because according to Frei Gunn (1994), the correction between R and r magnitudes is less than 0.2 magnitudes. This uncertainty is negligible compared, for example, to the uncertainty in the VR value.
We have excluded galaxies whose velocities were 3- away from the mean in each bin for the z0.4 and z0.32 composite clusters. The figures show qualitatively the same results of Adami et al. (1998) superposed to each composite cluster. For the z0.32 and z0.4 composite clusters, the agreement is apparently good except for the faintest bin of the z0.4 composite cluster and the R-21.5 point of the z0.32 composite cluster (see the discussion section for an explanation of this peculiar value). For the z0.48 composite cluster, the R-22.3 and R-22 points seem to be higher than the corresponding z0.07 points as well as the energy equipartition prediction (thick solid line). The energy equipartition law (e.g. Adami et al. 1998: =100.2M with M the magnitude) has been normalized to R = 21.5 (+5log10(h)). The agreement with the low redshift data and the energy equipartition for this last composite cluster seems to be worse compared to the other two composite clusters at z0.32 and z0.4. However, taking into account the error bars, the differences are not very significant and we need to estimate quantitatively the level of agreement.
In order to find a way to quantify more efficiently the possible differences between the z0.07 results and the higher redshift distributions, we used a two dimensional Kolmogorov-Smirnov test (e.g. Press et al. 1992) in the normalized velocity dispersion-R magnitude phase space. We used all the individual values of each galaxy (without binning) in the magnitude interval R=[-23.;-19.5]. Each Kolmogorov-Smirnov test was run 1000 times (bootstrap resampling) to estimate the significance level. At the 10 level, we found no significant differences between the normalized velocity dispersion versus R magnitude for the z0.07, z0.32 and z0.4 composite clusters. However, the distribution of the z=0.48 cluster was found to be significantly different (even at 1 level) from the three lower redshift composite clusters.
The results show, therefore, a significant evolution of the magnitude segregation in the most distant composite cluster, but none for the z0.07, z0.32 and z0.4 composite clusters.
3.2 Morphological segregation
In this section, we also compared the variation of the versus the . Aa a first step, we do not consider the spatial distribution of the galaxies (see next Section).
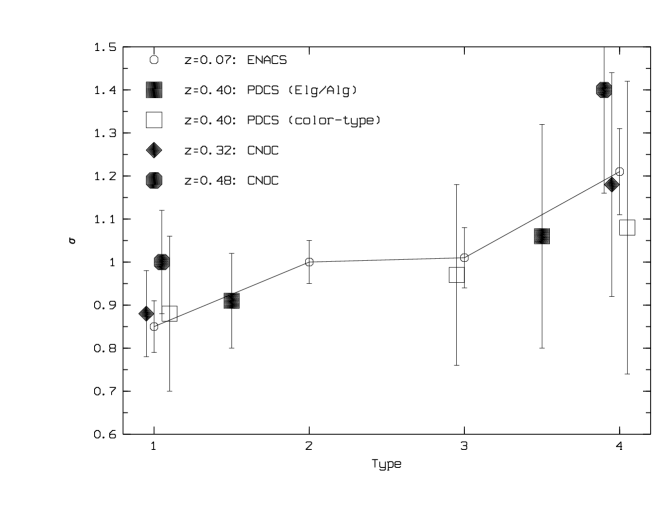
The types 1, 2, 3 and 4 of Fig. 4 were respectively assigned to the closest galaxy types: elliptical, SO, Sa+Sb and Sc+Sd+Sm+Irr. We stress that the error bars are too large to draw firm conclusions regarding the morphological segregations shown in Fig. 4. However, the variation of the mean values is still suggestive. We now comment on this.
For the z0.4 galaxy sample, we used both the emission line (large filled squares) and color (large empty squares) classifications to assign morphological types. We used the previously defined early and late spectral types for the z0.32 and z0.48 CNOC samples. The results are shown in Figure 4, together with the z0.07 results (small empty circles) of Adami et al. (1998). To plot these results on the same figure, we assumed that the z0.4 PDCS galaxies with:
–only absorption lines were an equal mix of elliptical and SO galaxies
–only emission lines were an equal mix of spiral and irregular galaxies
–a color-type equal to the type of Frei Gunn (1994) corresponded to type 1 of Adami et al. (1998)
–a color-type equal to the type of Frei Gunn (1994) corresponded to type 3 of Adami et al. (1998)
–a color-type equal to the + type of Frei Gunn (1994) corresponded to type 4 of Adami et al. (1998)
Further, we assumed that the CNOC galaxies which are classified as early types were Elliptical galaxies and that those classified as late types were type 4 of Adami et al. (1998)
The results were found to be qualitatively similar for the z0.07, z0.32 and z0.4 cluster galaxies. The trend shown is in agreement with the theoretical predictions. For example the ratio between the two z0.32 bins is close to the value predicted for a relaxed and an infalling galaxy population (see e.g. Adami et al. 1998). The ratio is also close to the value given in Carlberg et al. (1997).
The results for the z0.48 are, however, slightly different compared to the other redshifts. The ratio of is still observed. There seems to be a systematic shift towards higher values of the normalized velocity dispersions, however. These distant clusters could be dynamically younger compared to the other not so distant clusters.
3.3 Spatial distribution segregations
We now consider the spatial distribution of the galaxies with respect to their magnitude and spectral type.
| z bin/R | -22.75 | -22.5 | -22.25 | -22 | -21.75 | -21.5 | -21.25 | -21 | -20.75 | -20.5 |
|---|---|---|---|---|---|---|---|---|---|---|
| 0.32 | - | 0.69 | 0.65 | 0.83 | 0.98 | 0.98 | 0.95 | 0.98 | 0.98 | 0.99 |
| 0.40 | - | - | - | - | 0.25 | 0.65 | 0.95 | 0.95 | 0.95 | 0.91 |
| 0.48 | 0.79 | 0.94 | 0.99 | 0.99 | 0.99 | 0.99 | 0.99 | 0.99 | 0.99 | 0.99 |
We used a two dimensional Kolmogorov-Smirnov test based on the distance from the center versus normalized velocity dispersion phase space (d- phase space hereafter) to investigate the segregation as a function of spectral type and magnitude. In the z0.32, z0.4 and z0.48 composite clusters, we showed that the distribution of the early type is significantly different, at the 10 level, compared to the late type galaxies. This agrees with the results of Adami et al. (1998): early type galaxies in nearby clusters are more concentrated at the cluster center than late type galaxies.
We also investigated the spatial distribution of the different spectral types as a function of magnitude using a Kolmogorov-Smirnov test (with 1000 bootstrap resampling for each case). The results are given in Table 4. For the z0.32 cluster, we show that the distribution in the d- phase space of early type galaxies brighter than R-21.750.25 is significantly different at the 10 level compared to the distribution of late type galaxies. In the same time, there is no significant difference between late type and early type galaxies fainter than R-21.750.25. This means that only the bright early type galaxies are more concentrated at the center than the late type galaxies. Biviano et al. (2000) found a similar result in nearby clusters. For the z0.4 cluster, we found the same trend if we used the emission line / absorption line classification. This time, the segregation appears at magnitudes brighter than R-21.250.25. For the z0.48 cluster, however, the segregation starts to be significant at R-22.50.25, brighter than for the z0.32 and z0.4 clusters. Once again, the most distant composite cluster seems to be different form the less distant composite clusters. Only the very bright early type galaxies show a more concentrated distribution than the late type galaxies.
3.4 X-ray selected versus optically selected clusters
The COP clusters are while the CNOC clusters are selected. We now consider whether these different selection methods are responsible for the differences seen between the z0.48 composite cluster (X-ray selected) and the other composite clusters at lower redshift. For the magnitude and the spatial distribution segregations, these different selection methods did not seem to play a significant role because the z0.32 (X-ray selected) composite cluster exhibits the same characteristics as the z0.07 and z0.4 composite clusters (optically selected) and it was selected in the same way as the z0.48 composite cluster. In the case of the morphological segregations, this effect is not statistically significant. We, therefore, assume that our results do not depend on whether the clusters were X-ray or optically selected.
4 Discussion
We stress that our conclusions are strictly valid only for the clusters of our sample. However, these clusters are a fair sample of the general massive cluster population, and the results presented here can probably be generalized to other clusters.
4.1 How the clusters are evolving?
Based on our previous analyses we found no evidence for redshift evolution of the dynamical state in our cluster sample from z to z. We detected, however, significant evolution between the z and z composite clusters using a Kolmogorov-Smirnov test. We also find that the cluster galaxy content changes from z0.07, z0.32, z0.4 to z0.48. In the nearby sample of cluster galaxies of Adami et al. (1998: z0.07),
–the type ”1” galaxies (ellipticals) are 24 of the sample,
–the type ”2” (SO) are 49,
–the type ”3” (Sa+Sb) are 20 and
–the type ”4” (Sc+Sd+Sm+Irr) are only 7.
In the sample at z0.32,
–the early type galaxies are 78,
–the late type galaxies are 22 (type ”4”).
In the sample at z0.4,
–the redder galaxies (assumed to be ”1”+”2”: ellipticals + SO) are 44 of the sample (versus 24 + 49 for the nearby sample),
–the intermediate color galaxies (assumed to be type ”3”) are 38 and
–the bluer galaxies (type ”4”) are 18.
And finally, in the sample at z0.48,
–the early type galaxies are 70,
–the late type galaxies are 30 (type ”4”).
The percentages of late type galaxies are higher in the distant cluster samples. The estimate of the uncertainties in these percentages is not straightforward but we assumed the Section 2.4 maximum contamination of 21 (3-) in assigning spectral types when using colors in the z0.4 sample. To be conservative, we applied this to the relative percentages of red, intermediate and blue galaxies of our sample. The uncertainties on the numbers given in this paragraph are, therefore, based on a 7 uncertainty.
In other words, the distant cluster galaxies are statistically bluer (or present later types) than the nearby cluster galaxies. This is the ”classical” Butcher Oemler (1984) effect that already has been extensively reported in the literature. At even higher redshifts, Van Dokkum et al. (1999) found the same effect in the cluster MS1054-03 at z0.83. They showed clear evidences of further evolution of late type galaxies into early types (SO E).
In order to compare results free from possible bias in our classification for the z0.4 sample, we also compare the percentage of emission line galaxies in this sample (193) to the ENACS sample of nearby clusters (Biviano et al. 1997: 101), without using any color classification. We see that the emission line galaxy fraction increases by a factor of 2. In principle, our ability to measure redshifts for emission line galaxies is higher than that for absorption line galaxies, but this effect is canceled out by the short spectral ranges we used (see Adami et al. 2000a) which occasionally can lead to missed emission line features. The region ( Mpc) covered by the COP and ENACS surveys are similar (see Adami et al. 2000a and Adami et al. 1998), which is important as we discuss below.
The evolution in the galaxy content of the clusters in our sample between z0 and z0.48 seems to be real. It does not depend on the sample used to test it, whether it is selected according to their spectral features or to their colors. These results are consistent with the recent studies of Dressler et al. (1999) of z clusters. They find evolution of the morphological types of cluster galaxies.
The metric aperture used, however, plays a key role in determining the blue fraction: For example, the implied evolution of the blue fraction with redshift was not confirmed by Lubin et al. (1998) and Postman et al. (1998). They showed that the massive cluster 1604+4304 at z=0.84 has a morphological content similar to that of nearby clusters. But, these studies used images of the inner core of the cluster () which is significantly smaller than the area sampled in Adami et al. (1998), our comparison study. If we assume that the percentage of late type galaxies increases from the inner part to the outer parts of the clusters (e.g. Adami et al. 1998), then this is an explanation of the discrepancy between our results and the results of Lubin et al. (1998) and Postman et al. (1998). In order to check this point, we have computed the percentage of red, intermediate and blue galaxies in our z0.4 sample but in the same physical area as in Lubin et al. (1998): the core of the clusters. We found in this region, 65 red galaxies, 18 intermediate galaxies and 17 very blue galaxies. These percentages are in agreement with the work of Lubin et al. (1998). The choice of metric aperture is therefore important, and it could be an explanation for why the longer look–back time studies of Lubin and Postman did not yield evidence for evolution. It may be that at longer look back times (z0.8) other effects could lead to a relatively low blue galaxy fraction (see section 5).
The entire evolutionary process is complicated, however, and it probably also relates to the dynamical state of the clusters as well as its redshift. For example, Wang et al. (1997) showed a correlation between cluster ellipticity and blue galaxy fraction, and Metevier et al. (2000) showed that there exist nearby clusters that have bi-modal galaxy or X-ray distributions which have relatively high blue fractions and are yet at low () redshifts.
4.2 Morphological evolution versus dynamical evolution
When we compared the dynamical and the cluster content evolution of our composite clusters between z0.4 and z0.48, the situation is consistent: we both found ”younger” clusters and a ”younger” population at higher redshift. However, the composite clusters from z0.07 to z0.4 give the following puzzle: How did the cluster contents evolve in morphological type, while the clusters have not apparently evolved in terms of their dynamical state? We now examine this point.
The answer is, it is possible to have the bright galaxies virialize before changing morphological type. This would explain why our composite nearby and distant clusters have the same distribution of galaxies versus magnitude, but they do not have the same ratio of late to early type galaxies. We can see this by assuming that galaxies virialize via dynamical friction, which takes 0.1 Gyrs for the brightest galaxies for example in our sample and 1 to 1.5 Gyrs for the faintest galaxies (Sarazin, 1986). Yet, if galaxy-galaxy interactions cause the galaxies to change morphological type, the galaxies take about 1 Gyr to change (crossing time), and clearly the more massive (brighter) galaxies can reach a “relaxed state” before changing morphological type. Without additional assumptions, however, this scenario runs into a difficulty; namely, the time between and is about 4 Gyrs, and the nearby clusters should have virialized such that the dynamical state of the nearby and distant clusters should not be the same.
A way to deal with this is to assume that clusters are (not surprisingly) continually evolving (e.g. Ulmer et al 1992 and references therein). This scenario is clearly not new and has been investigated in details by authors such as Oemler (1974), Melnick Sargent (1977), Dressler (1980) or Whitmore Gilmore (1991). However, here, we have a unique case to check this scenario with homogeneously analyzed clusters from z0 to z0.5. Clusters are evolving being fed continuously by the in-fall of field galaxies and groups (or other clusters). The majority of the infalling field galaxies are late-type. The most recent episode of in-fall could have been such that the relative low mass late type galaxies in the outer regions have been able to evolve into early type galaxies (1 Gyr) while yet not virializing (1.5 Gyr). This leads to the nearby clusters having higher velocity dispersions in their outer portions while, at the same time, having relatively low fractions of late-type galaxies.
This hypothesis is consistent with finding a correlation with dynamical age and blue fraction (Wang et al. 1997). It is not completely clear how this hypothesis relates to finding nearby clusters which have bi-modal distributions and appear to have relatively large blue fraction (Metevier et al. 2000). In a high matter density Universe, however, the cluster formation occurs at late epochs (close to the present time) and a high density Universe could then leads to the production of dynamically young structures until relatively recent epochs.
If we assume the general picture of cluster evolution and formation, we can extrapolate this scenario back in time to place a lower limit on when clusters formed and also suggest what clusters should look like in terms of morphology and dynamical state if we are able to extend studies to redshifts up to . This is discussed in the next subsection.
4.3 Cluster formation epoch?
An interesting question to ask is: when did all these clusters form? This epoch depends strongly of the cosmological model (e.g. Oukbir Blanchard 1992 and 1997). In a high Universe, the clusters form later than in a low Universe, but they evolve faster. To adress this question, we can use the composite clusters of our sample from z0.07 to z0.4. These are already, at least partially, relaxed. We can then assume that the ”formation” process has occurred at an epoch earlier than z0.4. The clusters of the z0.48 sample have younger dynamical characteristics and we can assume that they are close to the of their ”first formation” process, which probably occured around z0.5. Now we have to estimate the time needed to form such a cluster to estimate the epoch of the of the formation process.
The surface covered by the clusters of our samples is a circle of about 1h-1 Mpc radius. The minimal time to form such a cluster is then less than 1 Gyear in a violent relaxation process (1 crossing time, see Sarazin 1986). Adding 1 Gyear to z0.5 gives the epoch of the beginning of the cluster formation, i.e. in a q0=0 Universe 7.2 Gyears (not significantly different from when we use low values of q0 but different from 0). We then conclude that the cluster formation process for the clusters of our sample began at z0.8.
Consistent with this hypothesis are the recent detections of clusters of galaxies at z0.8 (in addition to the two quoted in section 4.1: MS1054-03 and 1604+4304). Nichol et al. (1999) and Ebeling et al. (1999) report the discovery of an X-ray luminous cluster (RXJ0152) at z=0.83, Gioia et al. (1999) has also discovered a young X-ray luminous cluster at z=0.81 and Donahue et al. (1998) reported one at z=0.82. There is also the detection of an X-ray cluster (Rosati et al. 1999) at z=1.26 with a low X-ray luminosity. Nearly all these clusters at z0.8 have a disturbed X-ray shape (elongated and clumpy) and their nature (partially relaxed clusters or proto-clusters) is not clear yet. The formation epoch of these massive clusters of galaxies, though, was probably only slightly greater than z=0.8, which is consistent with our estimates of the minimum z of cluster formation. Selection effects may also have played a role in finding only distorded clusters (cf. Adami et al. 2000b), however, and the cluster formation may occur at even higher redshifts (cf. Rosati et al. 1999) for (at least) the low mass clusters.
5 Summary and conclusions
We have produced different composite clusters based on combining the results of 6 rich optically selected clusters with redshifts near 0.4, and 6 X-ray selected clusters with redshifts near 0.3 and 0.5. We compared these to a similar composite cluster at redshift 0.07. We have shown that in terms of brightness, type and radius versus velocity dispersion, the , and composite clusters are very similar (at least within the statistical limitations of the data) while the composite cluster is significantly different. We conclude from this work that the clusters of the sample have at least partially virialized by a redshift of 0.5 and that massive clusters (1015 solar masses) have formed at the very latest at z = 0.8. Our derived lower limit to the time of cluster formation epoch is consistent with work on finding massive clusters at z = 0.8 or higher.
We have confirmed that the more distant clusters of our sample contain more late-type galaxies that nearby clusters, as found many times before. At the same time, however, we have shown that the dynamical state of these clusters does not seem to evolve for the redshifts lower than 0.4. In order to explain this, to the extent that there are some bright blue galaxies in the core of the clusters, we hypothesize that these massive blue galaxies have virialized before changing morphological classification. This is not a large effect, however, as the cores of the clusters are mainly red (cf. Section 4.1). We must, therefore, conclude (at the level of statistics we have here) that it is primarily the outer regions of the clusters that contribute the relatively large blue fractions of distant clusters. Although the nearby clusters should have virialized completely, the outer portions of these clusters are not virialized and yet are dominated by red galaxies. Continuous in-fall of relatively numerous, low mass galaxies such that the galaxies have evolved into early type galaxies is just consistent with the time scales involved (1Gy for relaxation for low mass or faint galaxies and 1.5 Gy for virialization).
It is not clear what our proposed scenario predicts at greater look back times. One possibility is that early type galaxies formed first and formed the initial clusters (this hypothesis is, however, not supported by van Dokkum et al. 1999). Then the later type galaxies, having formed later in the field are just beginning to fall into the cluster and even the bright, massive ones have not yet fallen in. In this scenario, the cluster core will have a low blue fraction/low fraction of late type galaxies even at the bright end. This is approximately consistent with the finding of Wirth et al. (1994) on CL 0016+16 (albeit an X-ray luminous cluster) or of Butcher Oemler (1984) or as suggested by Lubin et al (1998) and Postman et al (1998) (see, however, section 4.1 regarding the Lubin et al. 1998 and Postman et al. 1998 results)
The detailed scenario we suggested to explain the results of our analysis and comparisons with a nearby optically selected sample should be considered only that, a suggestion. More elaborate theoretical work, that is beyond the scope of this paper, is necessary to develop the full range of possibilities. The statistics of the results we found here also clearly need to be improved by analyzing the data from more clusters with larger telescopes. What our discussion has showed is the power of the analysis we performed here, and how more analysis of systems coupled with an extension to even higher redshift systems will do much to clarify picture of how galaxy populations evolve within clusters.
Acknowledgements.
AC thanks the staff of the Dearborn Observatory for their hospitality during his postdoctoral fellowship. The authors thanks the CFHT TAC for support for the COP survey.References
- (1) Adami, C., Ulmer, M.P., Romer, A.K., et al. 2000b, ApJ, submitted
- (2) Adami, C., Holden, B.P., Castander, F., et al. 2000a, AJ, submitted
- (3) Adami, C., Biviano, A., Mazure, A. 1998, AA, 331, 439
- (4) Beers, T.C., Flynn, K., Gebhardt, K. 1990, AJ, 100, 32
- (5) Biviano, A., et al. 2000, AA, in preparation
- (6) Biviano, A., Katgert, P., Mazure, A., et al. 1997, AA, 321, 84
- (7) Bower, R.G., Castander, F.J., Ellis, R.S., Couch, W.J., Boehringer, H. 1997, MNRAS, 291, 353
- (8) Butcher, H., Oemler, A. 1984, ApJ, 285, 426
- (9) Carlberg, R.G., Yee, H.K.C., Ellingson, E., et al. 1997, ApJ, 476, 7
- (10) Couch, W.J., Ellis, R.S., MacLaren, I., Malin, D.F. 1991, MNRAS, 249, 606
- (11) van Dokkum, P.G., Franx, M., Fabricant, D., Kelson, D.D., Illingworth, G.D. 1999, ApJ, 520, L95
- (12) Donahue, M., Voit, G.M., Gioia, I.M., et al. 1998, ApJ, 502, 550
- (13) Dressler, A., Smail, I., et al. 1999, ApJS, 110, 213
- (14) Dressler, A. 1980, ApJ, 236, 351
- (15) Ebeling, H., Jones, L.R., Perlman, E., et al. 1999, ApJ, submitted astroph: 9905321
- (16) Frei, Z., Gunn, J.E. 1994, AJ, 108, 4
- (17) Gioia, I.M., Henry, J.P., Mullis, C.R., et al. 1999, AJ, 117, 2608
- (18) Gunn, J.E., Hoessel, J.G., Oke, J.B. 1986, ApJ, 306, 30
- (19) Holden, B.P., et al. 2000, AJ, submitted
- (20) Katgert, P., Mazure, A., Perea, J., et al. 1996, AA, 310, 8
- (21) Kent, S.M., Sargent, W.L.W. 1983, AJ, 88, 697
- (22) Lax, D. 1985, J. Am. Stat. Assoc., 80, 736
- (23) Lubin, L.M., Postman, M., Oke, J.B., et al. 1998, AJ, 116, 584
- (24) Mazure, A., Katgert, P., den Hartog, R., et al. 1996, AA, 310, 31
- (25) Melnick, J., Sargent, W.L.W. 1977, ApJ, 215, 401
- (26) Metevier, A., Romer, A.K., Ulmer, M.P. 2000, AJ, in press
- (27) Nichol, R.C., Romer, A.K., Holden, B.P., et al. 1999, ApJ, 521, 21
- (28) Oemler, A.Jr. 1974, ApJ, 194, 1
- (29) Oukbir, J., Blanchard, A. 1997, AA, 317, 1
- (30) Oukbir, J., Blanchard, A. 1992, AA, 262, L21
- (31) Postman, M., Lubin, L.M., Oke, J.B. 1998, AJ, 116, 560
- (32) Postman, M., Lubin, L.M., Gunn, J., et al. 1996, AJ, 11, 615
- (33) Press, W.H., Teukolsky, S.A., Vetterling, W.T., Flannery, B.P. 1992, Numerical Recipes: Second Edition
- (34) Rosati, P., Stanford, S.A., Eisenhardt, P.R., et al. 1999, AJ, 118, 76
- (35) Sarazin, C.L. 1986, Rev. Mod. Phys., 58, 1
- (36) Smail, I., Morrison, G., Gray, M.E., et al. 1999, ApJ, 525, 609
- (37) Stein, P. 1997, AA, 317, 670
- (38) Ulmer, M.P., Wirth, G.D., Kowalski, M.P. 1992, ApJ, 397, 430
- (39) Wang, Q.D., Ulmer, M.P., Lavery, R.J. 1997, MNRAS, 288, 702
- (40) Whitmore, B.C., Gilmore, D.M. 1991, ApJ, 367, 94
- (41) Wirth, G.D., Koo, D.C., Kron, R.G., 1994, ApJ, 435, L105
- (42) Yee, H.K.C., Ellingson, E., Abraham, R., et al. 1996, ApJS, 102, 289