Submitted to Monthly Notices
The Real Space Power Spectrum of the PSCz Survey from 0.01 to 300 Mpc-1
Abstract
We report a measurement of the real space (not redshift space) power spectrum of galaxies over four and a half decades of wavenumber, to , from the IRAS Point Source Catalog Redshift Survey (PSCz). Since estimates of power are highly correlated in the nonlinear regime, we also report results for the prewhitened power spectrum, which is less correlated. The inferred bias between optically-selected APM and IRAS-selected PSCz galaxies is about at linear scales , increasing to about at nonlinear scales . The nonlinear power spectrum of PSCz shows a near power-law behaviour to the smallest scales measured, with possible mild upward curvature in the broad vicinity of . Contrary to the prediction of unbiased Dark Matter models, there is no prominent inflection at the linear-nonlinear transition scale, and no turnover at the transition to the virialized regime. The nonlinear power spectrum of PSCz requires scale-dependent bias: all Dark Matter models without scale-dependent bias are ruled out with high confidence.
keywords:
cosmology – large-scale structure of Universe1 Introduction
The power spectrum of galaxies can set powerful constraints on cosmological parameters (Eisenstein, Hu & Tegmark 1988; Tegmark, Zaldarriaga & Hamilton 2001). But while the cleanest information lies at large, linear scales, most of the data is at smaller, nonlinear scales. Potentially, there is much to be gained by pushing to smaller scales.
The galaxy power spectrum is complicated by nonlinearity, redshift distortions, and galaxy-to-mass bias. Even without bias, nonlinear redshift distortions pose a problem. Whereas linear redshift distortions are well understood (Kaiser 1987; Hamilton 1998), nonlinear redshift distortions are not (Hatton & Cole 1997, 1999). Nonlinear redshift distortions are of considerable interest in their own right (Kepner, Summers & Strauss 1997; Davis, Miller & White 1997; Jing, Mo & Börner 1998; Strauss, Ostriker & Cen 1998; Landy, Szalay & Broadhurst 1998; Baker et al. 2000), but they muddy interpretation of the power spectrum observed in redshift space.
Fortunately, the effect of redshift distortions, linear or nonlinear, biased or not, can be practically eliminated. Because redshift distortions displace galaxies only in the radial direction, the power spectrum in directions transverse to the line-of-sight is unaffected by redshift distortions. The fact that the angular clustering of galaxies is unaffected by redshift distortions has been used by many authors to deduce the real space correlation function or power spectrum (Groth & Peebles 1977; Davis & Peebles 1983; Saunders, Rowan-Robinson & Lawrence 1992; Fisher et al. 1994a; Loveday et al. 1995; Baugh 1996; Gaztañaga & Baugh 1998; Ratcliffe et al. 1998; Jing, Mo & Börner 1998; Guzzo et al. 2000; Dodelson & Gaztañaga 2000; Eisenstein & Zaldarriaga 2001).
While large angular surveys, such as the Automatic Plate Measuring survey (APM) (Maddox et al. 1990a,b, 1996), or the Edinburgh/Durham Southern Galaxy Catalogue (EDSGC) (Nichol, Collins & Lumsden 2001), might seem to offer the most natural data sets for measuring the real space power spectrum, redshift surveys contain additional information – the redshifts of galaxies – that can be exploited to great effect. That is, even if the redshift of a galaxy does not determine its precise distance, it nevertheless constrains that distance within narrow limits. The additional redshift information allows the real space power spectrum to be measured from a redshift survey with accuracy comparable to that from an angular survey many times larger (§3.2).
The goal of the present paper is to measure the real space power spectrum of the recently published IRAS Point Source Catalog Redshift Survey (PSCz) (Saunders et al. 2000). Large volume and careful attention to uniformity of selection make the PSCz the finest publicly available redshift survey for this purpose.
2 Analysis – Linear Regime
At linear scales, , we adopt the real space power spectrum of the PSCz survey measured by Hamilton, Tegmark & Padmanabhan (2000, hereafter HTP). This measurement assumes that density fluctuations are Gaussian, and that redshift distortions conform to the linear model (Kaiser 1987). The linear measurement yields three separate power spectra, the galaxy-galaxy, galaxy-velocity, and velocity-velocity power spectra. In the present paper we use only the galaxy-galaxy power spectrum, which is the real space power spectrum, redshift distortions having been isolated into the other two power spectra.
The linear measurement can lay claim to being optimal when the prior assumptions are true, but it becomes suboptimal, and eventually fails, at nonlinear scales. This is not merely because the linear model of redshift distortions fails, as of course it does, nonlinear redshift distortions being dominated by fingers-of-god, not by coherent infall toward large scale overdensities. More fundamentally, the assumption of Gaussian density fluctuations fails. In particular, the linear measurement seriously underestimates the variance of power in the nonlinear regime, by a factor , where is the correlation function.
Thus an entirely different strategy is called for at nonlinear scales.
3 Analysis – Nonlinear Regime
At nonlinear scales, , a major simplifying assumption can be made, that redshift distortions are plane-parallel (the ‘distant observer’ approximation). The plane-parallel approximation fails at large scales, so the nonlinear method breaks down at linear scales, just as the linear method breaks down at nonlinear scales.
3.1 Real power is transverse power
In the plane-parallel approximation, the redshift space power spectrum (the superscript denotes quantities in redshift space) at wavenumbers and perpendicular and parallel to the line-of-sight is the Fourier transform of the redshift space correlation function at redshift separations and perpendicular and parallel to the line-of-sight:
| (1) |
Redshift distortions affect only separations in the line-of-sight direction. Equation (1) shows that the redshift power spectrum in the transverse direction, where , involves an integral of the redshift space correlation function over the line-of-sight separation . Since redshift distortions displace galaxies along the line-of-sight, but neither create nor destroy them, the integral along the line-of-sight is left unchanged by redshift distortions. It follows that the redshift space power spectrum in the transverse direction is equal to the real space power spectrum
| (2) |
Thus the problem of measuring the real space power spectrum reduces to that of measuring the redshift space power spectrum in the transverse direction.
Figure 1 shows a contour plot of the redshift space power spectrum of PSCz. The redshift power shown in Figure 1 is measured from the harmonics of the redshift space power spectrum, as explained in detail in the remainder of this Section. The nonlinear real space power spectrum reported in this paper is equal to the redshift space power spectrum along the transverse axis in Figure 1.
3.2 Information from galaxy redshifts
Measuring real power from the redshift power at exactly , as specified by equation (2), is liable to lead to a rather noisy estimate. A more precise estimate of real power could be obtained by ‘averaging’ (in some sense) the values of redshift power in some interval about .
Using redshift power at is equivalent to exploiting information from galaxy redshifts. Suppose that velocity dispersion (or perhaps some other influence) causes galaxy distances to be known only to an accuracy of . Then the observed redshift power spectrum is the true power spectrum multiplied by a window that looks like a 2-dimensional sheet transverse to the line-of-sight, a horizontal ridge of width about . It follows that redshift power within of provides potentially useful information about real power.
If redshift information were discarded, then the uncertainty in galaxy distances would increase to the depth of the survey, and the window through which the power spectrum is observed would thin to .
Thus with galaxy redshifts there is times as much exploitable -space as without. In the PSCz survey, the central two quartiles in depth, containing half the galaxies, run from to . The effective uncertainty in the distance of a galaxy without a redshift can be taken to be half this, . The velocity dispersion is . Thus PSCz with redshifts is in a sense comparable to a no-redshift survey some times larger. The errors on the real space power spectrum of PSCz with redshifts might be expected to be roughly times smaller than PSCz without redshifts. Evidently the gain in having redshift information may be considerable.
3.3 Distance indicator versus true distance
It is worth pointing out an important distinctive feature of a redshift survey versus an angular or photometric survey. In a redshift survey, the relation between the distance indicator – the redshift distance – and the true distance is independent of depth (at least to the extent that cosmological evolution of the power spectrum can be neglected). In an angular or photometric survey, by contrast, the relation between distance indicator – apparent brightness in the angular survey, or photometric distance in the photometric survey – depends on depth.
The existence of a well-defined redshift space power spectrum , as in equation (1), depends implicitly on the assumption that the relation between redshift distance and true distance is independent of depth.
3.4 Angular mask and selection function
We adopt the same angular mask and selection function as HTP. The angular mask is the high-latitude mask of Saunders et al. (2000) (hibpsczmask.dat, part of the PSCz package), which leaves unmasked , or of the sky. Measurement of the selection function is discussed below in Section 3.12. The angular and radial cuts leave galaxies in the survey.
3.5 Approximating nonlinear redshift distortions by a finite sum of harmonics
To exploit redshift information to best advantage, it is necessary to have some model of nonlinear redshift distortions. Since accurate a priori models of nonlinear redshift distortions are not available (Hatton & Cole 1997, 1999) – especially if nonlinear galaxy-to-mass bias is taken into account – we resort to a semi-empirical approach, motivated by a combination of theory and observation. Our adopted solution is to measure the harmonics of the redshift power spectrum, and to assume that nonlinear redshift distortions can be approximated by retaining only a finite number of harmonics, the number of harmonics retained depending on . The procedure is analogous to the familiar one of smoothing an image by eliminating high frequencies in Fourier space.
It is convenient to introduce the function defined to be the ratio of redshift to real space power spectra (cf. Landy, Szalay & Broadhurst 1998)
| (3) |
By construction, this ratio is unity in directions transverse to the line-of-sight, .
Figure 2 shows a contour plot of the ratio measured from the PSCz survey. Naturally this plot represents our final, best measurement; however, preliminary versions of this plot contributed to the decision about the best way to measure it. The final version of the plot is consistent with the preliminary versions; tweaking caused only minor adjustments in the contours, with no significant systematic shifts.
In the linear regime, is given by Kaiser’s (1987) famous formula for plane-parallel redshift distortions
| (4) |
where is the cosine of the angle between the wavevector and the line-of-sight. Here is a fourth order even polynomial in .
In Eulerian second order perturbation theory, becomes an eighth order even polynomial in , with coefficients that depend on the absolute value of the wavenumber (Scoccimarro, Couchman & Frieman 1999).
The precise behaviour of in the nonlinear regime is unknown. A simple and widely used empirical approximation is to assume that the redshift correlation function equals the real correlation function modulated by a random pairwise velocity distribution that is independent of pair separation (note that has units of velocity: )
| (5) |
Most commonly, the 1-dimensional pairwise velocity distribution is taken to be an exponential
| (6) |
with 1-dimensional pairwise velocity dispersion . The exponential pairwise velocity distribution was first proposed by Peebles (1976), and has continued to receive support from observations (Davis & Peebles 1983, CfA1; Fisher et al. 1994b, 1.2 Jy survey; Marzke et al. 1995, CfA2 + SSRS2; Landy, Szalay & Broadhurst 1998, LCRS; Jing, Mo & Börner 1998, LCRS) from -body experiments (Fisher et al. 1994b, Fig. 5; Zurek et al. 1994, Fig. 7), and from theoretical arguments (Sheth 1996; Diaferio & Geller 1996; Seto & Yokoyama 1998; Juszkiewicz, Fisher & Szapudi 1998).
If the pairwise velocity distribution were indeed independent of scale, then in equation (3) would equal the 1-dimensional Fourier transform of
| (7) |
a function only of . For the exponential pairwise velocity distribution, equation (6), would be a Lorentzian
| (8) |
Equation (8) is a specific example of the general expectation that in the nonlinear regime should be a smooth function, peaked at , with width .
Figure 2 shows that in reality the pairwise velocity dispersion is not independent of scale. Rather, the velocity dispersion reaches a maximum at (where the contours of crowd the horizontal axis most closely), and decreases to smaller scales (larger ). This decrease in velocity dispersion to smaller scales is qualitatively (though not necessarily quantitatively) consistent with the expectation from the virial theorem that (Davis & Peebles 1977; Peebles 1980, §75), which with (as found in §4) would predict .
Jing & Börner (2001) find in -body simulations of CDM variants that falls somewhat faster than the Lorentzian model, equation (8), at large . They find that a better fit is
| (9) |
with a function of , and a fitting parameter.
The above examples suggest the idea of approximating as an even order polynomial in , or equivalently as a finite sum of even harmonics,
| (10) |
where denotes a Legendre polynomial, with maximum harmonic depending on wavenumber . Of course the Lorentzian example, equation (8), is not a finite polynomial (nor even a convergent Taylor series, if ); but evidently it could be approximated as such. The principal advantages of the description in terms of harmonics are (1) its flexibility, and (2) fitting to a linear combination of even harmonics (i.e. a polynomial in ) is far easier than nonlinear fitting to, for example, a rational function of .
A key question is how many harmonics to include in the sum (10). Too many harmonics will yield an unnecessarily noisy estimate; too few harmonics will fail to resolve the hill at , and will tend to bias the measurement low.
At linear scales, the maximum harmonic should be , in accordance with Kaiser’s formula (4). At nonlinear scales, it is necessary to resolve radial wavenumbers comparable to the inverse pairwise velocity dispersion, , in accordance with the arguments in Section 3.2. Harmonics up to can resolve angles , hence radial wavenumbers . Thus resolving requires harmonics up to
| (11) |
If the velocity dispersion is , then equation (11) suggests at . The linear and nonlinear estimates together thus suggest, provisionally,
| (12) |
with measured in .
The maximum harmonic specified by equation (12) was our original choice, and we carried out a complete set of measurements with it. The preliminary measurements indicated that redshift power was possibly slightly under-resolved at , but over-resolved at large . This can be seen in Figure 2, which shows that the ridge of redshift power along the transverse axis reaches its narrowest point at , where , but broadens out at larger . The velocity dispersion is thus comparable to at , but is smaller at large . Consequently the maximum harmonic of equation (12), which provisionally presumed that , is about right at but unnecessarily large at large . On the basis of the preliminary measurements, we revised the choice of maximum harmonic to (the nearest even integer to)
| (13) |
again with measured in . The revised choice of maximum harmonic is slightly larger than the provisional choice at (so as to be on the safe side), but smaller at large . The milder increase of maximum harmonic with wavenumber, instead of of equation (12), reflects not only the fact that the velocity dispersion decreases at larger , as seen in Figure 2, but also that the statistical uncertainties increase at larger . More harmonics means smaller systematic bias, but larger statistical uncertainty. The choice (13) is intended to make the statistical error as small as possible while ensuring that the systematic bias is small compared to the statistical error. Note that the nonlinear measurements are limited to , and that equation (13) gives at the smallest wavenumber of the nonlinear range, .
Equation (13) is our adopted final choice of maximum harmonic . For other reasons, to be discussed in Section 3.7, we also limit the maximum harmonic to
| (14) |
Numerical experiment, reported in Section 4.3, indicates that the maximum harmonic specified by equations (13) and (14) is large enough that any bias caused by using too few harmonics is small compared to the statistical uncertainty. In practice, the measured power spectrum proves satisfyingly robust against changes in the choice of maximum harmonic, the changes being typically some fraction of , and random rather than systematic.
3.6 Measuring harmonics of band-powers
We measure harmonics of band-powers of the redshift space power spectrum using essentially the same procedure as Hamilton (1995, 1998; hereafter H95, H98), which is a slightly refined version of the method of Hamilton (1992, 1993; hereafter H92, H93).
A feature of this analysis is that, although it is the power spectrum that is being measured, all the calculations are done in real (redshift) space rather than in Fourier space. In measuring redshift distortions, it is important to disentangle the true distortion from the artificial distortion introduced by a non-uniform survey window. In real (redshift) space, the observed galaxy density is the product of the true density and the selection function. In Fourier (redshift) space, this product becomes a convolution. Thus the natural place to ‘deconvolve’ observations from the selection function is real space, where deconvolution reduces to division, and where the observations exist in the first place.
Let denote the ’th harmonic of the redshift power spectrum folded through some band-power window (the tildes distinguish band-powers and their characteristic wavenumbers from the raw power spectrum ; tildes are tacitly dropped in the Results Section 4, even though the powers reported there are in fact band-powers):
| (15) |
The band-power windows will be chosen momentarily (§3.7) to be strictly positive functions narrowly peaked about a central wavenumber , but for the moment equation (15) is entirely general. The band-power , equation (15), can be expressed as an integral over the redshift space correlation function (H98, §5.2)
| (16) |
where is a spherical Bessel transform of :
| (17) |
Equation (16) is the basic equation that allows galaxy pair counts to be converted directly into band-powers.
The redshift correlation function at separation and cosine angle to the line of sight is estimated by the H93 estimator (the hat on in eq. 18 is a reminder that it is an estimate, not the true value)
| (18) |
where, following the conventional notation of the literature, signifies data, and signifies random background points (although in practice all the background integrals here were done as integrals, not as Monte-Carlo integrals). The angle brackets in equation (18) represent FKP-weighted (see §3.10) averages over pairs at separation and . The line of sight is defined separately for each pair as the angular bisector of the pair. To allow for IRAS’s angular resolution, only pairs further apart than are retained (see §4.2 for further discussion of this important effect), and to ensure the validity of the plane-parallel approximation, only pairs closer than on the sky are retained. Poisson sampling noise is removed by excluding self-pairs (pairs consisting of a galaxy and itself).
We continue the tradition of H92–H98 in computing the angular part of the pair integrals and analytically (H93, Appendix), which leaves a single numerical integral over the radial direction. The procedure is faster and more accurate than Monte Carlo methods, and eliminates the artificial problem of shot noise in the background counts. We also continue the tradition of H92–H98 in explicitly subtracting the shot noise contribution to that comes from the same galaxy contributing to in both factors of (§2c of H93), eliminating the small bias that arises if that contribution is not subtracted.
3.7 Band-power windows
The resolution with which the power spectrum can be measured is limited by the characteristic size of the survey to . At linear scales this size, and indeed the detailed shape of the survey volume, plays an essential role in constructing band-power windows, but at nonlinear scales there is greater freedom to choose band-power windows more arbitrarily.
Following H95, H98, we adopt band-power windows that are power laws times a Gaussian, , suitably scaled and normalized (see eq. 19 below). The advantages of this choice are: (1) the band-power windows are strictly positive, preserving the intrinsic positivity of the power spectrum; (2) they vanish at zero wavenumber (provided that ), so immunizing the measurement of power against uncertainty in the mean density (which makes a delta-function contribution to power at zero wavenumber); (3) they are analytically convenient; (4) they yield Gaussian convergence as a function of pair separation in the corresponding real space windows , equation (20), for harmonics , provided that is chosen to be an even integer.
Amusingly, a power law times Gaussian, , is the lowest energy eigenstate of a three-dimensional simple harmonic oscillator with angular momentum . Thus there is a least-squares sense in which the band-power window yields a measurement of the ’th harmonic of the power spectrum at the smallest possible wavenumber with the smallest possible pair separations (Tegmark 1995).
As a compromise between resolution and the size of error bars (higher resolution means larger error bars), we choose band-powers uniformly spaced at , the same resolution adopted by HTP in the linear regime. The resolution of the band-power windows , equation (19), increases with the exponent , the full width at half maximum (fwhm) going approximately as . We choose , which has a fwhm of , slightly wider than the adopted band-power spacing of .
The maximum measurable harmonic at is , which explains the limit (14). We also measured band-powers with exponents = = , whose fwhm is that of the band-powers, and for = = , whose fwhm is that of the band-powers. Since the higher resolution measurements were consistent with the lower resolution measurement (see §4.5), with little sign of any systematic offset caused by insufficient resolution, we choose to report as standard the result from the lower resolution measurement, which has slightly smaller error bars (after the higher resolution measurements are rebinned in to the lower resolution).
Suitably scaled, and normalized so = , the band-power windows are
| (19) |
The constant is chosen so that the band power window is centred at . Following H95, H98, we choose the constant / so that the smoothed monopole power at wavenumber is equal to the unsmoothed monopole power at the same wavenumber, , for the particular case where the power spectrum is a power law (corresponding to ) of index , that is, for . For the case in the window (19), this fixes .
The harmonics of the redshift power spectrum folded through the window (19) are, according to equation (16), equal to the harmonics of the redshift correlation function folded through the corresponding windows given by equation (17):
| (20) |
(note that ) where are Laguerre polynomials (Abramowitz & Stegun 1964) and = / is a Pochhammer symbol.
Figure 3 illustrates both the Fourier band-power window , equation (19), and a selection of its real space counterparts , equation (20), for the case . The Figure illustrates that measuring higher harmonics of power requires finer resolution in Fourier space, hence wider separations in real space. At small separations , the real space windows alternate between being positive or negative, as is even or odd, thanks to the factor in equation (20).
One of the features of the band-power window is that it vanishes at . It follows that any constant contribution to the correlation function , equivalent to a delta-function contribution to power at , vanishes when folded through the windows given by equation (20). Thus in estimating by equation (16), the factor in the integrand can be replaced by : it is unnecessary to subtract the part of the estimator of equation (18).
3.8 Covariance matrix
Reliable error bars on a measurement are as important as the measurement itself. Indeed, if precise comparison to theoretical models is to be made, then a full covariance matrix is essential (Eisenstein & Zaldarriaga 2001; Tegmark et al. 2001).
There are essentially three ways to determine uncertainties, differing in how much prior information they invoke.
The ideal situation is to know a priori what the covariance matrix is, or to know its form as a function of a modest number of parameters. Precisely this situation obtains for Gaussian fluctuations in the linear regime. Unfortunately, notwithstanding valuable progress (Scoccimarro & Frieman 1999; Szapudi, Colombi & Bernardeau 1999) the covariance matrix of nonlinear power is not accurately known (in either real or redshift space), and indeed the simplest model, based on the hierarchical model with constant hierarchical amplitudes, is known to be inconsistent, because it violates the Schwarz inequality (Scoccimarro, Zaldarriaga & Hui 1999; Hamilton 2000).
A second commonly used strategy is to estimate the covariance from the scatter in measurements from ensembles of mock catalogues constructed from -body simulations to resemble the survey as closely as possible (e.g. Fisher et al. 1993; Cole et al. 1998).
A third alternative is to measure the covariance directly from the level of fluctuations observed in the survey itself (H93; Szapudi 2000), and here we follow this latter approach. The approach takes full account of the correlated character of the fluctuations in a survey. Although the method is expected to break down at scales approaching the size of the survey, it should work fine at the nonlinear scales addressed here.
H93’s method for measuring covariance works in essence as follows (see §4 of H93 for intricate details). Let be a quadratic estimator, some integral of products of pairs of galaxy densities. For example, could be an estimate of , the ’th harmonic of some band-power in redshift space, equation (16). Divide the survey into a reasonably large number of subvolumes. Here we choose 22 angular regions, as shown in the inset to Figure 4, times 10 radial shells, each 0.2 dex wide, covering radial depths from to (i.e. 4.2 to ). Imagine attaching a weight to each of these subvolumes. As each of these weights is varied, the estimated value changes. Note that the estimator is being supposed subject to an overall normalization condition such that it remains an unbiased estimate of the thing being estimated, as the weights are varied; in other words, only the relative weights really matter. Define the fluctuation in attributable to subvolume by
| (21) |
where the important factor arises because depends quadratically on galaxy density. Then (H93) the variance of is given by a sum over pairs of subvolumes
| (22) |
The fluctuations are subject to a ‘pair-integral constraint’ that their sum over all subvolumes should be zero, . This follows from the fact that changing all the weights by the same constant factor leaves the estimate unchanged. If all pairs of subvolumes were included in the sum on the right hand side of equation (22), then the variance would be zero, because of the integral constraint . Consider instead including in the sum only pairs of subvolumes closer than some given separation. Characteristically, as this maximum separation between subvolumes increases, the sum on the right hand side of equation (22) increases, reaches a maximum, and then declines to exactly zero when all pairs of subvolumes are included. We follow H93’s proposal of approximating the variance by its maximum value attained as the maximum separation between subvolumes is increased. This approximation reflects on the one hand the idea that it is nearby regions that are most correlated, and on the other hand the desire to include as much of the correlation between nearby regions as possible.
As discussed by H93, the pair-integral constraint means that the variance is inevitably underestimated at scales approaching the size of the survey. However, this effect should be minor at the nonlinear scales addressed here. Conversely, there may be some tendency to overestimate the variance because noise is liable to make the measured maximum in the variance fluctuate above the true maximum.
The covariance between and another any quadratic estimator is given by a generalization of equation (22),
| (23) |
Again, if all pairs of subvolumes were included in the sum on the right hand side of equation (23), then the covariance would be zero, because of the integral constraint . In this case the strategy of approximating the covariance by the maximum value attained, as pairs of greater and greater separation are included in the sum, fails. The strategy fails partly because covariances need not be positive, and partly because choosing covariances to be large is not necessarily a conservative approach – whereas increasing variances always reduces information content, increasing covariances can actually increase information content, because two highly correlated quantities contain information about each other.
Here we estimate the covariance as the average of the sums evaluated at the two places where the variances and reach a maximum.
3.9 Prewhitened power
The term ‘prewhitening’ comes from signal-processing, and refers to the operation of transforming a signal in such a way that the noise becomes white, or constant (Blackman & Tukey 1959, §11). The notion of prewhitening the power spectrum of galaxies as a means of narrowing the covariance of estimates of power at nonlinear scales was proposed by Hamilton (2000, hereafter H00). Whereas at linear scales the covariance of estimates of power is (nearly) diagonal, at nonlinear scales the covariance of estimates of power is broadly correlated over different wavenumbers, as emphasized by Meiksin & White (1999) and Scoccimarro, Zaldarriaga & Hui (1999), and as illustrated in Section 4.7 of the present paper.
H00 showed empirically that prewhitening the power spectrum narrowed the covariance of power in a broad range of models. As will be seen in Section 4.7, the measured covariance of prewhitened power in PSCz is indeed narrower than the covariance of power itself.
The prewhitened power spectrum is defined to be the Fourier transform, , of the prewhitened correlation function defined by (H00, §5.1)
| (24) |
Differentiating equation (24) gives, to lowest order,
| (25) |
so that the covariance of estimates of the prewhitened correlation function is (for small errors)
| (26) | |||||||
(note that , if is an unbiased estimator). Since the shot noise contribution to , i.e. the contribution that comes from the covariance between a pair of galaxies and itself, is in real space a diagonal matrix proportional to (H00, eq. 38), it follows that the prewhitened covariance, equation (26), has the property that the shot noise contribution to is proportional to the unit matrix.
The covariance of estimates of prewhitened power is given by the Fourier transform of equation (26),
| (27) |
where is the Fourier transform of the matrix which in real space is diagonal with diagonal entries . The shot noise (self-pair) contribution to is again proportional to the unit matrix, since the unit matrix remains the unit matrix in any representation.
Some numerical issues concerning prewhitening are discussed in §4.2 of H00, and as an aid to the reader, Appendix A contains practical instructions on how to prewhiten a power spectrum numerically.
One slightly subtle issue is that the power spectrum is estimated in discrete band-powers, not as a continuous function of wavenumber. Our policy is to adhere to the definition (24) of the prewhitened correlation function
| (28) |
with in both numerator and denominator being understood to be band-estimates, Fourier transforms of the band-powers.
3.10 FKP weightings
In a seminal paper, Feldman, Kaiser & Peacock (1994, hereafter FKP) showed that at wavelengths large enough to be Gaussian, but still small compared to the scale of the survey, the optimal weighting of pairs of volume elements for measuring the power spectrum at wavenumber is
| (29) |
The FKP weighting goes over to equal weighting of volumes where the selection function is large, and equal weighting of galaxies where the selection function is small, which makes physical sense.
The FKP weighting is often referred to as ‘minimum variance’ (or more cautiously, ‘near minimum variance’), yet the range of scales over which it is strictly valid is limited (even non-existent). Of course it is commonly, and correctly, argued in defense of the more general use of the FKP weighting that because the variance changes quadratically about its minimum, a near minimum variance weighting should give a result not much worse than the true minimum variance.
The simplicity of the FKP weighting, equation (29), springs from the fact that, for Gaussian fluctuations, the covariance matrix of estimates of power (including the shot noise contribution) is diagonal (for Gaussian fluctuations, at wavelengths small compared to the survey). Thus the inverse covariance matrix, which determines the optimal weighting of pairs, is similarly diagonal. The eigenvalues of the inverse covariance constitute the FKP weights, equation (29). By contrast, the covariance of estimates of the correlation function , for example, is not diagonal, and the optimal weighting of pairs is, strictly, a complicated matrix.
At nonlinear scales the covariance of power ceases to be diagonal, and the FKP weighting ceases to be optimal. However, H00 showed that a weighting similar to the FKP weighting is valid for the prewhitened power spectrum (§3.9) to the extent that the covariance of prewhitened power is indeed (nearly) diagonal. The more general weighting differs from FKP in that in the denominator of the weighting is replaced by an ‘FKP constant’ , whose value is model-dependent, but of order – times the (unprewhitened) power (H00, Fig. 11):
| (30) |
The strategy of the present paper is to measure band-powers using FKP weightings, equation (30), with 5 values of the FKP constant, , , , , and , and then (cautiously) compress (§3.11) the 5 measurements into a single best estimate of the band-power.
In accordance with the above arguments, we compress not the band-powers themselves, but rather the prewhitened band-powers. In other words, to form the best estimate of the band-power, we first first prewhiten (§3.9) the 5 FKP-weighted estimates, which we then combine into a best estimate of prewhitened power, which we then unprewhiten.
Why choose 5 particular values of the FKP constant, rather than follow H00 and adopt, at each wavenumber , a single FKP constant equal to – times the power ? The reasons are both practical and philosophical. The practical reason is as follows. We wish to make an estimate of the prewhitened power in which the estimate in the denominator of equation (28) is the same as the in the numerator, at every separation . But the best choice of FKP constant varies with , which has the consequence that the best estimate of prewhitened power involves estimates of (unprewhitened) power at many ’s. An alternative procedure that naturally suggests itself might be to measure the power spectrum with a fixed , prewhiten it, and call that the best estimate of prewhitened power at a particular . However, the prewhitened power from the latter procedure does not satisfy the desideratum that the estimates in the numerator and denominator of equation (28) are the same. Our view is that it is better to impose the a priori requirement that the in the numerator and denominator be the same, than to discard that information. Given that it is necessary to measure the (unprewhitened) power at many ’s, for each wavenumber , one is also faced with the necessity of measuring the covariances between powers with different ’s and different ’s. But limitations of computer power then constrain one to using just a handful of ’s. This is the practical reason behind the procedure adopted here.
The philosophical reason for measuring the power by compressing estimates from a handful of ’s, rather than adopting at each a single FKP constant equal to – times the power , is that the factor of – depends on the assumed model for the behaviour of higher order correlations, and there is no assurance that the PSCz data conform to the model. Indeed the model adopted by H00 — the hierarchical model with constant hierarchical amplitudes — is certainly wrong at some level, because the resulting covariances of power violate the Schwarz inequality unless the 4-point star amplitude is equal to minus the 4-point snake amplitude, , contrary to observation (Scoccimarro, Zaldarriaga & Hui 1999 §3.3; H00). Our preference is therefore to allow the PSCz data to ‘choose’ the best weighting.
3.11 Cautious Fisher compression
At this point, the data consist of FKP weightings of each of harmonics (even harmonics up to ) of band-powers at each of wavenumbers ( to logarithmically spaced at ), a total of quantities. Along with the data are their fluctuations, equation (21), with respect to each of volume elements, a total of fluctuations. The covariance matrix of the data is constructed (or at least constructible) from the fluctuations as described in Section 3.8 (in effect, the fluctuations provide a convenient way to store in abbreviated form the variances and covariances between all quantities).
In principle, the Fisher matrix formalism (see Tegmark, Taylor & Heavens 1997 for a review) allows one to take the data and use their Fisher matrix – their inverse covariance – to compress them optimally into measurements of real space power. Unfortunately, errors in the measured covariance matrix thwart so idealistic an enterprise. We relegate this moral tale of failed ambition to its rightful place, an Appendix.
A symptom of the difficulty with the covariance matrix is that a good fraction of its eigenvalues are negative, whereas in reality the covariance matrix should be positive definite, with all positive eigenvalues.
If the only problem were negative eigenvalues, then it would be easy to solve by Singular Value Decomposition. The more serious problem is that the covariance matrix contains positive eigenvalues some of which are evidently spuriously small. A small positive eigenvalue can signify either that a quantity is accurately measured, or else that there is some highly correlated set of quantities. Clearly one wants to retain a well-measured quantity; on the other hand one might be inclined to discard some component of a set of highly correlated quantities.
The problem is not that the covariance matrix is particularly badly measured. In fact the level of fluctuations in the measured covariances, such as can be seen in Figure 15, suggests that the covariances are typically accurate to . Moreover there is general consistency with errors measured (HTP) by the linear method.
Abandoning any grand compression scheme (Appendix B), we revert to a simpler program, to compress the 5 FKP-weighted estimates of each band-power into one.
We first form an estimate of the real space power at each FKP weighting and each wavenumber from the redshift space power in the transverse direction, , including only harmonics of redshift power up to given by equations (13) and (14) (the hat on in the following equation is a reminder that it is an estimate, not the true value, of the band-power harmonic , eq. 15):
| (31) |
We compute the covariance matrix of the five FKP-weighted estimates from the fluctuations , equation (21), as described in Section 3.8. The resulting covariance matrix is consistent with that computed less directly (hence presumably less accurately) via the covariance matrix of harmonics.
We then prewhiten (§3.9) each of the 5 FKP-weighted estimates , and prewhiten their covariance matrix correspondingly. Since prewhitening requires knowledge of the full power spectrum, we start by compressing the 5 estimates without prewhitening, derive the best estimate power, use that to prewhiten, rederive the best estimate power, and iterate to convergence. If denotes the ’th of 5 estimates of prewhitened power, then the overall best estimate is that which minimizes
| (32) |
where is the covariance matrix of estimates of prewhitened power. The minimum solution of equation (32) is
| (33) |
Typically, the covariance matrix contains some small (sometimes negative) eigenvalues, indicating that the 5 estimates are highly correlated – not a particularly surprising result. However, minimization typically responds to the high correlation by assigning one estimate a large positive weight, and another an almost cancelling large negative weight. Such behaviour is clearly spurious, an artefact of errors in the covariance matrix having random ill effects on small eigenvalues.
We solve the problem by requiring that the weights that go into the best estimate, equation (33), all be positive, . We do this in a dumb way: we find the minimum solution for each of the nontrivial ways in which each of the 5 weights is free or fixed at , and choose that positive weighting that has the smallest . Typically two or three of the 5 estimates have nonzero weights in the best estimate. The other estimates, having zero weight, are in effect discarded, the least informative way of using those data.
The weightings for the full set of band-powers show a plausible and expected pattern. Band-powers at larger scales, where is large, prefer weightings with larger FKP constants , while band-powers at smaller scales prefer smaller .
Finally, having obtained the best estimate prewhitened power , we unprewhiten to obtain the best estimate power . As commented above, several iterations are needed to ensure that the power spectrum used in (un)prewhitening is the same as the best estimate.
The main effect of prewhitening before compressing, as opposed to compressing powers directly, is to prefer smaller FKP constants . The consequences of this preference are commented on in Section 4.5.
3.12 Selection function
Since HTP give only a brief description of the measurement of the selection function, we offer more details here. We adopt three simplifying assumptions commonly made in measuring the selection function of a flux-limited galaxy survey (see e.g. the reviews by Binggeli, Sandage & Tammann 1988; Willmer 1997; Tresse 1999): (1) that the luminosity function is independent of position; (2) that the survey is complete to the specified flux limit; and (3) that distances and galaxy fluxes are measured with negligible error. Undoubtedly all of these assumptions fail at some level.
If the above three assumptions are taken to be true, then there is a unique exact solution (modulo an overall normalization factor), a solution for the luminosity function and radial density distribution of galaxies that exactly reproduces the observed distribution of luminosities and distances. The exact solution is given by Lynden-Bell’s (1971) method, which coincides with Turner’s (1979) method in the limit of infinitesimal bins, and with Efstathiou, Ellis & Peterson’s (1988) Stepwise Maximum Likelihood method in the limit of infinitesimal steps. The exact solution is a sum of delta-functions: the luminosity function is a sum of delta-functions at the observed luminosities of the galaxies; and the galaxy density is a sum of delta-functions at the observed distances of the galaxies. This is perhaps not too surprising given that the observations – galaxies – are themselves described as delta-functions in luminosity and distance. The resulting selection function, the integral of the luminosity function, is a step-function, with a step at the limiting distance of each galaxy in the survey. In practice we evaluate the selection function using Turner’s (1979) method adapted to the case of infinitesimal bins; the algorithm has the merit of being exceedingly fast.
Figure 5 shows the resulting exact solution for the selection function and the inferred galaxy density.
The selection function so computed is ‘exact’ only to the extent that the prior assumptions are valid. Clearly, the ‘exact’ selection function, being a step-function, does not incorporate the Bayesian prejudice that the selection function is likely to be smooth. For this reason it is usual to fit the selection function to a smooth analytic function. We use the maximum likelihood method of Sandage, Tammann & Yahil (1979), and fit the selection function to a function whose form is inspired by the Schechter (1976) function, but with enough free parameters to yield a good fit, also shown in Figure 5:
| (34) | |||||||
where is the comoving depth in units of . The assumed redshift-distance relation is that of a flat CDM model with , , in which comoving distance (in velocity units) is related to redshift by
| (35) |
where is the speed of light, is the incomplete Beta function, and is the density of vacuum energy as a function of redshift.
Measurement of the selection function as described above determines its shape, but not the overall normalization (Binggeli, Sandage & Tammann 1988). The normalization factor is measured here as one of the parameters of the linear method of HTP. The fitting function (34) is thus maximum likelihood not only with respect to the shape, but also with respect to the normalization. The measured normalization depends mainly on the amplitude of the ‘mean mode’ (the mode whose angular shape is the cut monopole, and whose radial shape is that of the selection function), but it self-consistently incorporates information from the amplitudes of all other linear modes.
A difficulty one encounters in implementing a maximum likelihood fit to the selection function, per Sandage et al. (1979), is that there are many spurious non-smooth solutions that wiggle fiercely and look awful, but nevertheless have formally greater likelihood than the desired smooth solutions. This strange behaviour can be traced to the fact that the ‘exact’ solution for the luminosity function and galaxy density is a sum of delta-functions. Formally, the ‘exact’ step-function solution has infinitely greater likelihood than any smooth solution. Increasing the number of parameters in the fitting function increases the tendency for the maximum likelihood solution to slide off into a spurious non-smooth solution. To reduce this instability, we start by carrying out a simplified least squares fit to the ‘exact’ selection function, since least squares quickly finds an approximate fit without serious problems of stability. The resulting approximate values of the parameters of the fit provide the starting point from which to search for the maximum likelihood solution. Even so, the maximum likelihood fitting becomes unstable with too many parameters. The adopted fit (34) contains 7 free parameters, and formally all of these are significant; for example, increasing the number of parameters from 5 to 7 increases the log-likelihood by . However, we could not increase the number of parameters beyond this without the solution veering into instability. We interpret this behaviour as suggesting that, among functions of its form, equation (34) almost exhausts the possibilities for finding a better smooth fit.
As found by Saunders et al. (1990) in the case of the QDOT survey (the 1-in-6 precursor to PSCz), measurement of the selection function yields evidence for what appears to be strong evolution, in the sense that galaxies used to be more numerous, or more luminous, than they are now. We choose to model evolution by pure luminosity evolution, which is mathematically indistinguishable from a spectral -correction. Specifically, we adopt a luminosity-cum-spectral correction of the form in the relation between the observed flux , luminosity , redshift , and comoving distance of a galaxy. Figure 5 shows the observed number density of galaxies, divided by the measured selection function, both with evolution, , and without, . The Figure shows that, in the absence of an evolutionary correction, the galaxy density appears to increase substantially with redshift. The large degree of evolution is consistent with that reported in QDOT by Saunders et al. (1990). Actually, a canonical IRAS galaxy spectrum (Saunders et al. 1990) would predict a spectral -correction with . In that case, the actual luminosity evolution would be one power steeper than indicated in Figure 5.
The best fit value of the evolutionary exponent increases systematically as the flux limit is decreased, from 1 at 1.2 Jy, to 2.9 at 0.75 Jy, to 3.4 at 0.60 Jy. This suggests the possibility that at least part of the effect may be caused not by evolution, but rather by Malmquist bias, in which the increasing number of galaxies at fainter fluxes, combined with random flux errors at the flux limit of the survey, cause galaxies to fluctuate preferentially into rather than out of the survey. Malmquist bias is expected to be most marked in more distant regions of the survey, where the selection function is steepest.
Since galaxies which randomly fluctuate into the sample should be clustered in the same way as galaxies which correctly belong to the sample, Malmquist bias should not bias measurement of the power spectrum, so long as the bias is homogeneous over the sky. As discussed in §4.4 of Saunders et al. (2000), Malmquist bias in the PSCz survey is probably inhomogeneous at some level, notably because flux errors are higher in the 2HCON regions of the survey than in the 3HCON regions. However, if inhomogeneous Malmquist bias were important, then it should show up as an excess of angular power over radial power at the largest scales. The investigations of HTP reveal no strong excess of angular power at large scales in the redshift distortions either of the correlation function, Fig. 2 of HTP, or of the power spectrum, Fig. 4 of HTP. We tentatively conclude that inhomogeneous Malmquist bias is not a major problem in the PSCz survey.
Besides evolution, Figure 5 also suggests growing incompleteness at the greatest depths. This may be presumed to be the incompleteness at high redshift described in §4.2 of Saunders et al. (2000), associated with the policy not to pursue redshifts of galaxies optically fainter than . Since this incompleteness is greater in regions of higher optical extinction, and is systematic rather than random over the sky (Fig 4. of Saunders et al. 2000), we choose to cut the survey at , as previously did HTP. But whereas HTP set the lower depth limit at , here we choose the slightly more conservative lower limit of , about a correlation length, to reduce ‘local bias’ resulting from the fact that we, sitting in a galaxy, the Milky Way, are not at a random location.
The angular and radial cuts leave galaxies (out of an original galaxies with redshifts) in the survey.
4 Results
4.1 Real space power spectrum
Figure 6 shows the real space power spectrum of the PSCz 0.6 Jy survey with the high-latitude angular mask. The values at linear scales are from HTP, while those at nonlinear scales are measured as described in Section 3. The plotted values are tabulated in Tables 1 and 2.
At linear scales Figure 6 shows both correlated and decorrelated power spectra, as measured by HTP, tabulated separately in Tables 1 and 2. The correlated power spectrum is the one that emerges most directly from the data, and in essence represents the power spectrum smoothed through the Fourier transform of the optimally weighted survey window. The errors in the correlated power spectrum are correlated. The decorrelated power spectrum is partially deconvolved in such a way that estimates of power at different wavenumbers are uncorrelated with each other (Hamilton & Tegmark 2000). The decorrelated power spectrum is to be preferred, if one wants to compare a model power spectrum to the PSCz data at linear scales.
At nonlinear scales the power spectrum cannot be decorrelated sensibly (unless it is first prewhitened – see §4.7) so Table 2 lists the decorrelated power only at linear scales. If one attempted to decorrelate the nonlinear power spectrum into a set of uncorrelated band-powers, then the band-power windows would be so broad, with almost cancelling positive and negative parts, that it would be hard to interpret the band-powers as representing the power spectrum in any meaningful way.
Integration over the (decorrelated) power spectrum yields an rms fluctuation
| (36) |
in radius spheres of
| (37) |
Figure 6 also shows the concordance model power spectrum of Tegmark et al. (2001), nonlinearly evolved by the method of Peacock & Dodds (1996). Although the concordance model fits well at linear scales, it evidently fails dismally at nonlinear scales.
In fact all Dark Matter (DM) models with constant galaxy-to-mass bias – to be precise, all DM models in the Eisenstein & Hu (1998, 1999) suites, nonlinearly evolved by the method of Peacock & Dodds (1996), and all the Cold+Hot DM models of Ma (1998a,b), all arbitrarily normalized – fail at nonlinear scales, with high confidence.
The concordance model illustrated in Figure 6 shows two characteristic features of all DM power spectra: an inflection (Gaztañaga & Juszkiewicz 2001) at the linear-nonlinear transition scale (here ), and a turnover at the transition between the nonlinear collapse and virialized regimes (in the model at ). Instead, the observed PSCz power spectrum shows a near power law behaviour over virtually the entire observed range. The power law is not exact: visually there appears to be a mild upward curvature of power in the broad vicinity of . But there is no prominent nonlinear inflection, as there is in APM (Gaztañaga & Baugh 1998; Gaztañaga & Juszkiewicz 2001).
These conclusions are essentially the same as those previously arrived at by Peacock (1997) and Jenkins et al. (1998).
While the disagreement between theory and observation may presage a drastic failure of DM models, or of the Peacock-Dodds or Ma transformations, it seems more likely that scale-dependent galaxy-to-mass bias is responsible.
To make theory and observation agree requires antibias at intermediate scales, and positive bias at small scales, as can be seen in Figure 6. Remarkably, precisely this type of behaviour is reproduced in some -body experiments (Kravtsov & Klypin 1999; Colín et al. 1999; Benson et al. 2000), and there is already vigorous theoretical effort to understand it in terms of the way galaxies populate dark matter haloes (Ma & Fry 2000a,b; Seljak 2000, 2001; Peacock and Smith 2000; Scoccimarro et al. 2001).
We admit some frustration over our failure, documented in Section 3.11 and Appendix B, to measure a positive definite covariance matrix for the nonlinear power spectrum. Without such a matrix, and given the broad covariance of power in the nonlinear regime, it is impossible to assess rigorously the statistical significance of the tentative mild upward curvature of power near . If the off-diagonal elements of the covariance matrix are simply discarded – an inadmissible procedure, but no better option presents itself – then the best single power law fit over the range – is (with measured in )
| (38) |
with for 59 nominal degrees of freedom. The low per degree of freedom is indicative of the high degree of correlation of the nonlinear estimates of power, not of the excellence of the fit. The best fit to a sum of two power laws over – is (with measured in )
| (39) |
with for 57 nominal degrees of freedom. The reduction of by 6 for 2 additional parameters can by no means be construed as implying that the upward curvature of power is statistically significant; but there is a possibility that it may be statistically significant. The exponents and in the two power law fit, equation (39), may exaggerate slightly the asymptotic slopes of the power spectrum at large and small scales: the best fitting exponents to single power laws at large, –, and small, –, scales are and respectively.
4.2 Power at the smallest scales
How reliable are the measurements of power at the smallest scales, ? Such scales correspond to separations of the order of a galaxy size, .
Beyond the minimum depth of considered in this paper, there are 7 distinct pairs of galaxies with transverse separations closer than (and redshift separations small enough that they are probably physically associated), mostly near the plane of the Local Supercluster. There are a further 34 distinct pairs with transverse separations in the interval –, variously distributed over the sky (3 of the 34 pairs actually live in 3 distinct triple systems). The number of close pairs, though not large, appears to be enough to provide a statistically significant sample.
An important systematic effect arises from IRAS’s angular resolution, which is expected to lead to a deficiency of galaxy pairs at small angular separations. IRAS scanned roughly along lines of constant ecliptic longitude (see e.g. http://www.ipac.caltech.edu/Outreach/Gallery/IRAS/allsky.html), and the angular resolution for a single scan was typically in-scan by cross-scan (§2.3 of Saunders et al. 2000). As described in the IRAS Explanatory Supplement (Beichman et al. 1988, §V.H), the resolution of the Point Source Catalog (PSC) was improved by combining several scans at neighbouring longitudes. The selection rules for the PSC impose an absolute lower limit on pair separation of in-scan by cross-scan, although this limit is occasionally violated because of variations in processing. In the PSCz sample considered in this paper, there are in practice 5 distinct pairs closer than , though none closer than .
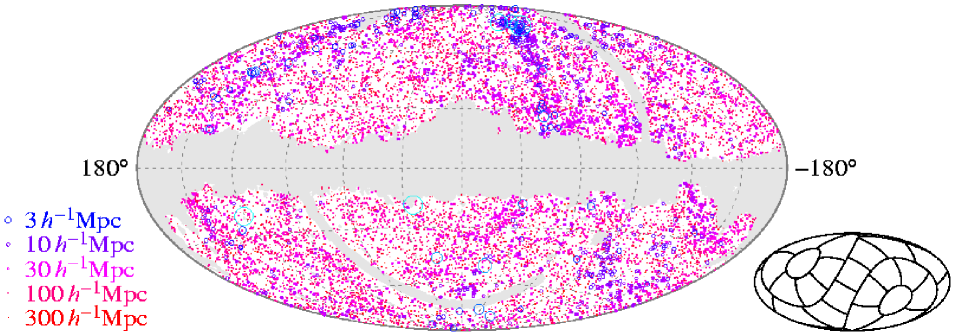
Figure 7 shows the distribution of close pairs relative to a frame aligned with local ecliptic coordinates. The Figure shows that the effective resolution in the cross-scan direction is substantially higher than the single-beam resolution, indicating that the PSC strategy of combining scans from neighbouring longitudes was particularly effective in the cross-scan direction. Indeed, the Figure suggests that the resolution in the cross-scan (horizontal) direction is if anything slightly higher than the resolution in the in-scan (vertical) direction. We have also checked the distribution of close pairs on the sky, and find no tendency for close pairs to lie preferentially near the ecliptic poles, where scans cross, and where the angular resolution might be expected to be high in all directions.
Given the evidence of Figure 7, we assume that the IRAS beam is effectively isotropic, with an angular resolution of .
Independent of any a priori knowledge about the IRAS beam, the fact that there is a deficiency of close pairs in PSCz can be demonstrated by looking at the distribution of pairs as a function of depth. If the sample were complete, then the distribution of pairs with depth would be independent of pair separation, at least at pair separations small compared to the scale of the survey. Specifically, the expected number of pairs in some prescribed volume of the survey is, at pair separations small compared to the scale of the survey,
| (40) |
where the sum is over all galaxies in the volume , the quantity is the selection function at the position of galaxy , and is an integral over pair separations in the interval of interest. The distribution of pairs with depth is determined entirely by the factor , which is independent of pair separation, the factor being a constant for any specified interval of pair separations.
For the sample used in this paper, the PSCz high latitude sample at comoving depths –, formula (40) predicts that the 10, 25, 50 (median), 75, and 90 percentile depths of close pairs should be 7.5, 11, 19, 36, and respectively. By comparison, the median and maximum depths of the 7 pairs with transverse separation are 8 and , indicating a significant deficiency of pairs, with of order 30 to 50 percent completeness, while the median and maximum depths of the 34 pairs with transverse separations – are 18 and , consistent with little or no deficiency, of order 90 percent completeness.
The distribution of close pairs with depth is consistent with the hypothesis that there is a cutoff at . This angular separation corresponds to transverse separations of 8 and at the 50 and 90 percentile depths 19 and of the survey. Thus if pairs closer than are missing, then pairs at tranverse separation should be 50 percent complete, and pairs at transverse separation should be 90 percent complete. These levels of completeness are consistent with those inferred for observed pairs in the and – ranges of separation.
We choose to deal with the incompleteness by imposing a sharp lower limit of in the angular separation of pairs, in both real and ‘background’ pair counts. Figure 8 compares the power spectra measured with and without the cutoff. At the smallest scales, the power spectrum without the cutoff is systematically lower than the canonical power spectrum with the cutoff.
We caution that there is expected to be at least some incompleteness in pairs at angular separations –, so our estimate of the power spectrum at the smallest scales may be systematically underestimated. We hesitate to attempt to correct for this residual incompleteness, given the uncertainty in IRAS’s effective beam.
Whether the small scale power spectrum of PSCz galaxies is systematically underestimated or not, it demonstrates dramatically that the power spectrum continues to small scales with no hint of any turnover such as expected in the matter power spectrum.
4.3 Comparison of methods
Figure 9 compares the power spectrum measured by the linear and nonlinear methods separately, demonstrating good agreement between the two methods where they overlap, around . This agreement constitutes a powerful end-to-end test of both methods, since they involve completely different approximations and computational approaches.
Quantitative comparison is complicated by the fact that the band-power windows have somewhat different shapes for the linear and nonlinear methods. Moreover the nonlinear method assumes a weaker prior, since it allows higher harmonics of redshift power, so the errors on the nonlinear estimates might be expected to be slightly larger where both methods work well. However, the agreement is encouraging despite these differences. For example, the results for the two band-powers adjacent to the linear-nonlinear boundary are as follows. For the band-power centred at , the linear and nonlinear methods yield and respectively, a mismatch in power and a larger error for the nonlinear case. Similarly, for the band-power centred at , the linear and nonlinear methods yield and respectively, a mismatch in power, and a larger error for the nonlinear case. Tightening the nonlinear prior by reducing the maximum number of harmonics, equation (13), reduces the error bars in the nonlinear case, bringing them into closer agreement with the linear method.
At linear scales the nonlinear method breaks down, in part because the plane-parallel approximation breaks down, but also because the band-power window we have used at nonlinear scales, with , which has a fwhm of , becomes too narrow in low wavenumber band-powers to be resolved by the survey. We assess the problem quantitatively by introducing an explicit maximum pair separation of , and computing the neglected contribution to monopole power from separations exceeding the limit. The neglected contribution increases with exponential rapidity at large scales, from a fractional correction of to the band-power at , to at , to overwhelmingly dominant at . This explains why the power computed by the nonlinear method is plotted only at in Figure 9.
At nonlinear scales the linear method breaks down, in part because both the assumption of Gaussian density fluctuations and the linear model of redshift distortions fail, but also because the number 4096 of Karhunen-Loève modes used by HTP is, by design, sufficient to achieve good coverage of -space only up to . At larger wavenumbers the coverage of -space becomes increasingly sparse. This explains why the power computed by the linear method appears to become noisier at , and why it is plotted only to in Figure 9.
Figure 9 also compares the power spectrum measured by the nonlinear method using two different band-power windows, with and . The high resolution band-powers, , have resolution fwhm twice that of the low resolution band-powers, . Evidently the two sets of band-powers yield results in good agreement. We also experimented with , which has three times the resolution of ; again the results were in good agreement.
We also computed a power spectrum using the nonlinear method with but with twice as many harmonics, , as the adopted maximum, equation (13). The power spectrum agrees well with the original calculation, but we choose to omit it from Figure 9 to avoid confusing the plot.
The maximum harmonic measurable with a band-power is . The concern with the low resolution band-powers, , is that at large wavenumbers there are not enough harmonics to resolve the expected hill in the redshift power at , the all-important place where redshift power equals real power. In fact equation (13) would suggest that, in order to resolve redshift power satisfactorily, harmonics are required at , with required at . One might anticipate that too few harmonics would tend to smooth out the hill, hence bias the estimate of real power systematically low. However, Figure 9 shows little sign that the lower resolution band-powers with are biased low compared to the higher resolution band-powers with . Some bias surely remains, but it is apparently small compared to the statistical uncertainty. Since the low resolution band-powers have smaller error bars than the high resolution band-powers binned to the same resolution, we prefer the low resolution band-powers at all nonlinear scales.
4.4 Comparison to APM
To date the best published measurement of the real space galaxy power spectrum is that of the APM survey111 The APM power spectrum in the present paper is taken from Table 2 of Gaztañaga & Baugh (1998), who state that their tabulated numbers are essentially the same as those of Baugh & Efstathiou (1993). Eisenstein & Zaldarriaga (2000) have critiqued the error bars of Baugh & Efstathiou (1993, 1994), and to a lesser extent those of Dodelson & Gaztañaga (2000), as overly optimistic, mainly because of the neglect of covariances. Unfortunately Eisenstein & Zaldarriaga limit their analysis to , so in the present paper we choose to quote the power spectrum of Gaztañaga & Baugh (1998). The Eisenstein & Zaldarriaga power spectrum has factor of 2 larger error bars, and scatters about more, than the Gaztañaga & Baugh spectrum, but the two measurements are otherwise consistent with each other. (Baugh & Efstathiou 1993, 1994; Maddox et al. 1996; Gaztañaga & Baugh 1998, Table 2; Dodelson & Gaztañaga 2000; Eisenstein & Zaldarriaga 2000).
As discussed by Baugh & Efstathiou (1993) and Eisenstein & Zaldarriaga (2000), the APM survey has a median depth in redshift of , and transforming the power spectrum to zero redshift depends on cosmology. The main effect is that the redshift-distance relation is different in different cosmologies. The canonical APM power spectrum quoted by Baugh & Efstathiou, Gaztañaga & Baugh, and Eisenstein & Zaldarriaga assumes a flat matter-dominated cosmology, . In a CDM cosmology, , (as assumed for the redshift-distance relation in our PSCz measurements), the power spectrum would be higher. Following Peacock (1997), we renormalize the APM power spectrum upward by a factor , which according to Peacock brings it into agreement with the real space correlation function of the APM-Stromlo survey (Loveday et al. 1995).
Figure 10 compares the real space power spectrum of PSCz to that of APM. The relative bias between APM and PSCz, defined as the square root of the ratio of their power spectra, reveals a suggestively simple pattern. At linear scales the relative bias is approximately constant, . At transition scales – the APM to PSCz bias increases, settling down at nonlinear scales to another constant, .
Intriguingly, the APM to PSCz bias would have been close to unity at linear scales if we had not renormalized the APM power spectrum by Peacock’s factor . However, we are persuaded that it is correct to renormalize.
The fact that APM to PSCz bias is consistent with being constant at linear scales is an encouraging confirmation of the prediction of local bias models, that bias at large, linear scales should be scale-independent (Coles 1993; Fry and Gaztañaga 1993; Scherrer & Weinberg 1998; Coles, Melott & Munshi 1999; Heavens, Matarrese & Verde 1999). Scale-independence of bias at linear scales is also a feature of -body experiments (Kravtsov & Klypin 1999; Colín et al. 1999; Narayanan, Berlind & Weinberg 2000; Benson et al. 2000).
4.5 Power spectra from individual FKP weightings
Figure 11 compares the power spectra measured from the five individual FKP pair-weightings (§3.10), with FKP constants , , , , and , equation (30). To show more detail, the lower panel of Figure 11 shows the bias of the power spectra, defined here to be the square root of the ratio of the power spectrum to the standard power spectrum of PSCz plotted in Figure 6 and tabulated in Table 1. Figure 11 demonstrates that there is a general consistency between the power spectra measured with different pair-weightings.
Larger FKP constants give greater effective weight to more distant regions of the survey, hence to more luminous galaxies. Figure 11 gives weak indication that power spectra measured with larger FKP constants have higher bias over the range –, which in turns suggests weakly that IRAS-luminous galaxies may be more clustered than less luminous galaxies at these scales. If this is correct, then it would suggest that the power spectrum of the more luminous IRAS galaxies may be similar to the power spectrum of APM galaxies, Figure 10.
One should be careful not to overinterpret Figure 11. The fact that measurements for and appear systematically high, at the – level, over the range –, might suggest that the difference is statistically significant. However, the power spectrum is highly correlated over this range, as seen in Figure 15 below, and the significance is more marginal than it appears.
Figure 11 also gives some suggestion that power spectra with larger FKP constants may switch to being biased low at smaller scales, . However, as is evident from the errors bars in the lower panel of Figure 11, the noise is really too great to tell.
As discussed in Section 3.11, instead of compressing the five FKP-weighted estimates of each band-power directly, we first prewhiten the power, then compress, then unprewhiten, since in theory it is better to apply an FKP-like weighting to almost uncorrelated measure like the prewhitened power (H00). The general effect of prewhitening before compressing is to prefer smaller FKP constants , i.e. to give relatively more weight to nearer, less luminous galaxies. Figure 12 shows the power spectra measured both with and without prewhitening before compression. The consequence on the power spectrum is for the most part small. The most noticeable effect is what might be expected on the basis of Figure 11: prewhitening before compressing decreases power by over the range –.
Perhaps the greatest concern over luminosity-dependent bias is that it could bias the estimation of cosmological parameters. If more luminous galaxies are more clustered, then estimates of power at large scales, which depend more on distant, luminous galaxies, would be biased upward, giving the power spectrum a false red tilt. Encouragingly, Figure 11 shows no evidence of significant luminosity bias at scales . Although these measurements are restricted to the nonlinear regime, they do suggest that luminosity bias is probably not a major effect on the cosmological parameter analysis of Tegmark et al. (2001), which used PSCz data only at linear scales .
Three recent studies, by Beisbart & Kerscher (2000), Szapudi et al. (2000), and Hawkins et al. (2001), have found no evidence of significant difference between the clustering of luminous and faint galaxies in the PSCz survey. Our results, while not constituting a formal study of differential biasing with luminosity, are consistent with the conclusions of these authors.
4.6 Real space correlation function
The correlation function remains one of the most popular statistics for characterizing large scale structure (Peebles 1980).
Figure 13 shows the real space correlation function of PSCz, obtained as the Fourier transform of the real space power spectrum shown in Figure 6. The covariance properties of the correlation function are less than ideal, since there are broad correlations between estimates at different pair separations . We make no attempt at a rigorous treatment of errors, and instead simply show in Figure 13 the envelope defined by the Fourier transforms of the correlated power spectrum and its extremes.
Table 3 tabulates the correlation function , the Fourier transform of the correlated power from Table 1, and the correlation functions and which are the Fourier transforms of the extremes of the correlated power from Table 1. Notice that is not always less than , and that and do not necessarily encompass the central value .
We Fourier transform the power spectrum to the correlation function using the fast, logarithmically-spaced Fourier-Hankel method of Talman (1978), as implemented in the FFTLog code described in Appendix B of H00, and available at http://casa.colorado.edu/ajsh/FFTLog/. Besides being able to cover a broader range of scales, the logarithmic FFT has the advantage that it does not suffer from the serious problem of ringing that afflicts the normal FFT when applied to cosmological power spectra (H00, Fig. 12).
To avoid artefacts arising from the periodicity in log space assumed by FFTLog, we padded the power spectrum with a power law at each end to quadruple (double would have sufficed) the logarithmic interval, to , and to . We then applied the most straightforward version of the FFTLog transform, i.e. no power-law bias (), and a low-ringing value of . Finally, we retained only the central part of the correlation function , from to .
A by-eye fit of the resulting correlation function to a power-law yields with correlation length and index over the range –. The fit is illustrated in Figure 13. The correlation function is a factor higher than, but has about the same slope as, the correlation function measured by Saunders et al. (1992), who found and over pair separations – from a power law fit to the projected cross-correlation function between the QDOT survey (the 1-in-6 precursor to PSCz) and its parent QIGC angular catalogue. Our power-law fit is also higher, but slightly shallower, than that of Fisher et al. (1994a), who inferred and over – from a power law fit to the projected correlation function of the IRAS 1.2 Jy survey.
Fitting by eye is not satisfactory, but as in the case of the power spectrum, discussed at the end of Section 4.1, our attempt to carry out rigorous fits is thwarted by the fact that the covariance matrix measured at nonlinear scales is not positive definite (see §3.11 and Appendix B). The best that we have been able to do in terms of rigorous fitting at nonlinear scales is discussed in the following subsection, on the prewhitened power spectrum.
4.7 Prewhitened power spectrum
Nonlinear evolution induces broad correlations between estimates of power at different wavenumbers (Meiksin & White 1999; Scoccimarro, Zaldarriaga & Hui 1999; H00). In effect, nonlinear evolution blurs whatever information may have been present in the linear power spectrum, such as baryonic wiggles (Meiksin, White & Peacock 1999).
H00 showed that prewhitening (§3.9) the nonlinear power spectrum – transforming the power in such a way that the shot noise contribution to the covariance is proportional to the unit matrix – appears empirically to narrow the covariance of power substantially. The extent to which the prewhitened nonlinear power spectrum may be a better carrier of information than the nonlinear power itself remains to be explored, but whatever the case, the prewhitened power spectrum is less correlated, and therefore should offer better control of errors in fitting to cosmological models.
Figure 14 shows the prewhitened power spectrum of PSCz, and Table 4 tabulates the corresponding values. Figure 14 also shows the linear (not nonlinear) concordance model power spectrum from Figure 6. As remarked by H00, the prewhitened nonlinear power spectrum appears intriguingly similar to the underlying linear power spectrum, for realistic power spectra. It is not clear whether the similarity has some physical cause, or whether is is merely coincidental.
At linear scales, the prewhitened power plotted in Figure 14 has been explicitly decorrelated (Hamilton & Tegmark 2000), so that each point is uncorrelated with every other. The (unprewhitened) power spectrum shown in Figure 14 is the one that, when prewhitened, yields the plotted decorrelated prewhitened spectrum. The (unprewhitened) power in Figure 14 is not the same as either the correlated or uncorrelated powers shown in Figure 6; rather, it is that power which becomes decorrelated after being prewhitened.
We also tried decorrelating the prewhitened power at nonlinear scales, but the measured prewhitened covariance matrix proved too noisy to admit believable decorrelation band-powers (§3.11). While the prewhitened powers at nonlinear scales are therefore somewhat correlated, it would be not unreasonable to treat them as being uncorrelated, or nearly so, in fitting to theoretical models.
With the points treated as uncorrelated, a power law fit to the prewhitened power spectrum at nonlinear scales, –, yields
| (41) |
with for degrees of freedom. The pivot point of the fit in equation (41) is chosen so that the error bars on the amplitude and exponent of the fit are essentially uncorrelated. The per degree of freedom of is closer to one than the for the power law fit to the power spectrum reported in Section 4.1, but the remains lower than expected for uncorrelated points, suggesting that there remains some residual correlation in the estimates of prewhitened power.
The fitted nonlinear slope of the prewhitened power would predict that the prewhitened correlation function would have a nonlinear slope of . According to the defining equation (24), the (unprewhitened) correlation function would then have a nonlinear slope of . This is slightly steeper than the by-eye slope of fitted to the correlation function in Section 4.6. Similarly, the nonlinear slope of the prewhitened power would predict that the power spectrum would have a nonlinear slope of , somewhat shallower than the slope fitted directly to the power spectrum, equation (38). However, as discussed in Section 4.1, there is some suggestion that the power spectrum flattens to smaller scales, and the shallower slope predicted by the prewhitened power spectrum is consistent with such a flattening.
Figure 15 shows the correlations between estimates of power, and between estimates of prewhitened power, measured in the PSCz survey. The plotted quantity is the correlation coefficient , which the Schwarz inequality implies must lie between (perfect anti-correlation) and (perfect correlation). The covariances of power estimates are measured from the fluctuations in the PSCz data themselves (§3.8), and are essentially free from prior assumption. The measurements properly take into account the correlation between different subregions of the survey.
Figure 15 confirms that prewhitening the power spectrum narrows its covariance. However, the narrowing is not as good as found in analytic models by H00, and we confess some disappointment at the result. One unexpected feature of the covariance plotted in Figure 15 is that the power at appears somewhat anti-correlated with power at . We have no explanation for this.
5 Conclusions
5.1 What we have done
The paper combines two separate measurements at linear and nonlinear scales to yield a measurement of the real space power spectrum of the IRAS PSCz 0.6 Jy survey (Saunders et al. 2000) over four and a half decades of wavenumber. The linear measurement (HTP) assumes Gaussian fluctuations and that redshift distortions conform to the linear model, while the nonlinear measurement assumes the plane-parallel approximation, and infers the real space power spectrum from the redshift space power spectrum in the transverse direction. The measurements are tabulated in an Appendix.
At nonlinear scales the power spectrum is broadly correlated over different wavenumbers, which not only blurs the information content of the power spectrum, but also complicates rigorous comparison to cosmological models. We therefore also report a measurement of the prewhitened power spectrum of PSCz, which is less correlated than the (nonlinear) power spectrum itself. To assist the reader, Appendix A contains practical instructions on how to prewhiten a power spectrum.
5.2 Methodology
We have shown how to exploit galaxy redshifts to measure the real space power spectrum with accuracy comparable to that attainable from an angular survey many times larger.
We have successfully applied H00’s proposal to reduce the degree of correlation of the nonlinear power spectrum by prewhitening it. Statistical uncertainties in the covariance matrix of power estimates prevented complete decorrelation of the prewhitened nonlinear power spectrum. More reliable models, coupled with more precise measurements, of nonlinear covariance could permit full decorrelation in future analyses.
By combining separate methods at linear and nonlinear scales, the present work completes the two-pronged program envisaged by Tegmark et al. (1998). The fact that there is a range of scales where the two methods overlap and agree well suggests that this two-pronged approach should be fruitful for ongoing projects such as the 2dF Survey and the Sloan Digital Sky Survey.
5.3 What the results show
The relative bias between optically-selected APM galaxies and IRAS-selected PSCz galaxies is consistent with being constant at linear scales, with . The relative bias then rises to a second plateau at nonlinear scales . This is essentially the same behaviour as found by Peacock (1997).
All Dark Matter models predict an inflection in the matter power spectrum at the transition between the linear and nonlinear regimes at , and a turnover at the transition from nonlinear collapse to the virialized regime at . The PSCz galaxy power spectrum shows neither of these features, but instead displays a near power-law behaviour to the smallest scales measured, with possible mild upward curvature in the broad vicinity of . Short of a drastic revision of the current rather successful cosmological paradigm, the PSCz nonlinear power spectrum requires scale-dependent galaxy-to-mass bias: all Dark Matter models without scale-dependent bias are ruled out with high confidence.
We caution that it is possible that we have underestimated the PSCz power spectrum systematically at the smallest scales, , because IRAS’s resolution causes it to miss pairs at the smallest angular separations. We have attempted to remove most of the systematic by imposing a lower cutoff of in angular separation, but it is possible that a small residual systematic remains.
The measured nonlinear power spectrum of PSCz clearly contains valuable information about galaxy-to-mass bias, and it will be a challenge for -body experiments to reproduce, and for theories to explain, the observed power spectra of both IRAS-selected and optically-selected galaxies (White et al. 1987; Kravtsov & Klypin 1999; Colín et al. 1999; Narayanan, Berlind & Weinberg 2000; Benson et al. 2000; Ma & Fry 2000a,b; Seljak 2000, 2001; Peacock and Smith 2000; Scoccimarro et al. 2001). Because of the wide lever arm in wavenumber, it is possible that even fairly rudimentary models of nonlinear bias may allow interesting constraints to be placed on certain cosmological parameters, for instance on the primordial scalar spectral index , or on deviations from power law behaviour in the primordial spectrum.
If the Dark Matter paradigm is correct, then the fact that the observed power spectrum of PSCz galaxies is close to a power law over four orders of magnitude in wavenumber results from a cosmic conspiracy where the funny features in the nonlinear matter power spectrum are accurately cancelled by scale-dependent bias. It remains to be seen whether this is merely a cosmic coincidence or a hint of interesting underlying physics.
Acknowledgements
We thank Chung-Pei Ma and Simon White for helpful comments, and the referee Will Saunders for many wise suggestions, notably for emphasizing the important effect of IRAS’s finite angular resolution on pairs at small separations. Special thanks to the PSCz team for publishing the data from this superb survey on a timely basis. This work was supported by NASA ATP grant NAG5-7128, NASA LTSA grant NAG5-6034, NSF grant AST00-71213, and the University of Pennsylvania Research Foundation.
References
- [1] Abramowitz M., Stegun I. A., 1968, Handbook of Mathematical Functions. Dover, New York.
- [2] Baker J. E., Davis M., Lin H., 2000, ApJ, 536, 112
- [3] Baugh C. M., 1996, MNRAS, 280, 267
- [4] Baugh C. M., Efstathiou G., 1993, MNRAS, 265, 145
- [5] Baugh C. M., Efstathiou G., 1994, MNRAS, 267, 323
- [6] Beichman C. A., Neugebauer G., Habing H.J., Clegg P.E., Chester T.J., 1988, Infrared Astronomical Satellite (IRAS) Explanatory Supplement, NASA Ref. Publ. 1190; on-line version at http://space.gsfc.nasa.gov/astro/iras/docs/exp.sup/index.html
- [7] Beisbart C., Kerscher M., 2000, ApJ, 545, 6
- [8] Benson A. J., Cole S., Frenk C. S., Baugh C. M., Lacey C. G., 2000, MNRAS, 311, 793
- [9] Binggeli B., Sandage A. and Tammann G.A., 1988, ARA&A, 26, 509
- [10] Blackman R. B., Tukey J. W., 1959, The Measurement of Power Spectra from the Point of View of Communications Engineering. Dover, New York
- [11] Cole S., Hatton S., Weinberg D. H., Frenk C. S., 1998, MNRAS, 300, 945
- [12] Coles P., 1993, MNRAS, 262, 1065
- [13] Coles P., Melott A., Munshi D., 1999, ApJ, 521, 5
- [14] Colín P., Klypin A. A., Kravtsov A. V., Khokhlov A. M., 1999, ApJ, 523, 32
- [15] Davis M., Miller A., White S. D. M., 1997, ApJ, 490, 63.
- [16] Davis M., Peebles P. J. E., 1977, ApJS, 34, 425
- [17] Davis M., Peebles P. J. E., 1983, ApJ, 267, 465
- [18] Diaferio A., Geller M., 1996, ApJ, 467, 19
- [19] Dodelson S., Gaztañaga E., 2000, MNRAS, 312, 774
- [20] Efstathiou, G., Ellis, R. S., Peterson, B. A., 1988, MNRAS, 232, 431
- [21] Eisenstein D. J., Hu W., 1998, ApJ, 496, 605
- [22] Eisenstein D. J., Hu W., 1999, ApJ, 511, 5
- [23] Eisenstein D. J., Hu W., Tegmark M., 1999, ApJ, 518, 2
- [24] Eisenstein D. J., Zaldarriaga M., 2001, ApJ, 546, 2
- [25] Feldman H. A., Kaiser N., Peacock J. A., 1994, ApJ, 426, 23 (FKP)
- [26] Fisher K. B., Davis M., Strauss M. A., Yahil A., Huchra J. P., 1993, ApJ, 402, 42
- [27] Fisher K. B., Davis M., Strauss M. A., Yahil A., Huchra J. P., 1994a, MNRAS, 266, 50
- [28] Fisher K. B., Davis M., Strauss M. A., Yahil A., Huchra J. P., 1994b, MNRAS, 267, 927
- [29] Fry J. N., Gaztañaga E., 1993, ApJ, 413, 447
- [30] Gaztañaga E., Juszkiewicz R., 2001, ApJ, 558, L1 (astro-ph/0107402)
- [31] Gaztañaga E., Baugh C. M., 1998, MNRAS, 294, 229
- [32] Guzzo L., Bartlett J. G., Cappi A., Maurogordato S., Zucca E., Zamorani G., Balkowski C., Blanchard A., Cayatte V., Chincarini G., Collins C. A., Maccagni D., H. MacGillivray, Merighi R., Mignoli M., Proust D., Ramella M., Scaramella R., Stirpe G. M., Vettolani G., 2000, A&A, 355, 1
- [33] Groth E. J., Peebles P. J. E., 1977, ApJ, 217, 385
- [34] Hamilton A. J. S., 1992, ApJ, 385, L5 (H92)
- [35] Hamilton A. J. S., 1993, ApJ, 417, 19 (H93)
- [36] Hamilton A. J. S., 1995, in Maurogordato S., Balkowski C., Tao C., Trân Thanh Vân J., eds., Clustering in the Universe, Proc. XXXth Rencontres de Moriond. Editions Frontières, p. 143 (H95)
- [37] Hamilton A. J. S., 1998, in Hamilton D., ed, The Evolving Universe. Kluwer, Dordrecht, p. 185 (astro-ph/9708102) (H98)
- [38] Hamilton A. J. S., 2000, MNRAS, 312, 257 (H00)
- [39] Hamilton A. J. S., Tegmark M., 2000, MNRAS, 312, 285
- [40] Hamilton A. J. S., Tegmark M., Padmanabhan N., 2000, MNRAS, 317, L23 (HTP)
- [41] Hatton S. J., Cole S., 1997, MNRAS, 296, 10
- [42] Hatton S. J., Cole S., 1999, MNRAS, 310, 1137
- [43] Hawkins E., Maddox S., Branchini E., Saunders W., 2001, MNRAS, 325, 589
- [44] Heavens A. F., Matarrese S., Verde L. 1999, MNRAS, 301, 797
- [45] Jenkins A., Frenk C. S., Pearce F. R., Thomas P. A., Colberg J. M., White S. D. M., Couchman H. M. P., Peacock J. A., Efstathiou G., Nelson A. H. (The Virgo consortium), 1998, ApJ, 499, 20
- [46] Jing Y. P., Börner G., 2001, ApJ, 547, 545
- [47] Jing Y. P., Mo H. J., Börner G., 2000, ApJ, 494, 1
- [48] Juszkiewicz R., Fisher K. B., Szapudi I., 1998, ApJ, 504, 1
- [49] Kaiser N., 1987, MNRAS, 227, 1
- [50] Kepner J., Summers F., Strauss M., 1997, New Astron., 2, 165
- [51] Kravtsov A. V., Klypin A. A., 1999, ApJ, 520, 437
- [52] Landy S. D., Szalay A. S., Broadhurst T. J., 1998, ApJ, 494, L133
- [53] Lynden-Bell D., 1971, MNRAS, 155, 95
- [54] Ma C.-P., 1998a, ApJ, 508, L5
- [55] Ma C.-P., 1998b, Ann. NY Acad. Sci., 848, 75
- [56] Ma C.-P., Fry J. N., 2000a, ApJ, 531, L87
- [57] Ma C.-P., Fry J. N., 2000b, ApJ, 543, 503
- [58] Loveday J., Maddox S. J., Efstathiou G., Peterson B. A., 1995, ApJ, 442, 457
- [59] Maddox S. J., Efstathiou G., Sutherland W. J., 1990b, MNRAS, 246, 433
- [60] Maddox S. J., Efstathiou G., Sutherland W. J., 1996, MNRAS, 283, 1227
- [61] Maddox S. J., Sutherland W., Efstathiou G., Loveday J., 1990a, MNRAS, 243, 692
- [62] Marzke R. O., Geller M. J., da Costa L. N., Huchra J. P., 1995, AJ, 110, 477
- [63] Meiksin A., White M., 1999, MNRAS, 308, 1179
- [64] Meiksin A., White M., Peacock J. A., 1999, MNRAS, 304, 851
- [65] Narayanan V. K., Berlind A., Weinberg D. H., 2000, ApJ, 528, 1
- [66] Nichol R. C., Collins C. A., Lumsden S. L., 2001, ApJS, submitted (astro-ph/0008184)
- [67] Peacock J. A., 1997, MNRAS, 284, 885
- [68] Peacock J. A., Dodds S. J., 1996, MNRAS, 280, L19
- [69] Peacock J. S., Smith R. E., 2000, MNRAS, 318, 1144
- [70] Peebles P. J. E., 1976, Ap&SS, 45, 3
- [71] Peebles P. J. E., 1980, The Large Scale Structure of the Universe. Princeton University Press, Princeton
- [72] Ratcliffe A., Shanks T., Fong R., Parker Q. A., 1998, MNRAS, 296, 191
- [73] Sandage A., Tammann G. A., Yahil A., 1979, ApJ, 232, 352
- [74] Saunders W., Rowan-Robinson M., Lawrence A., 1992, MNRAS, 258, 134
- [75] Saunders W., Sutherland W. J., Maddox S. J., Keeble O., Oliver S. J., Rowan-Robinson M., McMahon R. G., Efstathiou G. P., Tadros H., White S. D. M., Frenk C. S., Carraminana A., Hawkins M. R. S., 2000, MNRAS, 317, 55 (PSCz, available at http://www-astro.physics.ox.ac.uk/wjs/pscz.html)
- [76] Scherrer R. J., Weinberg D. H., 1998, ApJ, 504, 607
- [77] Scoccimarro R., Couchman H. M. P., Frieman J. A., 1999, ApJ, 517, 531
- [78] Scoccimarro R., Frieman J. A., 1999, ApJ, 520, 35
- [79] Scoccimarro R., Sheth R. K., Hui L., Jain B., 2001, ApJ, 546, 20
- [80] Scoccimarro R., Zaldarriaga M., Hui L., 1999, ApJ, 527, 1
- [81] Seljak U., 2000, MNRAS, 318, 203
- [82] Seljak U., 2001, MNRAS, 325, 1359
- [83] Seto N., Yokoyama J., 1998, ApJ, 492, 421
- [84] Sheth R. K., 1996, MNRAS, 279, 1310
- [85] Strauss M. A., Ostriker J. P., Cen R., 1998, ApJ, 494, 20
- [86] Szapudi I., 2000, in The Onset of Nonlinearity, Proc. 15th Florida Workshop in Nonlinear Astronomy and Physics, to appear (astro-ph/0008224)
- [87] Szapudi I., Branchini E., Frenk C. S., Maddox S., Saunders W., 2000, MNRAS, 318, 45
- [88] Szapudi I., Colombi S., Bernardeau F., 1999, MNRAS, 310, 428
- [89] Talman J. D., 1978, J. Comp. Phys., 29, 35
- [90] Tegmark M., 1995, ApJ, 455, 429
- [91] Tegmark M., Hamilton A. J. S., Strauss M. A., Vogeley M. S., Szalay A. S., 1998, ApJ, 499, 555
- [92] Tegmark M., Taylor A. N., Heavens A. F., 1997, ApJ, 480, 22
- [93] Tegmark M., Zaldarriaga M., Hamilton A. J. S., 2001, Phys. Rev. D, 63, 43007
- [94] Tresse L., 1999, in Le Fèvre O., Charlot S., eds, Formation and Evolution of Galaxies, Les Houches School Series. Springer-Verlag (astro-ph/9902209)
- [95] White S. D. M., Davis M., Efstathiou G. P., Frenk C. S., 1987, Nature, 330, 451
- [96] Willmer C. N. A., 1997, AJ, 114, 898
- [97] Zurek W. H., Quinn P. J., Salmon J. K., Warren M. S., 1994, ApJ, 431, 559
Appendix A How to prewhiten the power spectrum
This part of the Appendix offers some practical hints on how to prewhiten a power spectrum numerically. We have had success with two different methods, described below. The first method uses a logarithmic Fast Fourier Transform technique to go from Fourier space to real space and back again, while the second uses a matrix method that works entirely in Fourier space. The two methods can provide a useful numerical check on each other.
A.1 How to prewhiten power: Fourier method
The method is:
-
•
Fourier transform the power spectrum to obtain the correlation function ;
-
•
Transform the correlation function to the prewhitened correlation function in accordance with equation (24);
-
•
Fourier transform the prewhitened correlation function back to obtain the prewhitened power spectrum .
We strongly recommend using the logarithmic FFT (Talman 1978; H00, Appendix B), since the normal FFT suffers from serious ringing when applied to realistic cosmological power spectra (see Fig. 12 of H00). Whereas the normal FFT works on linearly spaced points, the logarithmic FFT, which we have implemented in a code FFTLog available at http://casa.colorado.edu/ajsh/FFTLog/, works on logarithmically spaced points, easily covering ranges of orders of magnitude in wavenumber or pair separation with modest numbers of points.
The logarithmic FFT assumes that the function (times some power law) is periodic in the log. To reduce artefacts arising from periodicity, we recommend padding the power spectrum at large and small scales (for example with a power law at large scales and a power law with to at small scales) to double the logarithmic range of interest, and then retaining only the central half of the transformed sequence.
The FFTLog code contains some options. We recommend the simplest choices, a zero bias exponent , and a low-ringing value of the relative phasing of the and logarithmic sequences.
Warning (cf. H00, §4.1): to avoid artefacts of ringing and aliasing, the Fourier method should not be applied over a narrow range of wavenumbers without padding.
A.2 How to prewhiten power: matrix method
If for some reason the Fourier method of §A.1 is inconvenient, then the matrix method offers an alternative. The method is:
-
•
Construct the Fourier space version of the matrix which in real space is diagonal with diagonal entries ;
-
•
Apply this matrix to the power spectrum .
Figure 16 illustrates that the prewhitening matrix in Fourier space looks essentially like a high-pass filter, which passes high frequency oscillations in the power, while reducing any smoothly varying component.
Let denote the matrix which is diagonal in real space with diagonal entries (H00, eq. 58):
| (42) |
Here is the unit matrix in real space, a 3-dimensional delta function in pair separation , satisfying . In the Fourier representation the matrix transforms to (H00, eq. 59):
| (43) |
To allow it to be manipulated numerically, the continuous matrix must be discretized. To ensure that matrix operations (matrix multiplication, inversion, diagonalization, etc.) work in the usual way, discretization must be done in such a way that the inner product in continuous Fourier space, , translates into ordinary summation in the discrete space (H00, §2.3). This leads to the discretization algorithm: for each index, , on a vector, matrix, or tensor, multiply by the square root of the Fourier volume element, . Thus should be discretized by multiplying it by :
| (44) |
(no implicit summation). If, for example, points in -space are logarithmically spaced with spacing , then the Fourier volume element is
| (45) |
From the discretized matrix , construct the prewhitening matrix
| (46) |
This involves the operations: (1) add the unit matrix to ; (2) take the square root of the resulting matrix, , via an intermediate diagonalization; (3) add the unit matrix, to form ; (4) invert, to get ; (5) multiply by .
Note that is necessarily positive, being an expectation value of products of positive densities in real space. Thus the matrix is necessarily positive definite, with all positive eigenvalues, and its square root is therefore always well-defined.
Multiplying the power spectrum by the prewhitening matrix given by equation (46) yields the prewhitened power spectrum. To make this work properly, the continuous power spectrum must first be discretized into a vector :
| (47) |
(no implicit summation). The discretized prewhitened power is the matrix product of the prewhitening matrix, equation (46), with the discretized power , equation (47):
| (48) |
(implicit summation over ). Finally, undiscretize
| (49) |
(no implicit summation) to obtain the prewhitened power spectrum .
The above prescription describes how to prewhiten the power spectrum by applying the prewhitening matrix . This matrix is not the same as the matrix that prewhitens the covariance of power, equation (27). Consult equations (24)–(26) to see why this distinction arises. The prewhitening matrix can be constructed in a manner similar to the prewhitening matrix .
Bug alert: be careful to discretize correctly.
Appendix B A (failed) attempt at Fisher Compression
This Appendix gives an illustrative example of the difficulties encountered when one tries to compress data (§3.11) using a covariance matrix which, being estimated from the data, contains statistical errors. The example is that of a single band-power, with a single FKP weighting, and the aim is to compress the measured even harmonics of the band-power down to a smaller number of harmonics.
There are measured even harmonics, up to . Assume, according to the prior, equation (13), that only even harmonics up to are nonzero. The aim is then to compress the 37 harmonics down to even harmonics, in optimal fashion.
Let (with hats) denote the measured amplitudes of the harmonics of the band-power, and let denote their covariance matrix, in the present case also measured from the data (§3.8). Let (without hats) represent the ‘parameters’ of the likelihood, the true amplitudes of the harmonics. If the harmonics were uncorrelated with each other, then the measured amplitudes of the even harmonics up to would provide the best estimates of . But in reality the harmonics are correlated, so measurements of higher harmonics can, in principle, inform values of lower harmonics.
If the usual simplifying assumption is made that the measurements are Gaussianly distributed with fixed covariance matrix , then maximizing the likelihood is equivalent to minimizing
| (50) |
where or as or . The minimum solution of equation (50) is
| (51) |
where is the Fisher matrix of the parameters
| (52) |
Equations (51) and (52) constitute a simple example of Fisher compression, which in effect reduces here to inverse-variance weighting. Examination of equation (51) shows (since the first columns of (no implicit summation) are just equal to the Fisher matrix ) that the ‘improved’ estimate is equal to the measured amplitude plus some linear combination of high order harmonics with . This makes physical sense: if, according to the prior, the higher order harmonics with are all zero, then adding judicious combinations of them to the lower order harmonics can in principle yield more accurate estimates of the latter.
Consider what happens as one adds harmonics into the mix, one at a time, starting with just the harmonics with . The initial situation poses no problem: one is estimating harmonics up to using estimates of harmonics up to , and not surprisingly the best estimates are the measured values, . Now add a harmonic, the one with . In most cases this works fine: the best estimate of each harmonic acquires a small admixture of the new harmonic , in accordance with equation (51), and the variance of the best estimate decreases by a small amount. As more and and more harmonics are folded into the mix, the variance creeps down. So far so good. Sooner or later, however, the Fisher matrix hits a negative eigenvalue. Although the negative eigenvalue does not necessarily cause immediate havoc, it is a sign of doom impending. Within a few more harmonics, the variance of the ‘best estimate’ has plummeted, even reaching negative values. Naturally one is skeptical that a negative eigenvalue could improve the estimate so.
So how about the idea of stopping one step before the first negative eigenvalue appears? At first sight this seems to work fine, and one is encouraged to take the next step of computing the estimated real power from the appropriate linear combination of best-fit harmonics with Legendre polynomials . Typically, the variance of the best estimate of real power is about half the variance of the initial, pre-compression estimate. In a few cases the variance is reduced by as much as a factor of 4, apparently a serious improvement.
Unfortunately the resulting ‘best-fit’ real power spectrum does not live up to the advertising, scattering about unbelievably.
Closer examination reveals the problem. The powers with the greatest claimed reduction in variance are the ones with the greatest admixtures of higher order harmonics. Peering yet closer, one finds that not only for these powers, but for all the others as well, the greatest reduction in variance occurs when some higher order harmonic is mixed in with unusually high weight. The behaviour is clearly spurious, an artefact of the compression ferreting out harmonic combinations that random errors in the covariance matrix have made appear artificially good.
The problem appears generic: wherever the reduction in variance is greatest, it is least believable. So ends our tale of failed ambition.
| () | () | () | () | () | () | |||||||||||
|---|---|---|---|---|---|---|---|---|---|---|---|---|---|---|---|---|
is the median wavenumber of the band-power window, and and the wavenumbers where the band-power window falls to half its maximum. At linear scales, , the median and half-maximum points are those of the scaled and discretized band-power windows as defined in Hamilton & Tegmark (2000). At nonlinear scales, , the band-powers have the power law times Gaussian form detailed in Section 3.7. is the estimated power in the band-power, and its uncertainty.
| () | () | () | |||||||||||
|---|---|---|---|---|---|---|---|---|---|---|---|---|---|
is the pair separation, the correlation function. and are not limits, but rather they are the Fourier transforms of the extremes of the correlated power from Table 1. Notice that is not always less than , and that and do not necessarily encompass the central value .
| () | () | () | () | () | () | |||||||||||
|---|---|---|---|---|---|---|---|---|---|---|---|---|---|---|---|---|
See footnote to Table 1. At linear scales the estimates of prewhitened power have been decorrelated. At nonlinear scales inaccuracies in the covariance matrix prevent full decorrelation, but it would not be unreasonable to treat the estimates of prewhitened power as uncorrelated or nearly so.