A Shock-Induced PDR in the HH 80/81 Flow. Far Infrared Spectroscopy.0
Abstract
The two spectrometers on board the Infrared Space Observatory were used to observe the Herbig-Haro objects HH 80, 81 and 80N, as well as their candidate exciting source IRAS 18162-2048. The fine structure lines of [Oi]63m, [Oi]145m and [Cii]158m are detected everywhere, while [Nii]122m and [Oiii]88.3m are only detected toward the HH objects; line ratios confirm for the first time the collisionally excited HH nature of HH 80N. No molecular line is detected in any of the observed positions. We use a full shock code to diagnose shock velocities v100 km s-1 toward the HH objects, as expected from the optical spectroscopy. Since proper motions suggest velocities in excess of 600 km s-1, the HH objects probably represent the interface between two flow components with velocity differing by vs. Aside from the flow exciting source, the [Cii]158m line is everywhere brighter than the [Oi]63m line, indicating the presence of a Photo-Dissociation Region (PDR) all along the flow. Continuum emission from the HH objects and from other positions along the flow is only detected longword of 50m, and its proportionality to the [Cii]158m line flux suggests it is PDR in origin. We propose that the FUV continuum irradiated by the HH objects and the jet is responsible for the generation of a PDR at the walls of the flow cavity. We develop a very simple model which strengthens the plausibility of this hypothesis.
Subject headings:
Stars: formation - (ISM:) Herbig-Haro objects - ISM: individual objects: HH 80/81 - Infrared: ISM: lines and bands1. Introduction
Stellar jets and outflows arising from low mass protostellar objects are considered ubiquitous, since essentially each protostar must go through an active period of mass loss to get rid of its angular momentum to become a star (c.f. Hartmann har98 (1998)). These outflows are well collimated and supersonic and interact mostly through shocks with the interstellar medium. When these shock excited regions are detected by optical means, they are identified as Herbig-Haro objects (Reipurth & Heathcote RH97 (1997)).
The process of mass loss for intermediate and high mass protostellar objects is less well understood (Churchwell chur98 (1998)). Observationally very few of these objects have collimated optical jets or well defined molecular outflows (Poetzel, Mundt & Ray PMR89 (1989); Shepherd & Churchwell SC96 (1996)). The Herbig-Haro 80-81 system, which is driven by a 20 000 IRAS source, is one of those rare cases with a well collimated supersonic jet that reaches flow velocities of km s-1(Martí et al. MRR95 (1995), MRR98 (1998)). HH 80/81 are at the edge of the L291 cloud in Sagittarius (Reipurth & Graham RG88 (1988)) at an estimated kinematical distance of 1.7 kpc (Rodríguez et al. rodri80 (1980)). At this distance the HH 80/81 system, with an angular size of 10′.8, spans pc. The proper motion measurements confirm that IRAS 18162-2048 is the source driving the outflow, which is part of a small cluster of infrared sources (Aspin & Geballe AG92 (1992); Aspin et al. aspin94 (1994)). IRAS 18162-2048, given its large luminosity, is likely to become a B type star. Most of the early work on HH 80/81 was performed at radio wavelengths, where 3.6 and 6 cm observations found the collimated radio jet emanating from IRAS 18162-2048, as well as a section of the counter-flow, named HH 80N, which is optically invisible (Rodríguez& Reipurth RR89 (1989); Martí, Rodríguez & Reipurth MRR93 (1993), hereafter MRR93).
Recently Heathcote, Reipurth & Raga (HRR98 (1998), hereafter HRR) have carried a detailed analysis of HH 80/81 morphology and kinematics, using HST WFPC2 images and ground based optical images and spectra. They concluded in their study that the emission arising from HH 80/81 is due to shocks with velocities up 600 km s-1. The energy release by such shocks is so high that thermalizes the gas to temperatures K, i. e. the shocks are adiabatic. If the HH objects were to resemble bow shock structures (Raga & Böhm RB86 (1986); Hartigan et al. HRH87 (1987)), then the optical emission observed in H or [Oiii] 5007 comes from the ‘wings’, while the stagnation region (the tip of the bow) is several times further ahead and invisible. This scenario, however, is derived by modeling the optical line profiles (HHR98); from the morphological viewpoint, the HH objects appear as irregular knots that do not resemble wings of a bow.
In this study we present ISO (Kessler et al. Ketal96 (1996)) spectroscopic observations of the HH 80/81/80N system, including their exciting source IRAS 8162-2048. The observations and data analysis are presented in 2 and the results in 3. A model to interpret the results is presented in 4 and discussed in 5. We summarize our conclusions in 6.
2. Observations
| Object | (B1950) | (B1950) | AOTs & TDTs | |
|---|---|---|---|---|
| IRAS 18162-2048 | ON | 18 16 12.9 | 20 48 49 | LWS01-32901362 |
| OFF S | 18 16 12.9 | 20 50 29 | LWS01-32901362 | |
| OFF N | 18 16 12.9 | 20 47 09 | LWS01-32901362 | |
| HH 80 | 18 16 06.8 | 20 53 06 | LWS01-32901350, SWS01-32901351 | |
| HH 81 | 18 16 07.4 | 20 52 23 | LWS01-32901360, SWS01-32901361 | |
| HH 80N | 18 16 20.7 | 20 42 53 | LWS01-32901363 |
We used the two spectrometers on the ISO satellite to observe several locations along the HH 80/81 flow, including the candidate exciting source IRAS 18162-2048. The Long Wavelength Spectrometer (LWS, Clegg et al. Clegg96 (1996)) was used in its LWS01 grating mode to acquire full low resolution (R 200) 43-197m scans. Data were collected every 1/4 of a resolution element (equivalent to 0.07m for 90m, and to 0.15m for 90m) with 0.5s integration time; a total of 24 scans were accumulated, corresponding to 48s integration time per spectral element. LWS data processed through Off-Line Processing (OLP), version 7, have been reduced using the LWS Interactive Analysis111LIA is available at http://www.ipac.caltech.edu/iso/lws/lia/lia.html (LIA) Version 7.2. The dark current and gain for each detector were re-estimated, and the data were recalibrated in wavelength, bandpass and flux. The absolute flux calibration for LWS in grating mode is 10% (ISO Handbook, iv, 4.3.2).
The Short Wavelength Spectrometer (SWS, de Graauw et al. DGetal96 (1996)) was used in its SWS01 “Speed 2” grating mode. In this mode the grating is moved faster than the detector reset time, with a loss of about a factor 7 (ISO Handbook, vi 3.3) in achievable spectral resolution, resulting in R. The total observing time was about 1900s. SWS data were processed using OSIA, the SWS Interactive Analysis222OSIA is available at http://www.mpe.mpg.de/www_ir/ISO/observer/osia/osia.html . Dark currents and photometric checks were revised. The March 1998 bandpass calibration files have been used to produce the final spectra. The accuracy of the SWS absolute flux calibration varies between 7% and 35% from 2 to 40m (ISO Handbook, vi 5.4.2).
The final steps of data analysis were done using the ISO Spectral Analysis Package333ISAP is available at http://www.ipac.caltech.edu/iso/isap/isap.html (ISAP) Version 1.6a for both LWS and SWS. Grating scans (LWS) and detectors spectra (SWS) were averaged using a median clipping algorithm optimised to flag and discard outliers mainly due to transients. The LWS spectra were heavily fringed, and standard techniques available under ISAP were used to remove these instrumental effects. Line fluxes were estimated by means of gaussian fitting.
Table 1 lists the observed positions, which are also reported in Fig. 1 as the centers of the dashed circles (the LWS FWHM beamsize) superimposed on the 6 cm VLA map of MRR93). The last column reports the Astronomical Observation Template (AOT) used, together with the 8-digits unique identifier of the observation (TDT).

3. Results
All objects were detected with the LWS, while no line or continuum is detected with the SWS toward HH 80 and 81. Table 2 lists the measured fluxes for the detected lines; upper limits are given at the 1 level. The distance between HH 80 and 81 is about one half of the LWS beamsize (80′′ FWHM at most wavelengths, see ISO Handbook, iv 4.10.1) implying that each object contributes roughly half of its flux (lines and continuum) to the observed flux of its neighbour. Contamination corrected fluxes for HH 80 and 81 are listed just below the observed ones for each line.
| Line | IRAS 18162-2048 | HH 80 | HH 81 | HH 80N | ||
|---|---|---|---|---|---|---|
| ON | OFF S | OFF N | ||||
| [Oi]63m | 104(2) | 7.1(0.5) | 8.0(0.3) | 6.4(0.2) | 7.1(1.0) | 8.2(0.2) |
| 3.8bbfootnotemark: | 5.2bbfootnotemark: | |||||
| [Oi]145m | 10.6(0.7) | 0.3(0.1) | 1.0(0.2) | 0.4(0.1) | 0.32(0.04) | 0.7(0.2) |
| 0.3bbfootnotemark: | 0.16bbfootnotemark: | |||||
| [Oiii]88.3m | 4 | 0.3 | 0.4 | 0.8(0.4) | 1.0(0.4) | 1.0(0.2) |
| 0.4bbfootnotemark: | 0.8bbfootnotemark: | |||||
| [Nii]122m | 1 | 0.3 | 0.2 | 0.35(0.08) | 0.53(0.07) | 0.7(0.1) |
| 0.11bbfootnotemark: | 0.47bbfootnotemark: | |||||
| [Cii]158m | 37(1) | 16.3(0.3) | 20.4(0.3) | 11.49(0.06) | 12.53(0.08) | 17.1(0.1) |
| 6.97bbfootnotemark: | 9.04bbfootnotemark: |
A glance at Table 2 is sufficient to identify the basic results of our observations and set the guidelines for the interpretation of our data. First of all we note that the [Nii]122m and [Oiii]88.3m lines are only detected toward the HH objects; these observations provide the first direct evidence for the collisionally excited HH nature of HH 80N. Although the LWS pointing toward IRAS 18162-2048 encompasses the radio-brightest portions of the thermal jet, no lines from ionised species (other than [Cii]158m, but see below) are detected. We verified that the [Nii]122m and [Oiii]88.3m lines detected toward the HH objects would still be detectable toward IRAS 18162-2048, in spite of the higher photon noise from this more intense continuum source. Secondly, molecular emission is not detected anywhere. Finally we note that with the exception of IRAS 18162-2048, the [Cii]158m line is everywhere brighter than the [Oi]63m line. The detected lines are reported in Fig. 2 for the HH objects pointings, and in Fig. 3 for the three central observed positions of the flow.


3.1. The Herbig-Haro Objects

The HH 80/81 system is the most powerful flow known to emanate from an intermediate mass Young Stellar Object (YSO). Velocities in excess of 600 km s-1 are derived from proper motion measurements both in radio continuum (Martí, Rodríguez & Reipurth MRR95 (1995), MRR98 (1998)) and optical lines (HRR). In addition, line profile analysis of high-dispersion optical spectra suggests shock velocities 650 km s-1 (HRR). Interestingly enough however, optical spectra only reveal lines from species up to double ionisation state. Our FIR spectroscopy has the immediate advantage that reddening corrections, which are critical in the optical regime especially in this highly extincted region (HRR), are not important. To diagnose the shock conditions toward HH 80, 81 and 80N, we compare our observations with the predictions from plane parallel atomic shock models. The shock models were calculated using MAPPINGS2, a code developed by Binette et al. (Binette, Dopita, & Tuohy BDT85 (1985)), which has been thoroughly tested (Pequignot pequi86 (1986)).
A grid of models was created changing the pre-shock density between 102 and 104 cm-3, consistent with values derived by HRR from optical lines analysis. Shock velocity were varied between 60 and 110 km s-1; higher values, although still compatible with results from optical line ratios (HRR), fail to produce lines like [Nii]122m and [Oiii]88.3m which are instead observed toward the HH objects. The preshock degree of ionisation and magnetic field strength were kept fixed at 0.1 and 10G respectively. These values are not critical for the velocities we used (but see HRR 8.2) and represent typical values for stellar jets (but see Bacciotti & Eislöffel BE99 (1999)) from low-mass YSOs; we will assume they are also valid for higher-mass systems like the one we are presently delaing with. This selection of initial values also allow us to gauge our models with those of Hartigan, Raymond and Hartmann (HRH87 (1987)). In all instances solar abundances were used, since this is a reasonable assumption for Herbig-Haro objects (Beck-Winchatz, Böhm, Noriega-Crespo BBNC96 (1996)). Fig. 4 clearly show that shock velocities between 90 and 110 km s-1 are appropriate to reproduce the emitted spectra for all HH objects. Pre-shock densities between 100 and 1000 cm-3 are derived, in full agreement with estimates from HRR. In these conditions of low density J-shocks (Draine D80 (1980)) negligible cooling is expected from molecular lines like CO, H2 and H2O (Hollenbach & McKee HM89 (1989)), in agreement with our observations. Furthermore, the absence of FIR molecular emission also rules out the presence of a significant C-type shock component, for which H2, CO and H2O molecular lines would be the main coolants (e.g., Kaufman & Neufeld KN96 (1996)).
These low velocity shocks plus the width of the observed optical lines suggested to HHR that the HH 80/81 objects correspond to “wings” of a highly adiabatic bow shock that strikes the surrounding gas at km s-1; in such wings the shock front would be oblique with respect to the direction of motion, resulting in lower shock velocities. A shock velocity of km s-1 and flow velocities (from the proper motions) as high as 600 km s-1 can be also reconciled if one considers that the mass loss from the protostar is time dependent, and that the observed configuration of HH 80/81 was preceded by previous ejection events. If this is the case, the new ejected gas finds the circumstellar gas already in motion, and it is the interaction between these two flows that can create relative shock velocities of km s-1 or so (Raga et al. raga90 (1990); Stone & Norman, SN93 (1993)). Multi-epoch VLA observations (Martí, Rodríguez & Reipurth MRR95 (1995), MRR98 (1998)) of the jet’s radio knots provide supporting evidence for episodic mass loss from IRAS 18162-2048.
A similar process has been invoked to understand the flow characteristics of the HH 1/2 system, where the proper motions are as high as 450km s-1 in both atomic and molecular H2 gas (Herbig & Jones HJ81 (1981); Rodríguez et al. rodri90 (1990); Eislöffel, Mundt & Böhm eis94 (1994); Noriega-Crespo et al. nori97 (1997)), but the shock themselves are km s-1 (Hartigan et al. HRH87 (1987); Noriega-Crespo, Böhm & Raga nori89 (1989)). In the HH 1/2 outflow, however, there is clear evidence of a previous outburst event marked by the presence of an older bow shock structure times farther away from central outflow source (Ogura ogura95 (1995)).
3.2. The Jet
The LWS pointing toward IRAS 18162-2048 encompasses the base of the radio thermal jet, which is the strongest radio emitter in the flow. Yet no [Oiii]88.3m or [Nii]122m emission is detected, indicating that the ionised material of the jet is at a lower temperature compared to HH 80, 81 and 80N, or that the ionisation does not result from shocks. Interestingly, the radio spectral index of the jet is consistent with that of an ionised wind, but significantly differs from that of the HH objects which instead manifest a possible synchrotron component (MRR93). This behavior is different from that of the HH 1/2 system, for instance, where the central source VLA 1 (Pravdo et al. Petal85 (1985)) has a similar positive radio spectral index to that of HH 80/81 jet, but for the HH objects themselves it is flat, indicating optically thin free-free emission (Rodríguez et al. rodri90 (1990)).
3.3. The PDR


In the shock conditions diagnosed by our FIR spectroscopy (see Sect. 3.1), [Cii]158m contributes about 20% of the [Oi]63m cooling. Since [Cii]158m is everywhere brighter than [Oi]63m (except toward IRAS 18162-2048) the [Cii]158m emission must have another origin, namely PDR. Evidence for a PDR-like emission is also offered by the FIR continua detected toward the HH object and the OFF positions (the latter cannot be entirely justified with contamination by the stronger continuum source IRAS 18162-2048). Fig. 5 shows the SEDs observed toward all pointed positions with the LWS. We note that the continuum observed toward the two OFF positions cannot be justified with contamination from IRAS 18162-2048. The continua from HH 80 and 81 have been corrected for reciprocal contamination (see enf of §2), and detector spectra have been stitched for cosmetic purposes.
In a PDR, electrons are released in the gas phase by FUV-irradiated dust grains via the photoelectric effect and heat the gas (Tielens & Hollenbach TH85 (1985)). Theory and observations generally agree on the fact that between 0.1% and 1% of the incident FUV flux is converted into gas heating via this mechanism, and subsequently released mainly via “cooling” of the [Cii]158m line. The rest of the incident field is absorbed by dust and reprocessed to FIR wavelengths. We see from Fig. 5 that the observed SEDs contain the bulk of FIR emission, so that their integral is a good representation of the reprocessed FUV field; the ratio of observed [Cii]158m to the integrated SEDs yields values 0.0020.013, in very good agreement with expectations for a PDR. The only obvious exception is IRAS 18162-2048, whose SED is dominated by radiation from the central YSO.
Assuming that the pre-shock densities diagnosed for the HH objects (Sect. 3.1) represent the average conditions surrounding the HH 80/81 flow, we can use the observed [Cii]158m flux to estimate the intensity of the irradiating FUV field. Using the Web Infrared Tool Shed (Wolfire et al.) and assuming complete filling of the LWS beam with filling factor of unity we estimate G0 200, 400, 30 000, 200, 40 and 30 for the 6 LWS pointings from north to south (see Fig. 1), where G0 is the FUV field intensity expressed in units of 1.610-3 ergs cm-2 s-1 (Habing H68 (1968)). In these conditions the PDR emission could account for most of the [Oi]63m and [Oi]145m fluxes everywhere along the flow, including the HH objects. In this case the [Oi]63m/[Oi]145m ratios would imply densities cm-3.
We searched several degrees around the HH 80/81 area for OB stars which could be responsible for this irradiation level, finding none. An obvious candidate is of course IRAS 18162-2048 itself. Assuming a B0 ZAMS spectral class (MRR93), the resulting FUV field at the various LWS pointings would be G0 450 at OFF-N and OFF-S, and 60 at the HH objects; the agreement with the G0 values estimated from the [Cii]158m line can be considered satisfactory. K-band images of IRAS 18162-2048, however, clearly resolve the IRAS source in a small cluster of at least 3 sources (Aspin et al. aspin94 (1994)); redistribution of the total bolometric luminosity of the IRAS source among the cluster members, adopting the IMF from Miller & Scalo (MS79 (1979)), would assign only half of this luminosity to the most massive member of the cloud (e.g., Molinari et al. Metal00 (2000), and references therein). This decreases the Lyman continuum photon flux by more than one order of magnitude and reduces G0 by nearly two orders of magnitude, ruling out IRAS 18162-2048 as the PDR illuminating source.
An intriguing possibility is that the illuminating sources for the observed PDR emission are the HH objects and the jet. In Fig. 6 we report the [Cii]158m line flux as a function of the 6 cm flux measured by MRR93. The filled symbols represent the HH objects and IRAS 18162-2048; for each object we consider the radio knots encompassed by the LWS beam at each position. The correlation between FCii and F6cm would seem to suggest that the ionised material and the amount of cooling by the PDR maybe somehow related. We note that the two OFF positions do not fit with the correlation in Fig. 6. In the next paragraph we will propose a semi-empirical model to verify and quantify the Radio-PDR connection.
4. A Model for the Shock/JetPDR Connection
The influence of shock-originated radiation on the surrounding medium in HH flows is not clear. NH3 and HCO+ enhancements have been detected in the vicinity of HH 80N, HH 1 and HH 2 (Girart et al. Getal94 (1994), Getal98 (1998); Davis, Dent & Bell Burnell Detal90 (1990); Torrelles et al. Tetal92 (1992), Tetal93 (1993)) and it has been suggested that the UV field generated in the HH shocks may be responsible. Wolfire & Königl (WK93 (1993)), and more recently Raga & Williams (RW00 (2000)), have shown that the chemistry of blobs in the vicinity of HH objects can be influenced by the passage of the HH object, although the predicted morphologies do not match the observations.
We propose a scenario where the ionised material which is recombining behind the shock front and in the jet, and which emits free-free radio continuum, is also responsible for a UV field which illuminates internally the walls of the flow cavity; a PDR is there produced, which mainly cools via the [Cii]158m line. If this is correct, then we should be able to express the two observables, i.e. the radio continuum flux and the [Cii]158m line flux, as a function of a set of physical parameters which characterize the HH shocks, the jet and the PDR.
Radio emission from shocked material has been modeled by Curiel, Cantó and Rodríguez (CCR87 (1987)); in the optically thin regime, the free-free emission from the recombination region can be written as
| (1) | |||||
where is the angular diameter in seconds of arc of the recombination region, T4 is the electrons temperature in units of 104K, is the pre-shock density in units of 10 cm-3, and is the shock velocity in units of 100 km s-1. This model applies to HH 80, 80N and 81, whose high ionization lines clearly trace a high velocity shock. In the absence of similar evidence toward the central source and the two OFF positions (Tab. 2), where the LWS beam encompasses most of the jet radio knots, we will assume that the ionisation does not results from shocks. Reynolds (R86 (1986)) developed a model to predict the properties of radio continuum emission from a collimated, ionised thermal jet. His expression of the radio flux at any specific frequency is a complicated function of jet parameters like the collimation, the density, temperature and ionization radial gradients, the initial distance where the jet is injected, the jet’s width at its base. Because we cannot independently fix any of these parameters, the diagnostic power of this model will be very limited in the present case.
Let us now quantify the energy released by the shock recombination region, in the portion of the UV continuum, between 912Å and 2066 Å(or between 13.6eV and 6eV), which is effective in PDR illumination. It is widely accepted (Dopita, Binette & Schwartz DBS82 (1982)) that the dominant contribution to UV continuum in this wavelength range comes from hydrogenic 2s1s two-photon decay. Theoretical models (Shull & McKee SM79 (1979), also confirmed by our grid of computed shock models (§3.1)) suggest that two-photon emission from He0 and He+ can be neglected in comparison. The H0 two-photon emissivity is given by
| (2) |
where is the Ly frequency. P is the probability, symmetrical around , that a photon is emitted with frequency and for which we adopted the analytical approximation of Nussbaumer & Schmutz (NS84 (1984)). N2s is the population density of level 2s and can be found equating the recombination rate from higher states to 2s, with the total 2s1s two-photon decay rate. We obtain (Emerson E96 (1996)):
| (3) |
where Ne and Ni are the electron and ion number densities, and A s-1 is the two-photon transition probability. The total recombination coefficient to all hydrogen excited levels can be written as (Hummer & Seaton HS63 (1963)):
| (4) | |||||
where T4 is T/104 K. Using Eqs. (2), (3) and (4), we are able to write the power radiated by the recombination region in the FUV as:
| (5) |
Vrec is the volume of the recombination region, while is a factor which accounts for a collisional enhancement of the 2s level population above the values predicted by pure recombination. Such an enhancement can be determined from a comparison of the predicted two-photon spectrum with the observed UV continuum from HH objects. Dopita, Binette & Schwartz (DBS82 (1982)) find values ; interestingly, is found to be inversely proportional to the degree of excitation of the HH object as measured, e.g., from the [Oiii]5007Å/[Oi]6300Å ratio. Eq. (5) makes the implicit assumption that the ionised clump is optically thin to the FUV radiation. It is easy to show that for typical dust grains of radius 0.1m and density of 3 gcm-3, the optical depth along the diameter of a spherical clump of radius and particle density can be written as:
| (6) |
where is in cm-3, is in seconds of arc and the distance is in parsecs. In the FUV range the absorption coefficient Q (Draine & Lee DL84 (1984)), and for the typical parameters that we will derive (see Table 3) we obtain . We emphasize that this number refers to the longest path across the clump, so only a small portion at the far side of the clump, with respect to any line of sight, will be only partially thick.

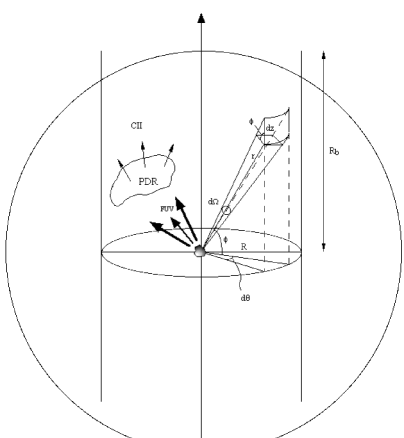
The FUV field emitted by the HH object is intercepted by the flow cavity walls, and a PDR is there formed. A fraction of the incident FUV field is predicted by PDR models (Tielens & Hollenbach TH85 (1985)) to be reradiated via the [Cii]158m line; our observations allow us to determine (§ 3.3) values of in very good agreement with model predictions. Since we want to compare the predicted [Cii]158m line flux radiated by this PDR with our ISO-LWS observations, we are interested in the portion of the flow cavity which is encompassed by the instrument field of view. In other words, we need to estimate the fraction of the LFUV emitted by the HH object which is intercepted by the flow cavity in our LWS beam. The situation is sketched in Fig. 7, which serves as reference for the following discussion. R is the radius of the cavity, and Rb is the radius of the ISO-LWS beam. For simplicity, we will assume the HH object lying at the center of our coordinate system as pointlike with respect to R. The element solid angle at the cavity wall as seen from the origin is
| (7) |
where the cos factor accounts for the projection, perpendicular to the line of sight from the origin, of the element area of the cavity wall. Expressing and as functions of and , we obtain
| (8) |
The total solid angle under which the HH object sees the internal cavity walls (from z=-Rb to z=Rb) is obtained by integrating Eq. (8) over 2 in d, and from -arctan(Rb/R) to arctan(Rb/R) in d. The FUV field is emitted isotropically, so that
| (9) |
We can finally write the predicted flux of the [Cii]158m line from a system at the distance D as:
| (10) |
5. Discussion
5.1. The Herbig-Haro Objects
| Object | rHH | R | FUV | n | |||||
|---|---|---|---|---|---|---|---|---|---|
| (′′) | (′′) | (km s-1) | (G0) | (cm-3) | |||||
| HH 80 | 0.011 | 5 | 10 | 100 | 2 | 170 | 4200 | 13 | |
| HH 81 | 0.013 | 5 | 10 | 100 | 2 | 180 | 4500 | 10 | |
| HH 80N | 0.007 | 5 | 10 | 100 | 2 | 670 | 8400 | 13 |
To understand which are the critical parameters in our model, it is useful to show in Fig. 8 a diagnostic diagram that presents the relationship between our two observable quantities, F6cm and FCii, for various parameters sets. We will first consider the case of the HH objects, where Eq. (1) holds for the emitted radio continuum flux. For each grid in Fig. 8, the horizontal lines are sites of constant density ( in cm-3) while the vertical lines indicates constant = compression ratio (density over pre-shock density). The full-line grid is computed for =100 km s-1, =2, =0.007 and rHH=5′′. Decreasing the shock velocity to 70 km s-1shifts the grid to lower radio fluxes (dashed), while a lower FUVCii, , conversion factor brings it down in [Cii]158m flux (dash-dotted, the opposite effect is obtained by raising the enhancement factor). Decreasing the radius of the HH object influences both quantities (dotted). We find no appreciable effect from the particular choice of the cavity radius R. It is reassuring that for reasonable choices of the model parameters we can reproduce the 6cm and [Cii]158m fluxes observed toward the HH objects. The number of free parameters in our model can be significantly decreased thanks to the available observational evidence. The value of for each object has been determined using our FIR continuum and [Cii]158m measurements (§.3.3). The radius of the HH objects is taken from the radio maps of MRR93; the objects are clearly resolved, and the full size (after a tentative beam deconvolution) is 10′′. The value of is computed using its relationship (Dopita, Binette & Schwartz DBS82 (1982)) with the degree of excitation measured by the [Oiii]5007Å/[Oi]6300Å ratio; we use the [Oiii]5007Å and [Oi]6300Å line fluxes from HRR to derive values of 2 for the HH objects and 13 for the jet. We adopt shock velocities of 100 km s-1 for all HH objects from the measured [Oiii]88.3m/[Nii]122m ratio. Model results are weakly dependent on the cavity radius, for which we adopt a fiducial value of R=10′′. We can then vary the plasma density and to fit the data, and the results are in Cols. 8-10 of Table 3.
For all HH objects we obtain densities which are below 104cm-3, for which collisional population would depress the two-photon continuum due to Ly decay. The presence of a transverse ( ) magnetic field limits the compression ratio; we can write (Hollenbach & McKee HM79 (1979))
| (11) |
Using the parameters from Table 3 we see that varies from 100 to 200 G. We ran additional shock models using these large values and found that the only way to reproduce the observed line ratios is to assume a pre-shock ionization fraction . This is higher than the higher values (0.2-0.3) found toward several HH-jets by Bacciotti & Eislöffel (BE99 (1999)); on the other hand the HH 80/81 flow is the most powerful in its class and may be peculiar in its ionization fraction as well.
5.2. The Jet
As far as the other positions along the jet are concerned, our model has less diagnostic power because of the high number of free parameters in the Reynolds (R86 (1986)) model for radio emission from ionised jets.

Fig. 9 is the analogous for the jet of Fig. 8, where grids of models are plotted as a function of density in cm-3 and half-width w0, in arcseconds, of the jets at its base. While and are kept fixed to 0.002 (from our observations) and 13 (see above), the jet parameters are essentially free. The full-line grid represent the “pressure-confined” jet in Reynolds terminology, where the density, temperature and ionization radial gradients of the jet have values [qn, qT, qx]=[-0.9, -0.6, -0.5]; in this particular jet the degree of collimation, expressed by a number which controls the jet’s width as a function of radial distance (w), is . Another critical parameter, which we cannot independently fix, is the distance from the central source where the jet is injected; the full-line grid in Fig. 9 is obtained for r0=10 . This model predicts too much radio flux compared to the observations; other classes of standard models in Reynolds study are even less successful. Although of uncertain physical meaning, other combinations of the jet parameters can bring the predicted radio fluxes closer to the values observed along the HH 80/81 jet. Steepening the density gradient to qn=-2 (dotted grid) will decrease the radio flux by more than an order of magnitude; a less pronounced effect in the same direction is obtained by decreasing the temperature gradient to, e.g., qT=-1 (dashed grid). Providing additional collimation by lowering down to, e.g., 0.2 (dashed-dotted grid), will also contribute to a better match between the model and the data. Finally, decreasing the jet-injection distance from the source, r0, will also work toward lowering the predicted radio flux. Although there is no single set of jet parameters that can fit the data, our model suggests steep density and/or temperature radial gradients along the jet, as well as a very high degree of collimation which is not ruled out by the observations (MRR93). Looking at the shape of the models grids in Fig. 9, it seems that a single jet model, i.e. a single model grid, cannot reproduce the [FCii, F6cm] values of IRAS 18162-2048 and the two OFF positions. This is not due to the misalignment between the observed OFF positions and the jet axis. A better alignment would not have changed the radio flux (which we arbitrarily assigned based on the 6 cm map of MRR93); likewise, a half-LWS beam shift in the ISO observed positions would certainly not result in a one order of magnitude decrease of the [Cii]158m line fluxes, as required to bring the OFF positions onto the model grid in Fig. 9. Rather, it is plausible that the central (brighter) portion of the jet considerably contributes to the FUV irradiation of the flow cavities at the two OFF positions. This would indeed correspond to increasing the assigned radio flux to the two OFF positions in Fig. 9.
5.3. The FCii-F6cm relationship
Although it was one of the motivations to develop our model, one of the consequences of the model is that a FCii-F6cm relationship is difficult to justify. The radio flux has a different origin in the HH objects and the jet, there is a priori no reason why IRAS 18162-2048 (where we model the radio flux as coming from a jet) should line up with the three HH objects (where we model the radio flux as coming from the post-shock region) in Fig. 6. The relative position of the HH objects themselves is also a priori depending on a high number of free parameters. Based on four points only, we must then conclude that the FCii-F6cm relationship in Fig. 6 appears to be fortuitous. However, we will check for similar occurrences in other HH/jet systems where [Cii]158m data are available and where the densities are low enough ( cm-3) that a shock/jetPDR connection can be expected.
6. Conclusions
We have performed a far-IR spectroscopic study of the HH 80/81 system. Line ratio analysis confirms for the first time the Herbig-Haro nature of the nebulosity HH 80N, which probably represents the head of the counterflow to HH 80 and 81. We reveal shock velocities of the order of 100 km s-1 in correspondence with the HH objects, while lower excitation conditions appear to be present elsewhere along the radio jet. A comparison with proper motion velocities in excess of 600 km s-1 indicate that the shocks arise at the interface between two fast-moving flows.
Besides shock-excited emission, an important PDR contribution is present all along the bipolar flow, where densities below 104 cm-3 are also diagnosed. Using a simple model, we have provided quantitative arguments supporting the idea that the FUV field radiated by the ionised material of the recombination regions in the HH objects and of the jet emanating from IRAS 18162-2048, is able to induce the formation of a PDR in the immediately surrounding medium (i.e. the flow cavity walls). This would provide further evidence that the jet/HH own radiation field affects its surrounding medium in a measurable way. Attempts to model the chemistry of outflows should not ignore the influence of the radiation field of the shocks responsible for the acceleration of the outflow itself.
References
- (1) Aspin, C., & Geballe, T.R. 1992, A&A, 266, 219
- (2) Aspin, C., Puxley, P. J., Blanco, P. R., et al. 1994, A&A, 292, L9
- (3) Bacciotti, F., & Eislöffel, J. 1999, A&A, 342, 717
- (4) Beck-Winchatz, B., Böhm, K.H., & Noriega-Crespo, A. 1996, AJ, 111, 346
- (5) Binette, L., Dopita, M.A., & Tuohy, I.R. 1985, ApJ, 297, 476
- (6) Churchwell, E. 1998 in “The Origin of Stars and Planetary Systems”, ed. C.J. Lada & N.D. Kylafis, p515
- (7) Clegg, P.E., Ade, P.A.R., Armand, C., et al. 1996, A&A, 315, L38
- (8) Curiel, S., Cantó, J., Rodríguez, L.F. 1987, Rev. Mexicana Astron. Af., 14, 595
- (9) Davis, C.J., Dent, W.R.F., Burnell, S.J. Bell 1990, MNRAS, 244, 173
- (10) de Graauw, T., Haser, L.N., Beintema, D.A., et al. 1996, A&A, 315, L49
- (11) Dopita, M.A., Binette, L., Schwartz, R.D. 1982, ApJ, 261, 183
- (12) Draine, B.T. 1980, ApJ, 241, 1021
- (13) Draine, B.T., Lee, H.M. 1984, ApJ, 285, 89
- (14) Eislöffel, J., Mundt, R., & Böhm, K.H. 1994, AJ, 108, 1042
- (15) Emerson, D. 1996, “Interpreting Astronomical Spectra”, Wiley & Sons, Chichester, England
- (16) Girart, J.M., Rodríguez, L.F., Anglada, G., et al. 1994, ApJ, 435, L145
- (17) Girart, J.M., Estalella, R., Ho, P.T.P. 1998, ApJ, 495, 59
- (18) Habing, H.J. 1968, Bull. Astr. Inst. Netherlands, 19, 421
- (19) Hartmann, L. 1998 in “Accretion Processes in Star Formation”, Cambridge University Press, p.13
- (20) Hartigan, P., Raymond, J., & Hartmann, L. 1987, ApJ, 316, 323 (HRH87)
- (21) Heathcote, S., Reipurth, B., Raga, A. 1998, AJ, 116, 1940 (HRR)
- (22) Herbig, G.H., & Jones, B.F. 1981, AJ, 86, 1232
- (23) Hollenbach, D., McKee, C.F. 1979, ApJS, 41, 555
- (24) Hollenbach, D., McKee, C.F. 1989, ApJ, 342, 306 (HM89)
- (25) Hummer, D.G., Seaton, M.J. 1963, MNRAS, 125, 437
- (26) Kaufman, M.J., Neufeld, D.A. 1996, ApJ, 456, 611
- (27) Kessler, M.F., Steinz, J.A., Anderegg, M.E., et al. 1996, A&A, 315, L27
- (28) ISO Handbook, http://www.iso.vilspa.esa.es/users/handbook/
- (29) Martí, J., Rodríguez, L.F., Reipurth, B. 1993, ApJ, 416, 208 (MRR93)
- (30) Martí, J., Rodríguez, L.F., Reipurth, B. 1995, ApJ, 449, 184
- (31) Martí, J., Rodríguez, L.F., Reipurth, B. 1998, ApJ, 502, 337
- (32) Miller, G.E., Scalo, J.M. 1979, ApJS, 41, 513
- (33) Molinari, S., Brand, J., Cesaroni, R., Palla, F. 2000, A&A, 355, 617
- (34) Noriega-Crespo, A., Böhm, K.H, & Raga, A.C. 1989, AJ, 99, 1918
- (35) Noriega-Crespo, A., Garnavich, P.M., Curiel, S., Raga, A.C., & Ayala, S. 1997, ApJ, 486, L55
- (36) Nussbaumer, H., Schmutz, W. 1984, A&A, 138, 495
- (37) Ogura, K. 1995, ApJ, 450, L230
- (38) Pequignot, D. 1986 in “Workshop on Model Nebula”, Observatoire de Paris, D. Péquignot ed. p363
- (39) Poetzel, R., Mundt, R., & Ray, T.P. 1989, A&A, 224, L13
- (40) Pravdo, S.H., Rodríguez, L.F. , Curiel, S., Cantó, J., Torrelles, J.M., Becker, R.H., Sellgren, K. 1985, ApJ, 293, L35
- (41) Raga, A.C., & Böhm, K.H. 1986, ApJ, 308, 829
- (42) Raga, A.C., Binette, L., Canto, J., & Calvet, N. 1990, ApJ, 364, 601
- (43) Raga, A.C., Williams, D.A. 2000, A&A, 358, 701
- (44) Reynolds, S.P. 1986, ApJ, 304, 713
- (45) Reipurth, B., & Grahman, J.A. 1988, A&A, 202, 219
- (46) Reipurth, B. & Heathcote, S. 1997 in “Herbig-Haro Flows and the Birth of Low Mass Stars”, ed. B. Reipurth & C. Bertout, p3
- (47) Rodríguez, L.F. ,& Reipurth, B. 1989, RevMexA&A, 17, 59
- (48) Rodríguez, L.F., Moran, J.M., Ho, P.T.P., & Gottlieb, E. W. 1980,ApJ, 235, 845
- (49) Rodríguez, L.F., Curiel, S., Ho, T.P., Torrelles, J.M., & Cantó, J. 1990,ApJ, 352, 645
- (50) Shepherd, D.S., Churchwell, E. 1996, ApJ, 472, 225
- (51) Shull, J.M., McKee, C.F. 1979, ApJ, 227, 131
- (52) Stone, J.M. & Norman, M.L. 1993, ApJ, 413, 210
- (53) Tielens, A.G.G.M., Hollenbach, D. 1985, ApJ, 291, 722
- (54) Torrelles, J.M., Rodríguez, L.F., Cantó, J., et al. 1992, ApJ, 396, L95
- (55) Torrelles, J.M., Gómez, J.J., Ho, P.T.P., et al. 1993, ApJ, 417, 655
- (56) Wolfire, M.G., Königl, A. 1993, ApJ, 415, 204
- (57) Wolfire, M.G., Pound, M.W., Mundy, L., Lord, S.D. 2000, http://wits.ipac.caltech.edu