A Monte Carlo Study of the 6.4 keV Emission at the Galactic Center
Abstract
Strong fluorescent Fe line emission at 6.4 keV has been observed from the Sgr B2 giant molecular cloud located in the Galactic Center region. The large equivalent width of this line and the lack of an apparent illuminating nearby object indicate that a time-dependent source, currently in a low-activity state, is causing the fluorescent emission. It has been suggested that this illuminator is the massive black hole candidate, Sgr A*, whose X-ray luminosity has declined by an unprecedented six orders of magnitude over the past years. We here report the results of our Monte Carlo simulations for producing this line under a variety of source configurations and characteristics. These indicate that the source may in fact be embedded within Sgr B2, although external sources give a slightly better fit to the data. The weakened distinction between the internal and external illuminators is due in part to the instrument response function, which accounts for an enhanced equivalent width of the line by folding some of the continuum radiation in with the intrinsic line intensity. We also point out that although the spectrum may be largely produced by K emission in cold gas, there is some evidence in the data to suggest the presence of warm ( K) emitting material near the cold cloud.
keywords:
Galaxy: center — Galaxy: abundances — ISM: clouds — ISM: individual (Sgr B2) — X-rays: ISMSubmitted to the Astrophysical Journal Letters
1 INTRODUCTION
The Galactic Center (GC) contains several constituents whose mutual interactions account for a broad range of complex phenomena (e.g., Melia 1994). Among these, the nonthermal radio source Sgr A*, which appears to be coincident with the peak in the dark matter concentration (e.g., Haller et al. 1996; Eckart & Genzel 1997; Ghez et al. 1998), is of special interest since its properties suggest it is a massive () black hole. In this context, the unusually strong iron fluorescent emission detected at 6.4 keV near Sgr A*, particularly from the Sgr B2 giant molecular cloud located some pc away, has raised some interesting questions regarding its origin and its possible diagnostic value for understanding the high-energy behavior of the central engine.
The GC is characterized by the presence of giant molecular clouds having mean volume densities of and gas temperatures on the order of 60 K (Lis & Carlstrom (1994)). X-ray observations of this region carried out by (Koyama et al. (1996); Murakami et al. (2000)) and SAX (Sidoli (1999)) have revealed a source of bright Fe fluorescent K line radiation within Sgr B2, whose radius is pc and whose total enclosed mass is (Lis & Carlstrom (1994)). This fluorescent emission has a very large equivalent width ( keV) and a peak around 6.4 keV. The surrounding continuum is quite flat, and shows strong absorption below keV and a sharp iron K absorption feature at keV.
The large equivalent width is key to understanding the nature of the fluorescent emission (Sunyaev & Churazov (1998)). X-ray fluorescence is due to illumination of cloud material by an X-ray source. For a steady source embedded within a gaseous cloud, an upper limit to the equivalent width is keV (e.g., Fabian (1977); Vainshtein & Sunyaev (1980)), rather insensitive to the parameters chosen. Therefore, in the case of Sgr B2, we are necessarily dealing with either a source external to the cloud or a time-dependent internal source whose flux has diminished, allowing the continuum to fade away relative to the line intensity. An additional argument in favor of a time-dependent illuminator is currently the absence of any bright X-ray source in the vicinity of Sgr B2 with sufficient luminosity to produce the observed fluorescence (e.g., Sidoli (1999); Murakami et al. (2000)); it seems that the illuminating object, whether internal or external to the cloud, must have undergone a decrease in X-ray flux to its current quiescent state. Certainly, the SIGMA survey of this region (Vargas et al. 1996) has indicated that several sources may remain difficult to detect due to their overall faintness and variable behavior.
It is tempting to invoke Sgr A* as the external illuminator of Sgr B2, which would then provide some measure of its recent variability at X-ray energies. Motivated by the Sgr B2 spectral characteristics and the source morphology, which show that the emission is strongest on the side of the cloud closest to Sgr A*, Murakami et al. (2000) suggested that we may be witnessing evidence of the black hole’s activity some years ago (the light travel time from the nucleus to Sgr B2). These authors modeled a reflection spectrum using approximations for the photon transfer equations and obtained a decent fit to the observed spectrum. However, it is important to note that this modeling is only a rough approximation, neglecting multiple Thomson scatterings and assuming isotropic reflection. It is also limited by the fact that it does not explore the possibility that the X-ray sources are internal to the cloud or that they are time-dependent, which would provide important comparative results for fully testing the idea that Sgr A* was the transient high-energy source illuminating the fluorescing region.
There are several reasons for taking a skeptical view of Sgr A* as the X-ray illuminator. First and foremost, this would require a change in its X-ray luminosity by a factor of about in hundred years (from erg s-1, Sunyaev & Churazov (1998), to the currently observed value of erg s-1). Secondly, we are reminded of the fact that no other molecular cloud in the region, with the exception of the Sgr A shell, displays any significant Fe K emission (Koyama et al. (1996); Sidoli (1999)). In the case of the Sgr A shell, the K line has a much smaller equivalent width ( eV), easily explained by, e.g., a steady X-ray source embedded within the cloud. It is therefore our intention in this Letter to explore alternative scenarios for the illumination of Sgr B2, using time-dependent X-ray sources both internal and external to the cloud, with Monte Carlo methods to accurately model the spectrum.
2 METHODOLOGY
To simulate the X-ray spectrum formed under a wide range of conditions, we use a modified version of Leahy & Creighton’s (1983) monte.f code. We have rewritten this algorithm, originally designed to handle a time-steady photon transfer from internal sources, to allow for blackbody and thermal bremsstrahlung continua, a time-dependence due to non-steady illuminators, and the presence of both internal and external X-ray sources. A very important addition is that the escaping photons are now convolved with the GIS response function and assigned to actual GIS energy bins (rather than arbitrary logarithmic energy intervals), enabling a direct comparison with the actual data.
The photon propagation within the cloud, including the effects of electron scattering, absorption, and fluorescence, is handled as in monte.f (c.f. Leahy & Creighton (1993) for a full description). In particular, the bound-free absorption cross-sections are taken from Morrison & McCammon (1983), the elemental abundances are from Dalgarno & Layzer (1987), and the fluorescence yields are those given by Bambynek et al. (1972).
For blackbody and thermal bremsstrahlung spectra the photon distribution function is too complex to allow direct Monte Carlo sampling. Instead, we use rejection methods described in Press et al. (1992) to generate photons. We choose a simpler function (called the comparison function) such that it lies above everywhere within the relevant range of energies. The comparison function is sampled using standard Monte Carlo techniques to determine an energy . If
| (1) |
where and are pre-defined lower and upper energy bounds, we multiply by a standard deviate . When
| (2) |
we accept the result and a photon is generated with energy . If not, we reject the result and repeat the process until conditions (1) and (2) are satisfied.
A blackbody spectrum of temperature has a normalized photon distribution function , where and both and are measured in keV. To generate this spectrum, we choose the piece-wise continuous comparison function
| (3) |
Note that we have normalized such that
| (4) |
We approximate the thermal bremsstrahlung photon distribution function with cut-off temperature as , with defined as above; our piece-wise continuous comparison function is then
| (5) |
In this case, the normalization is such that
| (6) |
To model time dependence, we assume that the source has undergone a period of intense emission that has diminished over a time interval much smaller than the light-crossing time of Sgr B2. In this limit, we create all photons at time and track their travel time between interactions within the cloud. Upon the last interaction, an additional time , where r is the location of the photon at last interaction and n is the directional vector of the escaping photon, is added to each photon. This factor represents the geometrical time lag for an escaping photon to reach the observer; similar lags appear in, e.g., reverberation mapping of active galactic nuclei (Blandford & McKee (1982)). Escaping photons are then assigned to time bins of width , where is the cloud radius, with spectra being constructed for each of these time bins.
For simplicity, we assume that Sgr B2 is a uniform spherical cloud; its optical depth and elemental abundances are allowed to vary, as well as the shape of the illuminating X-ray spectrum and the source location. The flux density is also kept as a free parameter, since fixing this would require further assumptions about the nature of the X-ray source, which is not necessary for the modeling we describe here.
We consider both internal and external sources. The former are assumed to lie at the center of the cloud and to emit isotropically, therefore maintaining spherical symmetry. The escaping photons are binned only in time, as there is no need for angular bins due to the isotropy. The external sources are assumed to lie at a distance much greater than the radius of the cloud, so that incoming photon distribution is roughly plane parallel. The cloud is located with its center at the origin, and photons are incident from -axis. They enter the sphere at polar angle , where is a random deviate chosen for each photon; the azimuthal angle is chosen randomly for each photon. Each incident photon is assigned an initial time , representing the geometrical time lag for the photon to reach the sphere’s surface. As spherical symmetry has been broken, escaping photons are binned in ; we typically use four bins of width each. Azimuthal symmetry is retained, so no binning is necessary.
The modeled spectra are compared to the background-subtracted data of Murakami et al. (2000). These observations were made using during October 1993 and September 1994. The escaping photons are convolved with the GIS response function and binned according to the observed energy intervals. Each model run consists of several million photons, and the spectra are constructed for each time and bin.
3 RESULTS
In this section, we describe illustrative (reasonable) fits to the data. Because there is a wide range of parameter values giving acceptable results and because the results are sensitive to, e.g., our selection of time and angular bin boundaries, it is not yet worthwhile attempting to make a best fit, which is unlikely to be the “unique” solution. In addition, our use of a cold emitting gas appears to be lacking a key ingredient of the observed emission (c.f., Section 4), making a best-fit analysis premature.
3.1 Internal Sources
An internal source must have a spectrum that drops off steeply at higher energies in order to explain the observed flat continuum. This is because the absorption cross-section decreases at higher energies; there must be fewer incident photons at these energies in order for the escaping continuum to remain flat. We find that blackbody and thermal bremsstrahlung sources, with their exponential cut-offs, provide decent fits to the data.
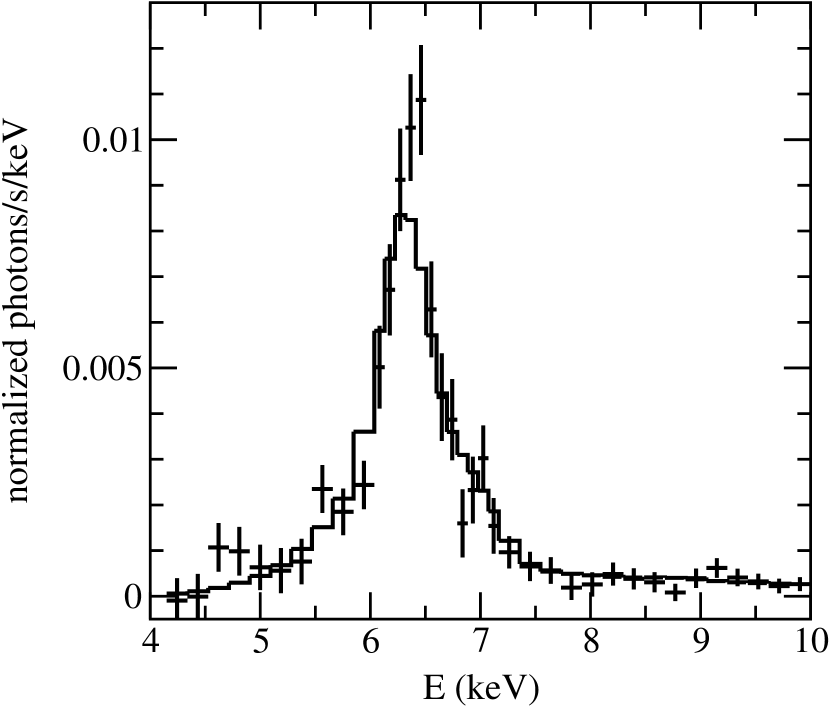
Figure 1 shows reasonable fits for blackbody (left) and thermal bremsstrahlung (right) internal sources. In both cases, we used a cloud optical depth of and elemental abundances enhanced to three times the local ISM values. The blackbody and bremsstrahlung illuminating spectra have keV and keV, respectively, and both have been allowed to evolve over time. The output spectra illustrated here are those that would be observed at time (blackbody) and (bremsstrahlung). Note that the first photons escape the sphere at . The fits lack an emission component at keV. For these models, we obtain (33 d.o.f.) for the blackbody and (33 d.o.f.) for the bremsstrahlung illuminators.
3.2 External Sources
Unlike the case of the internal sources, where the illuminator must apparently have a time-dependent luminosity, we find that both time-steady and time-dependent external sources provide good fits to the data. The best fits have incident spectra with , where , although there is much leeway here. We note that for , thermal bremsstrahlung spectra have , so a hot, external bremsstrahlung source is certainly a possibility.
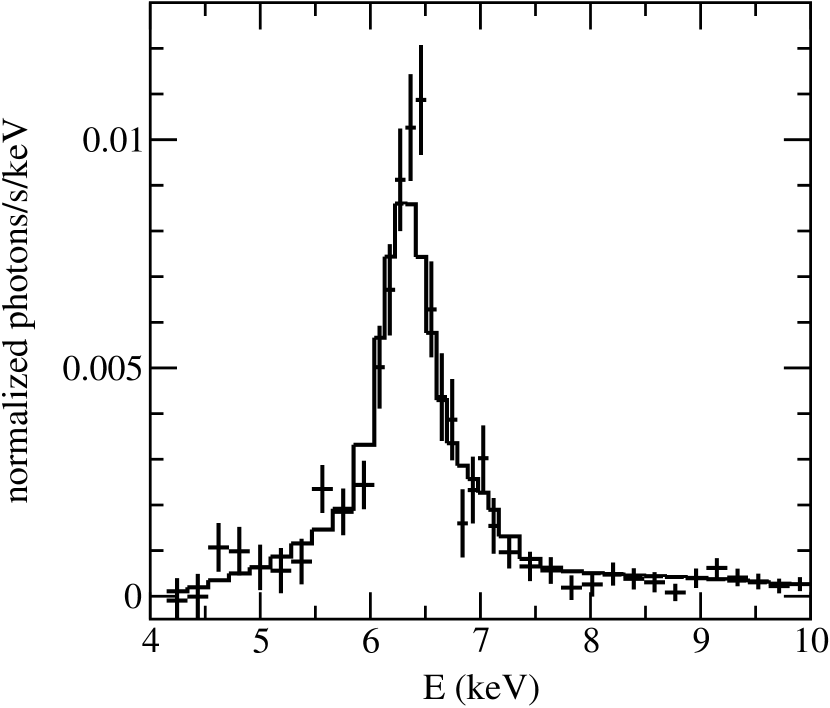
Figure 2 shows reasonable fits for time-steady (left) and time-dependent (right) external sources. In both models, we used , a cloud optical depth of , and elemental abundances enhanced to three times the local ISM values. The spectra plotted are for , although the spectra are nearly as good. In the time-dependent model we are looking at the spectrum formed during the period , which is early in the time-evolution and therefore (not surprisingly) quite similar to the time-steady case. The fits appear to be slightly better than those of the internal models, with (33 d.o.f.) for the steady source and (33 d.o.f.) for the time-dependent source. Although not as apparent here, these spectra also lack an emission component at keV.
4 DISCUSSION
We have shown that the bulk of the iron fluorescent emission can be explained by either internal or external X-ray sources, though internal sources must be time-dependent; over time the line-emission becomes stronger relative to the continuum, giving an approaching the observed value. External sources may be time-steady or time-dependent, as it is possible to obtain a large by angular selection effects. However, a time-steady illuminator may be unlikely due to the current lack of an obvious source near Sgr B2, with the possible exception of 1E 1743.1-2843, which lies only 63 pc (in projection) away (e.g., Murakami et al. 2000).
The fact that internal sources are viable illuminators for the fluorescence in Sgr B2 is due in part to the limited energy resolution of the ASCA GIS detector. Although the equivalent width of the Fe 6.4 keV line is smaller for an internal source than for an external illuminator, this situation changes when the calculated spectrum is convolved with the detector response function. It is evident from Figures 1 and 2 that both internal and external sources give reasonable fits to the data. Thus future observations, e.g., with XMM, can in principle distinguish between these two types of sources and help resolve the question of whether the iron line fluorescent emission in Sgr B2 does indeed indicate a past high-energy activity in Sgr A*.
All the calculations reported here lack an emission component at keV. It is possible that the appearance of this spectral feature is simply an artifact due to an incomplete background subtraction (since the Sgr B2 background is very inhomogeneous). If it is real, however, it may indicate emission from “warm” iron species (c.f., Nagase (1989)), in an ionization state Fe 20 or greater. Based on ionization calculations carried out with CLOUDY (Ferland (1996)), we find that these “warm” species exist only at temperatures on the order of K. Gas at these high temperatures is unlikely to coexist with the cold cloud material, so one possibility is that it constitutes a transition layer between Sgr B2 and the hot ( K) plasma surrounding it. However, thermal conduction models seem to suggest that such a layer would be too thin to produce significant emission (Cowie & McKee (1977)). Future observations may provide better clues to this puzzle.
5 ACKNOWLEDGMENTS
We thank Hiroshi Murakami for providing the GIS data. We also thank Rashid Sunyaev, Lara Sidoli and Sandro Mereghetti for their helpful discussions. This work was supported by an NSF Graduate Fellowship at the University of Arizona, by a Sir Thomas Lyle Fellowship and a Miegunyah Fellowship for distinguished overseas visitors at the University of Melbourne, and by NASA grants NAG5-8239 and NAG5-9205 at the University of Arizona.
References
- Bambynek et al. (1972) Bambynek, W., Ceasemann, B., Fink, R. W., Fink, H.-U., Mark, H., Swift, C. D., Price, R. E., & Rao, P. V. 1972, Rev. Mod. Phys., 44, 716
- Blandford & McKee (1982) Blandford, R. D., & McKee, C. F. 1982, ApJ, 255, 419
- Cowie & McKee (1977) Cowie, L. L., & McKee, C. F. 1977, ApJ, 211, 135
- Dalgarno & Layzer (1987) Dalgarno, A., & Layzer, D. 1987, Spectroscopy of Astrophysical Plasmas (Cambridge: Cambridge University Press)
- Eckart & Genzel (1997) Eckart, A. & Genzel, R. 1997, MNRAS, 284, 576
- Fabian (1977) Fabian, A. 1977, Nature, 269, 672
- Ferland (1996) Ferland, G. J. 1996, Hazy, a Brief Introduction to CLOUDY (University of Kentucky, Department of Physics and Astronomy Internal Report)
- Ghez et al. (1998) Ghez, AM., Klein, BL., Morris, M. & Becklin, EE. 1998, ApJ, 509, 678
- Haller et al. (1996) Haller, J., Rieke, M., Rieke, G., Tamblyn, P., Close, L., & Melia, F. 1996, ApJ, 456, 194
- Koyama et al. (1996) Koyama, K., Maeda, Y., Sonobe, T., Takeshima, T., Tanaka, Y., & Yamauchi, S. 1996, PASJ, 48, 249
- Leahy & Creighton (1993) Leahy, D. A., & Creighton, J. 1993, MNRAS, 263, 1993
- Lis & Carlstrom (1994) Lis, D. C. & Carlstrom, J. E. 1994, ApJ, 424, 189
- Melia (1994) Melia, F. 1994, ApJ, 426, 577
- Morrison & McCammon (1983) Morrison, R., & McCammon, D. 1983, ApJ, 270, 119
- Murakami et al. (2000) Murakami, H., Koyama, K., Sakano, M., Tsujimoto, M., & Maeda, Y. 2000, ApJ, 534, 283
- Nagase (1989) Nagase, F. 1989, PASJ, 41, 1
- Press et al. (1992) Press, W. H., Teukolsky, S. A., Vitterling, W. T., & Flannery, B. P. 1992, Numerical Recipes in C: The Art of Scientific Computing, 2nd Ed. (Cambridge: Cambridge University Press)
- Sidoli (1999) Sidoli, L. 1999, Dissertazione: X-Rays from the Galactic Center Region: A Study with the BeppoSAX satellite (Università Degli Studi di Milano, Dipartimento di Fisica)
- Sunyaev & Churazov (1998) Sunyaev, R., & Churazov, E. 1998, MNRAS, 297, 1279
- Vainshtein & Sunyaev (1980) Vainshtein, L., & Sunyaev, R. 1980, Sov. Astron. Lett., 6, 673
- Vargas et al. (1996) Vargas, M., et al. 1996, AA Supplements, 120, 291