85-GHz BIMA observations of the double-hotspot radio galaxy 3C 20
Abstract
We present 85-GHz observations of the archetypal double-hotspot radio source 3C 20 made with the BIMA millimetre array. The resolution of BIMA allows us to separate the two components of the eastern hotspot. By comparing the BIMA observations with existing VLA data, we show that the spectra of the two hotspot components are very similar, despite the clear differences in their radio structure and their wide separation. We discuss the implications for models of double hotspot formation. Weak emission from the lobes of 3C 20 is detected at 85 GHz, at a level consistent with the predictions of standard spectral ageing models.
keywords:
radio continuum: galaxies – galaxies: jets – galaxies: individual: 3C 201 Introduction
In the beam model for powerful extragalactic double radio sources, hotspots (the bright compact regions at the ends of the source) are the visible manifestation of a strong shock as the relativistic beam of energetic particles is suddenly decelerated by interaction with the external medium surrounding the radio lobes.
This model is challenged by the observation that the lobes of radio galaxies and quasars very frequently have more than one hotspot. To account for this, we must either assume that the beam end-point moves about from place to place in the lobe (the ‘dentist’s drill’ model of Scheuer 1982) or that material flows out from the initial impact point of the beam to impact elsewhere on the lobe edge [the ‘splatter-spot’ model of Williams & Gull (1985) or the jet-deflection model of Lonsdale & Barthel 1986]. Both these models predict that one of the hotspots, the one associated with the first termination of the jet, should be more compact than the other or others; it is in fact observed that where jets are explicitly seen to terminate, they always do so in the most compact, ‘primary’ hotspot (Laing 1989, Leahy et al. 1997, Hardcastle et al. 1997). But from single-wavelength radio observations it is very difficult to distinguish between different models of multiple hot spot formation.
One area in which different models do make different predictions is that of the high-frequency spectra of the secondary (less compact) hotspots. If these are relics left behind by the motion of the jet, as in the ‘dentist’s drill’ model, then in general we expect shock-driven particle acceleration to have ceased [though, as pointed out by Cox, Gull & Scheuer (1991), it is possible for a disconnected hotspot to continue to be fed for some time if the disconnection occurs at a significant distance upstream]. Synchrotron losses will then deplete the high-energy electrons in the secondary hotspot, so that the secondary hotspot is expected to have a steeper high-frequency spectrum than the primary. If secondary hotspots continue to be fed by outflow from the primary hotspot, then there is still an energy supply and particle acceleration will continue to operate.
To have the best chance of distinguishing between models using these spectral differences we must observe at the highest available frequencies, since the synchrotron lifetime of an electron emitting at a frequency is proportional to . Observations show that (primary) hotspots often have a spectral cutoff around the mm-wave region of the spectrum, perhaps corresponding to a maximum electron energy attained by the acceleration process. Mm-wave observations therefore provide one of the best opportunities to test the different models of multiple hotspot formation.
Only a few multiple-hotspot sources have been observed at millimetre wavelengths with resolution sufficient to distinguish between the components of the hotspot complex. Two such sources are the nearby luminous classical double Cygnus A, 3C 405 (Wright & Birkinshaw 1984, Wright & Sault 1993) and the peculiar radio galaxy 3C 123 (Looney & Hardcastle 2000), both of which show close hotspot pairs (separated by a projected distance of about 8 kpc and 5 kpc respectively). In both these cases the radio-to-mm spectra of the two hotspots were found to be identical within the errors; there was no evidence for a steeper spectrum in the secondary hotspot.
In this paper we present 85-GHz observations of a well-known double-hotspot radio galaxy, 3C 20. The double hotspot in the E lobe of this object was one of the earliest to be resolved in radio observations (Jenkins, Pooley & Riley 1977; Laing 1981), because of the components’ large angular separation (6.5 arcsec, corresponding to 27 kpc). It has since been well observed with the NRAO Very Large Array (VLA) at various radio frequencies (e.g. Hiltner et al. 1994, hereafter H94; Hardcastle et al. 1997; Fernini et al. 1997). Its 8.5-GHz radio hotspot structure is shown in Fig. 1. The western hotspot, which lies on what is believed to be the jet side (Hardcastle et al. 1997) and is actually a more compact hotspot pair (or possibly a single hotspot with an extended tail) is known to be a mm-wave and optical source (H94, Meisenheimer et al. 1989, Meisenheimer, Yates & Röser 1997) with a spectrum which cuts off in the optical. But the eastern hotspots were not detected in the optical (H94, Meisenheimer et al. 1997) and until now they have not been observed at high radio frequencies.
Throughout the paper we use a cosmology with km s-1 Mpc-1 and . With this cosmology, 1 arcsecond at the distance of 3C 20 corresponds to 3.99 kpc. Spectral index is defined in the sense , and denotes the two-point spectral index between frequencies of and .
2 Observations and data analysis
3C 20 was observed in the B and C configurations of the 10-element BIMA array111The BIMA array is operated by the Berkeley Illinois Maryland Association under funding from the U.S. National Science Foundation.. The data were taken on 1999 Oct 11 (C array) and 1999 Oct 30 (B array), with the correlator configured to give two 800-MHz bands centred on 83.15 and 86.60 GHz. These were combined in the final images to give an effective frequency of 84.87 GHz. Combining the B- and C-configuration data gives good coverage of the uv plane between 2.2 and 66 k, so the resulting images have a resolution of about 3 arcsec and are sensitive to structures up to arcsec in size, well matched to the largest angular size of 3C 20.
The data were processed using the MIRIAD package (Sault, Teuben, & Wright 1995). Amplitudes were calibrated using observations of Uranus (B-array) and Mars (C-array) to bootstrap the flux density of the phase calibrator, the quasar 0136+478, which was set to 3.68 Jy. The uncertainty in the amplitude calibration is estimated to be about 7 per cent.
Final images were produced using the AIPS task IMAGR, and are shown in Fig. 2. The western hotspot and the two eastern hotspots are clearly detected, and (as shown in Fig. 2b) there is also some low-surface-brightness emission from both the lobes of 3C 20. The weak radio core is not detected at 85 GHz. The net flux density of the source at 85 GHz is about 0.21 Jy. This is somewhat lower than the 90-GHz flux density of 0.51 Jy quoted by Steppe et al. (1988), but the error on the value of Steppe et al., though not given explicitly in their paper, is certainly large.
3 VLA observations
To compare our data with observations at longer wavelengths, we obtained existing VLA data or images at 1.4, 4.9, 8.5 and 15 GHz. The 1.4 GHz image was taken from Leahy, Bridle & Strom (1998) based on unpublished observation by R.A. Laing with the VLA A configuration. The 8.5-GHz data were described by Hardcastle et al. (1997) and used the VLA A, B and C configurations. We retrieved 4.9- and 15-GHz snapshot observations taken in 1987-88 from the VLA archive, using B and C configurations and C and D configurations respectively, and calibrated and reduced them in the standard manner within AIPS, using 3C 286 as the primary flux calibrator. The flux calibration is estimated to be accurate to within 2 per cent. [In the case of the D-configuration 15-GHz observations no scan on a suitable calibration source was made, and we calibrated the amplitude by reference to the radio galaxy 3C 123, whose 15-GHz total flux density we know (Looney & Hardcastle 2000).] All these datasets have shortest baselines k, well matched to the BIMA observations. For comparison with Fig. 2, in Fig. 3 we show VLA images at these four frequencies with a resolution of 3 arcsec.
4 Spectra
| Source | Method | Flux density (mJy) | |||||
|---|---|---|---|---|---|---|---|
| component | 1.4 GHz | 4.9 GHz | 8.5 GHz | 15 GHz | 85 GHz | 231 GHz | |
| W hotspot | Region | ||||||
| Gaussian | |||||||
| Compact | – | – | – | ||||
| Extended | |||||||
| NE hotspot | Region | ||||||
| Gaussian | – | ||||||
| Compact | – | – | – | ||||
| Extended | |||||||
| SE hotspot | Region | ||||||
| Gaussian | – | ||||||
| E lobe | Region | ||||||
In column 2, ‘Region’ implies that the measurements were made from direct integration of rectangular regions on 3-arcsec resolution maps, and the errors are derived directly from the off-source noise. ‘Gaussian’ implies that the measurements were made by fitting a Gaussian and background to the same maps, and the errors are the values returned by the AIPS task jmfit. ‘Compact’ implies that the flux density was determined by Gaussian-fitting to the highest-resolution radio maps, at resolutions of arcsec, and the errors are derived from Gaussian fitting with a variation in the choice of regions, as described by H94. ‘Extended’ implies that the flux densities are calculated by subtracting an extrapolation of the power-law spectrum of the ‘compact’ components from the flux densities measured by integration, as described in the text; the errors include a contribution (which dominates at high and low frequencies) from the calculated uncertainty on the best-fit slope. 4.9- and 15-GHz points marked with an asterisk are taken from H94; the 231-GHz data point marked with a dagger is from the IRAM observations of Meisenheimer et al. (1989).
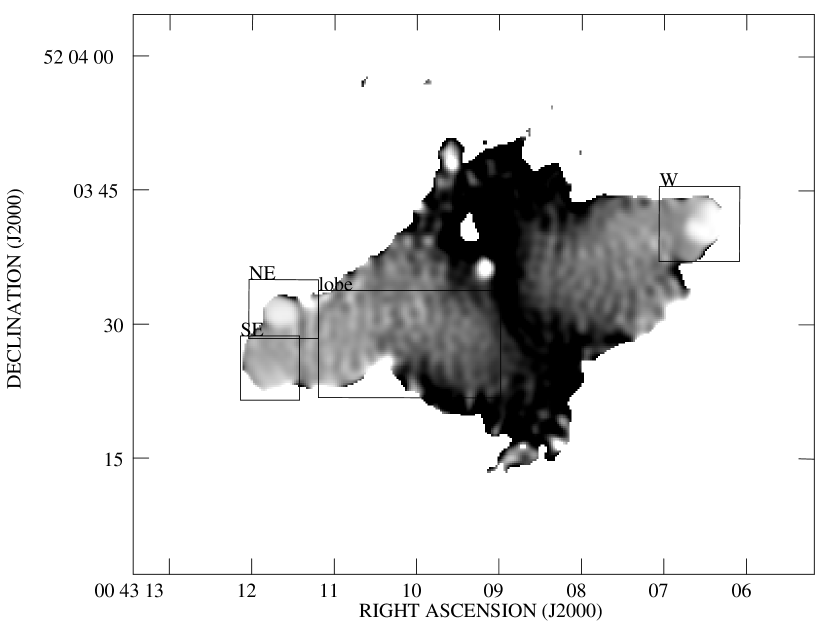
The low resolution of the BIMA data compared to the size of the compact hotspots of 3C 20 (Fig. 1) means that there is not a single obviously correct procedure for using these data to constrain the hotspot spectra. The 3-arcsecond beam certainly contains more than one spectral component in the case of the compact hotspot in the eastern lobe (hereafter the ‘NE hotspot’) and the compact pair of hotspots in the western lobe (the ‘W hotspot’), because these two components are surrounded by more or less diffuse emission with a steeper spectrum at cm wavelengths (Fig. 4) which may or may not contribute to the 85-GHz flux density. On the other hand, the secondary hotspot in the E lobe (the ‘SE hotspot’) might well be spectrally homogeneous, given its relaxed appearance at high resolution.
We have therefore chosen to make radio measurements of the flux densities of these components in several different ways. The first and most obvious involves making radio maps of similar resolution to the BIMA data (as in Fig. 3), and then integrating over fixed regions. In addition to the hotspots, we have measured a flux density from the E lobe of the source, weakly detected in the BIMA observations. The regions used are shown on Fig. 4. Secondly, we can also fit a Gaussian and background to identical regions centred on the hotspots. Both integration and Gaussian fitting will tend to produce values of radio flux density which include a contribution from the extended emission around the hotspot.
Thirdly, we can compare the 85-GHz flux densities to the radio flux densities of the most compact radio components only. This was the approach taken by Meisenheimer et al. (1989) in their study of the W hotspot. The assumption here is that the most compact component will be flat-spectrum and will dominate increasingly at higher frequencies. For this purpose we take flux density values for the compact hotspots at 4.9 and 15 GHz from H94, and measure values at 8.5 GHz by fitting a Gaussian and baseline to the full-resolution map of Fig. 1. This technique can be applied only to the W and NE hotspots. There is some ambiguity in applying it to the NE hotspot, which at high resolution has double structure (a bright component and a weak component separated by 0.3 arcsec), as shown in Fig. 1. For consistency with the values of H94 we tabulate the flux density of the brighter component only; for reference, the integrated 8.5-GHz flux density of the weaker component is about 23 mJy.
Results from these three approaches are tabulated in Table 1. The compact components in the NE and W hotspots are well fitted by power laws with spectral indices of and respectively – these values agree well with the two-point spectral indices of H94. There is no evidence for a spectral break at cm wavelengths as there was in the hotspots of 3C 123 (Looney & Hardcastle 2000).
In most cases flux densities measured by integrating regions of the source at 3-arcsec resolution are similar to fluxes derived from Gaussian fitting, as expected. In the remaining analysis we will only use the fluxes measured by integration.
4.1 The eastern double hotspot
It is immediately obvious from Table 1 that the overall spectral indices of the NE and SE hotspot components are quite similar; the spectral index over the full frequency range, , is for the NE hotspot and for the SE hotspot. The two spectra are plotted in Fig. 5. There is therefore no immediate evidence for differential spectral ageing in the more extended SE component. Could this just be due to contamination of the NE hotspot flux densities by steep-spectrum extended material included in the integration region? To test this, we subtracted the best-fit power-law spectrum of the compact components from the integrated flux densities, assuming that both compact components of the NE hotspot have the same power-law spectral index of 0.72. The resulting ‘extended’ flux densities for the NE hotspot are also tabulated in Table 1, and it can be seen that almost all the 85-GHz flux of the hotspot can be accounted for as an extrapolation of the spectrum of the compact components. The spectrum of the extended component of the NE hotspot is plotted in Fig. 5. The integrated spectrum of the NE hotspot can therefore consistently be modelled as a sum of compact, flat-spectrum () and extended, steep-spectrum () components, with the expended component possibly cutting off before 85 GHz. But it is clear that the spectrum of the SE component is consistently flatter than the spectrum of the extended component of the NE hotspot, except at low energies where they are comparable.
In detail, the spectrum of the SE hotspot is itself somewhat peculiar; the spectral index in the range 5–15 GHz is around , consistent with H94’s estimate of with a scatter of , but it then seems to flatten slightly, with . The inconsistency is only marginal, but it may indicate that a multi-component model is also necessary to explain the SE hotspot’s spectrum; perhaps the SE hotspot is also a superposition of flat- and steep-spectrum components. If so, it is puzzling that H94 find a relatively uniform spectral index across the hotspot, a result confirmed by our own maps of (Fig. 4); there is no obvious site for a flat-spectrum region.
What are the implications of these results for models of the double hotspot? We begin by modelling the spectrum of the compact component of the NE hotspot. Using an angular size derived from our fits to the 8.5-GHz map (which are consistent with the fits of H94), we can model the hotspot as a sphere of radius 380 pc. Assuming that the electron distribution follows a power law with a minimum energy of eV, that the electron power-law index is 2.44 (equivalent to the observed spectral index of 0.72), and that no protons are present in the hotspot, we obtain an equipartition222We feel justified in using equipartition arguments to estimate the field strengths in hotspots, given the detections of X-ray emission at levels consistent with inverse-Compton emission at equipartition in the hotspots of Cygnus A (Harris, Carilli & Perley 1994), 3C 295 (Harris et al. 2000) and 3C 123 (Hardcastle et al. in prep.). field strength fit of 36 nT. Using this, we can constrain the high-energy cutoff of the electron spectrum. The maximum value of the high-energy cutoff consistent with the upper limits on optical flux density derived by H94 is eV; the minimum possible high-energy cutoff if this component is to account for most of the 85-GHz flux density from the NE hotspot is around eV ( lower limit).
The secondary hotspot’s spectrum is not very consistent with an aged-synchrotron model, because of the flattening of the spectrum between 15 and 85 GHz. It is poorly fit even with a power-law model (best-fit with 3 degrees of freedom for , where the errors include a contribution from the uncertainty in the flux scales). If we take the slope of this fit as an indication of the ‘injection index’, the spectral index corresponding to the low-energy electron energy distribution power-law index, and we assume standard Jaffe & Perola (1973, hereafter JP) ageing in a 6-nT field (the equipartition value), then the 85-GHz data point allows us to rule out at the 99 per cent confidence level () ages for the SE hotspot greater than years; in other words, particle acceleration in the hotspot is either still going on (in which case a JP spectrum is not appropriate) or it ceased less than years ago. This gives a disconnection timescale of less than one per cent of the total age of the source inferred by spectral ageing methods from the spectrum of the oldest material (e.g. Stephens 1987) but, as we pointed out in our discussion of 3C 123 (Looney & Hardcastle 2000) numerical simulations show that hotspots are transient features on this sort of timescale. We note that if particle acceleration is going on in the hotspot, then this calculation does not tell us anything useful about the hotspot’s age. In this case we would expect a continuous injection (CI) spectrum rather than a JP spectrum (e.g. Pacholczyk 1970), and the position of the break in CI spectra does not bear the same simple relation to the ‘age’ of the electron population as the break in JP spectra.
In the next section we use this spectral information to discuss models for the formation of the double hotspot.
4.2 Models for the double hotspot
We can rule out what might be called a trivial dentist’s-drill model in which the jet, having made a single NE-type hotspot at the SE hotspot position, moves to the NE position and makes another, leaving the SE hotspot to expand. In this respect 3C 20 is an extreme example of the arguments put forward by e.g. Valtaoja (1984). The SE hotspot is not only slightly more luminous, but also very much larger than the NE hotspot; for the purposes of modelling, we treat it as a hemisphere of radius 2 arcsec (8 kpc). The ‘trivial dentist’s-drill model’ is then not supported by the energetics of the situation; the (equipartition) total energy in the SE hotspot is times greater than that in the NE hotspot (a point which we return to below). But it is even more strongly ruled out by expansion losses, without the need for the assumption of equipartition. To get from a component comparable to the NE hotspots to the SE hotspot by linear expansion, the expansion factor would need to be . Adiabatic losses coupled with magnetic field conservation (e.g. Longair, Ryle & Scheuer 1973) would mean that the radio flux density of the progenitor of the SE hotspot before expansion would have been absurdly high, a factor higher than its present value; but they would also mean that the high-energy cutoff in the hotspot would now be eV, based on the upper limit on the high-energy cutoff in the NE hotspot, which, given an equipartition field strength of nT estimated from the observations, is far too low to produce the observed 85-GHz emission from the SE hotspot. The secondary component in 3C 20 cannot have evolved by adiabatic expansion from a single primary with properties even slightly resembling those of the NE hotspot, given a simple geometry. The problem is only slightly alleviated if we consider less simple geometries for the emitting material in the southern hotspot.
Instead, we can consider a more sophisticated version of the dentist’s drill model, in which the jet termination point moves around in the region of the SE hotspot before switching to that of the current primary. In this case, the energy available to the SE hotspot is potentially that of a large number of components more similar to the NE hotspot, which reduces the problem of energetics. However, the adiabatic expansion argument is harder to evade in this way; the multiple versions of the primary hotspot left in the volume of the SE hotspot will all expand adiabatically once the jet moves on to the next one, and so each in turn will become fainter by a large factor. Clearly this model requires just on energetic grounds that the jet has dwelt in the region of the SE hotspot at least a hundred times as long as it has been powering the NE hotspot, and probably much longer once adiabatic losses are taken into account. For this model to be viable we therefore have to be seeing the source at a very special time in its history, and while this is not impossible it is not an explanation that we wish to adopt while others exist.
The other possible models all require that there is, or was until recently, long-term energy input into the SE hotspot from a source other than a ‘primary-type’ jet. The energy input may either be simple advection of pre-accelerated particles, or it may predominantly be in the form of kinetic energy of a beam, with particle (re)acceleration taking place in the SE hotspot. We comment on several possible models in turn.
-
•
Disconnected-jet models. In these models, described by Cox et al., the remains of a disconnected jet continue to power the secondary hotspot after a new primary has started to form. This would help to explain the low age of the material in the secondary hotspot. We see two problems with these models in the case of 3C 20. One is that the relaxed appearance of the hotspot suggests that there is not currently well-collimated energy input – a disconnected jet’s impact point should presumably look similar to a primary hotspot’s, since the material of the disconnected jet presently entering the hotspot does not ‘know’ that it has been cut off further upstream. The other is that this model does not help to account for the factor of 100 difference between the energy content of the SE and NE hotspots; like the dentist’s drill model, it requires that we are seeing the source at a special time.
-
•
Two-jet models. We cannot rule out the possibility that there are two jets, or a split jet, with a powerful but poorly collimated jet powering the secondary while a weak, well-collimated jet powers the primary. The only evidence against this is that the ‘secondary jet’ this would require has never yet been observed in any radio source.
-
•
Outflow from the primary. Laing (1982) was the first to point out that the SE hotspot is brightest in the region opposite the compact NE hotspot. That suggests that the secondary may be powered by direct outflow from the primary, as in the splatter-spot or redirected-outflow models. The light travel time from the primary to the secondary hotspot is years (the uncertainty is due to the unknown projection angle). So the age constraints derived above rule out simple advection of particles from the primary, unless they are transported at very high speeds () or in a low-loss channel. Instead, it seems most likely that energy is transported to the SE hotspot largely as bulk kinetic energy, in quite poorly collimated outflow from the primary, and that particle acceleration is ongoing there. (The flattening of the secondary hotspot spectrum between 15 and 85 GHz, and the fact that the secondary hotspot’s spectrum is flatter than that of the extended component of the primary, may provide some evidence for particle acceleration.) In this model, the energy content of each hotspot is a function not just of their history, but of the rate at which energy is transported out of the primary and of the efficiency of the particle acceleration process (there is no reason in principle why the primary cannot be significantly less efficient than the secondary in turning the bulk kinetic energy provided by the jet into internal energy of relativistic particles). The large difference between the energies of the two hotspots therefore does not need to be explained in terms of a special observing time in this picture.
We conclude that the model with the fewest objections against it is the outflow model, and therefore join Cox et al. (1991) in favouring that model for this source.
4.3 The western hotspot
The integrated spectrum of the W hotspot (Fig. 6) is not well modelled as a simple power-law. Since the region of the BIMA detection contains components with a wide range of spectral indices (Fig. 4), this is probably not surprising. Table 1 shows that the most compact component contributes less than 20 per cent of the total flux density of the integration region even at 15 GHz. The northern ‘tail’ of the compact hotspot (Fig. 1) contributes slightly less, about 150 mJy at 8.5 GHz. If we assume the tail and hotspot have the same power-law spectral index of (H94 suggest a steeper spectrum for the northern tail, but this may in part be an effect of a steep-spectrum background) then we can subtract off an extrapolation of the compact components to obtain the estimate of the ‘extended’ spectrum tabulated in Table 1 and plotted in Fig. 6. Like the extended spectrum of the NE hotspot, this is not well fitted either by a power-law model or by an aged-synchrotron model. But the spectral shapes of the W and NE extended components are similar, which suggests that the same sort of physical processes (perhaps related to escape from the compact hotspots) are at work.
4.4 The lobes
Fig. 4 shows that the lobes of 3C 20 have steep spectra, which is conventionally attributed to spectral ageing. Some authors have questioned whether the spectra of lobes can really be described in this way. Katz-Stone, Rudnick & Anderson (1993) show that colour-colour diagrams (where the spectral indices for one pair of frequencies are plotted against the spectral indices for another) are useful indicators of whether sources follow any of the standard ageing models, which correspond to well-defined lines in the colour-colour plane; they argue that colour-colour diagrams for Cygnus A are not consistent with any of the standard ageing models. Rudnick (1999) gives a summary of the problems of spectral ageing.
In Fig. 7 we plot a colour-colour diagram for 3C 20, using the 1.4-, 4.9- and 8.5-GHz VLA data, together with lines showing the tracks of JP aged synchrotron spectra with injection indices of 0.5 and 0.75. The results are quite similar to those of Katz-Stone et al. The bulk of the source material can be adequately modelled as a JP aged synchrotron spectrum (with an injection index ) but at flat spectral indices the source deviates from the expected spectrum; we do not see points which are described by an un-aged power law with . In 3C 20, unlike Cygnus A, some source material is well described as a simple power law, but this has . Breaking down the points in Fig. 7 by source region, we find that the points with and are all in the hotspot regions shown in Fig. 4, with the points being contributed by the W hotspot. The points with and , which can be modelled with a JP spectrum, are essentially all in the lobes of the source. The observation that there are no points with thus corresponds to the observation that spectral ages in the lobes of other FRII sources often do not extrapolate back to zero age as distance from the hotspots tends to zero (Alexander 1987, Alexander & Leahy 1987). Stephens (1987) found a similar effect in a low-resolution spectral age study of 3C 20.
The outstanding questions raised by Fig. 7 are:
-
1.
Is the apparently adequate description of the lobes with JP aged synchrotron spectra indicating the real underlying physics, or is it a coincidence? If the lobes really are simply aged material,
-
2.
why is the injection index of the lobes apparently different from the (flatter) injection indices in the compact hotspots, and
-
3.
why do we see no source material which has a simple power law spectrum with spectral index equal to the injection index; equivalently, why is there no zero-age material with the injection index which appears to characterize the lobes?
Since the hotspots are transient features, question (ii) can be avoided, if necessary, by noting that the injection index of the present-day hotspots need not be the same as the injection indices of the hotspots present at the time that the lobe material was accelerated. Alexander (1987) suggests that the answer to question (iii) may be that the effects of losses in the comparatively high field of the hotspot are exaggerated by adiabatic expansion, which for linear expansion by a factor moves the break frequency down by a factor if magnetic flux is conserved. For as suggested by Alexander in the case of 3C 234, this would imply that we should start to see ageing in the mm region of the hotspot spectra, for which there is no convincing evidence in the case of 3C 20; however, because of the low resolution of our BIMA observations, we cannot really rule out the presence of steeper-spectrum regions around the flat-spectrum hotspots.
An answer to question (i) is beyond the scope of this paper, but we note that the observation of 85-GHz emission from the lobe region is very consistent with the predictions of a JP aged model (Fig. 8); if the similarity to a JP spectrum is a coincidence, it is one which extends over a wide range of frequencies.
5 Conclusions
BIMA observations of the double hotspot of 3C 20 resolve the two components of the hotspot and, together with archival VLA data, show that their radio spectra are very similar over the full range studied; 3C 20 in this respect is similar to other double hotspot sources like 3C 405 and 3C 123 previously studied with BIMA. The detailed spectrum of the secondary hotspot in 3C 20 provides some evidence that particle acceleration is continuing, and this, together with the relaxed and edge-brightened appearance of the secondary in high-resolution radio maps, causes us to conclude that the most likely model for this source is one in which the secondary is generated by direct outflow from the primary hotspot; this outflow can be relatively slow and poorly collimated compared to the jet.
Both the eastern and western compact (primary) hotspots are bright sources at 85 GHz, and it seems likely that there is some emission at this frequency from the regions around them as well. Our radio observations agree with H94’s statement that the radio spectrum of the eastern primary is slightly but significantly steeper than that of the W primary, but the 85-GHz observations are consistent with the primary hotspots being otherwise similar at high frequencies; in fact, our estimated upper limit on the high-energy cutoff in the compact component NE hotspot is exactly consistent with the high-energy cutoff required to produce the observed optical emission from the compact component of the W hotspot, if the flatter injection index and slightly higher equipartition field strength in the W hotspot are taken into account. Further observations at frequencies intermediate between 85 GHz and optical will be required to establish whether the primary hotspots, so similar in size and energy content, have different high-energy cutoffs in their electron spectra, and to establish a difference between the NE and SE hotspots.
Our VLA and BIMA data show that 3C 20’s lobes are quite well described by a simple JP ageing model, but that, as with other sources, it is difficult to understand either why the injection indices in the lobes and hotspots are different or why no material with a pure injection-index spectrum is seen.
ACKNOWLEDGEMENTS
We thank an anonymous referee for comments which enabled us to improve the paper significantly. We are grateful to Rick Perley for allowing us to use the archival 5- and 15-GHz VLA data discussed in the text, and the VLA data analysts for help in extracting it from the archive. The National Radio Astronomy Observatory VLA is a facility of the U.S. National Science Foundation operated under cooperative agreement by Associated Universities, Inc.
References
- [] Alexander P., 1987, MNRAS, 225, 27
- [] Alexander P., Leahy J.P., 1987, MNRAS, 224, 1
- [] Cox C.I., Gull S.F., Scheuer P.A.G., 1991, MNRAS, 252, 588
- [] Fernini I., Burns J.O., Perley R.A., 1997, AJ, 114, 2292
- [] Hardcastle M.J., Alexander P., Pooley G.G., Riley J.M., 1997, MNRAS, 288, 859
- [] Harris D.E., Carilli C.L., Perley R.A., 1994, Nat, 367, 713
- [] Harris D.E., Nulsen P.E.J., Ponman T.P., Bautz M., Cameron R.A., Donnelly R.H., Forman W.R., Grego L., Hardcastle M.J., Henry J.P., Jones C., Leahy J.P., Markevitch M., Martel A.R., McNamara B.R., Mazzotta P., Tucker W., Virani S.N., Vrtilek J., 2000, ApJ, 530, L81
- [] Hiltner P.R., Meisenheimer K., Röser H.J., Laing R.A., Perley R.A., 1994, A&A, 286, 25 [H94]
- [] Jaffe W.J., Perola G.C., 1973, A&A, 26, 423 [JP]
- [] Jenkins C.J., Pooley G.G., Riley J.M., 1977, Mem. RAS, 84, 61
- [] Katz-Stone D.M., Rudnick L., Anderson M.C., 1993, ApJ, 407, 549 [KRA]
- [] Laing R.A., 1981, MNRAS, 195, 261
- [] Laing R.A., 1982, in Heeschen, D.S., Wade C.M., eds, Extragalactic Radio Sources, IAU Symposium 97, Reidel, Dordrecht, p. 161
- [] Laing R.A., 1989, in Meisenheimer K., Röser H.-J., eds, Hotspots in Extragalactic Radio Sources, Springer-Verlag, Heidelberg, p. 27
- [] Leahy J.P., Black A.R.S., Dennett-Thorpe J., Hardcastle M.J., Komissarov S., Perley R.A., Riley J.M., Scheuer P.A.G., 1997, MNRAS, 291, 20
- [] Leahy J.P., Bridle A.H., Strom R.G., 1998, Internet WWW page, at URL: http://www.jb.man.ac.uk/atlas/
- [] Longair M.S., Ryle M., Scheuer P.A.G., 1973, MNRAS, 164, 243
- [] Lonsdale C.J., Barthel P.D., 1986, AJ, 92, 12
- [] Looney L.W., Hardcastle M.J., 2000, ApJ, 534, 172
- [] Meisenheimer K., Röser H.-.J., Hiltner P.R., Yates M.G., Longair M.S., Chini R., Perley R.A., 1989, A&A, 219, 63
- [] Meisenheimer K., Yates M.G., Röser H.-.J., 1997, A&A, 325, 57
- [] Pacholczyk A.G., 1970, Radio Astrophysics, Freeman, San Francisco
- [] Rudnick L., 1999, To appear in J. Biretta et al., eds, Life Cycles of Radio Galaxies, New Astronomy Reviews (astro-ph/9910202)
- [] Sault R.J., Teuben P.J., Wright M.C.H., 1995, in Shaw R.A., Payne H.E., Hayes J.J.E., eds, Astronomical Data Analysis Software and Systems IV, ASP Conference Series 77, San Francisco, p. 33
- [] Scheuer P.A.G., 1982, in Heeschen, D.S., Wade C.M., eds, Extragalactic Radio Sources, IAU Symposium 97, Reidel, Dordrecht, p. 163
- [] Stephens P., 1987, PhD thesis, University of Manchester
- [] Steppe H., Salter C.J., Chini R., Kreysa E., Brunswig W., Lobato Perez J., 1988, A&AS, 75, 317
- [] Valtaoja E., 1984, A&A, 140, 148
- [] Williams A.G., Gull S.F., 1985, Nat, 313, 34
- [] Wright M., Birkinshaw M., 1984, ApJ, 281, 135
- [] Wright M.C.H., Sault R.J., 1993, ApJ, 402, 546


 1.4 GHz (L band)
 4.9 GHz (C band)
 8.5 GHz (X band)
 14.9 GHz (U band)