RXTE observations of Seyfert-2 galaxies: evidence for spectral variability
Abstract
We present a series of RXTE observations of the nearby obscured Seyfert galaxies ESO103-G35, IC5063, NGC4507 and NGC7172. The period of monitoring ranges from seven days for NGC7172 up to about seven months for ESO103-G035. The spectra of all galaxies are well fit with a highly obscured ( ) power-law and an Fe line at 6.4 keV. We find strong evidence for the presence of a reflection component in ESO103-G35 and NGC4507. The observed flux presents strong variability on day timescales in all objects. Spectral variability is also detected in the sense that the spectrum steepens with increasing flux similar to the behaviour witnessed in some Seyfert-1 galaxies.
keywords:
. galaxies:active – X-ray:galaxies – galaxies:Seyfert – galaxies:individual: ESO103-G35; IC5063; NGC4507; NGC71721 INTRODUCTION
Recent X-ray missions have brought a rapid progress in our understanding of the X-ray properties of Seyfert galaxies (for a review see Mushotzky, Done & Pounds 1993). The X-ray spectra of Seyfert 2 galaxies as observed by Ginga , ASCA and recently BeppoSAX have proved to be very complex (Smith & Done 1996; Turner et al. 1997). In broad terms most Seyfert 2 X-ray spectra can be well fitted by a power-law continuum (typically ), plus an Fe-K emission line at 6.4 keV and a reflection component (e.g. Lightman & White 1988, George & Fabian 1991). This latter component, which suggests the presence of a large amount of cold material in the vicinity of the nucleus, flattens the observed continuum and can dominate the spectrum above keV. In most Seyfert 2s the above emission components are viewed through a large absorbing column density, typically . This screen, which suppresses the soft X-ray emission through the process of photoelectric absorption in cool atomic and molecular gas, is possibly associated with a large (pc scale) molecular torus. In the limit of very high column densities, Thomson scattering will also diminish the more penetrating hard X-ray emission. In some sources additional emission in the form of a soft X-ray excess is observed below keV probably as a result of scattering of the intrinsic power-law continuum by a strongly photoionised medium (eg Griffiths et al. 1998 in the case of Markarian 3). In order to observe such soft X-ray emission it is clearly a requirement that the scattering medium should extend beyond the bounds of the obscuration of the molecular torus. The X-ray spectra of Seyfert-2 galaxies gave wide support to the standard AGN unification model (Antonucci & Miller 1985). According to this paradigm, the nucleus (supermassive black hole, accretion disc and broad line region) has basically the same structure in both type 1 and type 2 Seyferts, but depending on the circumstances, can be hidden from view by the molecular torus (Krolik & Begelman 1986). Specifically if the source is observed at a sufficiently high inclination angle, and thus the line of sight intersects the torus, it would be classified as a Seyfert 2, whereas for all other orientations it would be deemed to be a Seyfert 1.
In contrast to the recent progress in understanding the X-ray spectral characteristics of Seyfert 2 galaxies, our knowledge of their X-ray variability properties remains limited. According to the standard unification scenario, the hard X-ray continuum should vary with large amplitude in a similar way to that observed in Seyfert 1 galaxies (Mushotzky, Done & Pounds 1993). However, in Seyfert-2s a large fraction of the emission must come from reprocessed radiation. Since a large fraction of the Fe-K line, the reflection emission and the soft excess are likely to originate from regions of parsec scale-size, it follows that significantly less variability might be expected in Seyfert 2 objects, at least in those parts of the spectrum where the reprocessing makes a substantial contribution to the overall flux. Time variability studies can provide strong constraints on the geometry of the nucleus and the surounding region. For example, the time lag between the variation of the power-law continuum and the Fe line flux or the reflection component would give information on the location and the size of the reflecting material. In particular if a large amount of the Fe line originates from the accretion disk, instead of the torus, we would expect variations of the line flux in timescales of days.
Here, we present the results from several RXTE archival observations on four well known Seyfert-2 galaxies: ESO103-G35, IC5063, NGC4507 and NGC7172. In another paper (Georgantopoulos et al. 1999) we presented monitoring observations of Markarian 3. The extended energy range of the RXTE PCA detectors and the large number of observations for each object give us the opportunity to investigate in detail the properties of the spectral components present in these galaxies such as the intrinsic power-law and the reflection component. Our main objective is to use the variability exhibited in the 3–24 keV band to place constraints on the geometry of the nucleus and its circumnuclear matter.
2 THE SAMPLE
2.1 ESO 103-G35
The HEAO-1 hard X-ray source 1H 1832-653 has been identified with the galaxy ESO 103-G35 at a redshift z=0.013. Optical spectroscopy revealed a high excitation forbidden line spectrum with weak broad emission line wings and therefore classified this object as a Seyfert-1.9 galaxy (Phillips et al. 1979). EXOSAT obtained the first X-ray spectrum showing a power-law spectrum absorbed by a column of (Warwick, Pounds & Turner 1988). The EXOSAT observations also showed a variation in the column density over a period of 90 days. Smith & Done (1996) present Ginga observations detecting an Fe line around 6.4 keV with an equivalent width of 350 eV. The spectrum of the source could be characterised by a heavily absorbed power-law continuum of slope and . Smith & Done (1996) also found evidence for the presence of a reflection component. Turner et al. (1997) present the first ASCA data for this object. They resolve the Fe line into possibly three components (6.4, 6.68 and 6.96 keV). Recently, Forster, Leighly & Kay (1999) presented three ASCA observations separated by 2 years. They find some marginal evidence for a double Fe line in their first observation. Their best fit and values agree with the Ginga results. They also find that the power-law continuum flux increased by a factor of two while the Fe line equivalent width has decreased by about a similar amount. Two observations of ESO103-G35 with BeppoSAX separated by a year, from 2 to 60 keV (Akylas et al. 2000), show a variation of the power-law flux by a factor of two, no variation of the Fe line flux while there is no strong evidence for the presence of a reflection component. Comparison of the historical data (Poletta et al. 1996) from HEAO-1 up to ASCA show a variation of the flux of a factor of about four.
2.2 IC5063
IC5063 is an S0 galaxy (z=0.011) presenting a typical Seyfert-2 galaxy spectrum (Colina, Sparks & Macchetto 1991). Scattered broad emission has been detected by Inglis et al. (1993). HST NICMOS observations show a very red unresolved point source (Kulkarni et al. 1998). IC5063 has a radio power at 1.4 GHz two orders of magnitude greater than that of typical Seyfert galaxies and thus it can be classified as a Narrow-Line Radio galaxy as well (Ulvestad & Wilson 1984). A Ginga observation showed a power-law photon index of and (Smith & Done 1996). Turner et al. (1997) presented two ASCA observations of IC5063. The spectrum is in good agreement with the Ginga observations. IC5063 shows short-term X-ray flux variability at the 90 per cent confidence level (Turner et al. 1997). However, the Ginga and the ASCA observation obtained about four years later give similar fluxes.
2.3 NGC4507
NGC4507 is a nearby (z=0.012) barred spiral galaxy. Optical spectra present high excitation, narrow emission lines classifying it as a Seyfert-2 galaxy (Durret & Bergeron 1986). Ginga observations showed a flat X-ray spectrum (), with and a strong Fe line (equivalent width, EW eV) (Smith & Done 1996). Instead, OSSE observations (Bassani et al. 1995) showed a steeper photon index () in the 50-200 keV energy range suggesting the presence of a strong reflection component. ASCA observations (Turner et al. 1997, Comastri et al. 1998) showed a flat power-law index, with a possible variation of the iron line intensity and the absorption column density. The limited spectral bandpass of ASCA did not allow to constrain the properties of a reflection component. Comparison between the EXOSAT and ASCA observations show a flux variability of a factor of about two.
2.4 NGC7172
NGC7172 is an S0 galaxy (z=0.0087) belonging to a compact group of galaxies (Hickson90). It is classified as a Seyfert-2 galaxy on the basis of its optical spectrum (Sharples et al. 1984). EXOSAT obtained the first X-ray spectrum of the source yielding a photon index of (Turner & Pounds 1989). The same photon index value was also found in a Ginga observation of the source (Smith & Done 1996). The Ginga data analysis yielded a column density of , and a rather weak Fe line (EW eV). Turner et al. (1997) find an EW of eV. The ASCA data as well as combination with GRO/OSSE observations (Ryde et al. 1997) show a flat spectrum of and therefore provided evidence for spectral variability between the Ginga and ASCA epoch. The 2-10 keV flux has been fairly constant during the 1977-1989 period at a level of about . However, Guainazzi et al. (1998) presented evidence for significant short term (hours) and long term (months) variability using two ASCA observations separated by a year. They find a flux decrease by a factor of 3 over a year. The Fe line flux decreased by a similar amount providing important constraints for the size of the reflecting material.
3 DATA ANALYSIS
In this work, we present the results from the analysis of the PCA (Proportional Counter Array) data only. The PCA consists of five collimated (1∘ FWHM) Xenon proportional counter units (PCU). The PCU are sensitive to energies between 2 and 60 keV. However, the effective area drops very rapidly below 3 and above 20 keV. The energy resolution is 18 per cent at 6.6 keV (Glasser, Odell & Seufert 1994). The collecting area of each PCU is 1300 . We use only 3 PCUs (0 to 2); the data from the other two PCU were discarded as these detectors were turned off on some occasions. We extracted PCU light curves and spectra from only the top Xenon layer in order to maximize the signal-to-noise ratio. The data were selected using standard screening criteria: we exclude data taken at an Earth elevation angle of less than 10∘, pointing offset larger than 0.02∘, during and 30 minutes after the satellite passage through the South Atlantic Anomaly (SAA), and when the particle counts electron0,1,2 are higher than 0.1.
We use the PCABACKEST v2 routine of FTOOLS v 4.1.1 to generate the background models which take into account both the cosmic and the internal background. The internal background is estimated by matching the conditions of the observations with those in various model files. Most of the internal background is correlated with the L7 rate, the sum of 7 rates from pairs of adjacent anode wires. However, there is a residual background component correlated with recent passages from the SAA. Therefore, the use of a second, activation component is also employed. Comparison with blank fields observations shows that the above background model represents the real background accurately (within 1.5 per cent in the 3-20 keV band).
Due to the large field-of-view of the PCA detector, contamination of the observed spectrum by nearby sources is likely. We have therefore checked the ASCA GIS 2-10 keV images of our sources. These show no nearby sources (the GIS field-of-view is 40 arcmin diameter). However, Turner et al. (1997) point out that even the ASCA spectrum of NGC4507 may be somewhat contaminated by an adjacent point source (present in the soft ROSAT PSPC 0.1-2 keV band). This source cannot be resolved within the limited ASCA GIS spatial resolution (about 3 arcmin half-power-diameter). Possible contamination at radii larger than the ASCA GIS field-of-view can be investigated using the ROSAT PSPC images of our sources. Indeed, in NGC7172 and ESO103-G35 we find bright sources at distances from 30 to 60 arcmin from our targets. Inspection of the NASA extragalactic database (NED) reveals no coincidences. Therefore, these are most probably Galactic stellar sources and thus with soft X-ray spectra whose contamination in the RXTE band is expected to be small.
4 THE OBSERVATIONS
In total 43 observations with exposure time of 151.0, 46.3, 118.6, and 78.2 ksec have been obtained with RXTE for ESO103-G35, IC5063, NGC4507 and NGC7172 respectively. The period of observations ranges from about 7 days for NGC7172, and 15 days for NGC4507, up to about 5 months for IC5063 and 7 months for ESO103-G35. The observation dates for each dataset together with the exposure time as well as the observed background-subtracted count rate in the full 2-60 keV PCA energy band are given in Tables 1 to 4.
| Date | Exp (ksec) | Ctr |
|---|---|---|
| 11-Apr-1997 | 14.4 | 15.380.11 |
| 12-Apr-1997 | 10.7 | 14.940.11 |
| 12-Apr-1997 | 15.7 | 14.680.10 |
| 13-Apr-1997 | 6.3 | 15.760.15 |
| 18-Jul-1997 | 6.2 | 12.080.16 |
| 20-Jul-1997 | 8.6 | 13.100.14 |
| 21-Jul-1997 | 11.7 | 14.120.11 |
| 22-Jul-1997 | 11.4 | 15.920.12 |
| 23-Jul-1997 | 10.4 | 15.360.11 |
| 24-Jul-1997 | 11.5 | 15.320.11 |
| 26-Jul-1997 | 12.4 | 14.300.11 |
| 13-Nov-1997 | 1.9 | 13.690.27 |
| 14-Nov-1997 | 8.7 | 12.840.13 |
| 14-Nov-1997 | 19.4 | 13.200.09 |
| 14-Nov-1997 | 1.4 | 16.100.32 |
| Date | Exp (ksec) | Ctr |
|---|---|---|
| 22-Jul-1996 | 18.0 | 6.340.07 |
| 01-Sep-1996 | 9.8 | 4.450.10 |
| 01-Sep-1996 | 1.4 | 3.42 0.24 |
| 19-Dec-1996 | 11.1 | 4.610.09 |
| 20-Dec-1996 | 6.0 | 4.730.12 |
| Date | Exp (ksec) | Ctr |
|---|---|---|
| 24-Feb-1996 | 12.6 | 7.260.08 |
| 24-Feb-1996 | 3.3 | 6.960.16 |
| 26-Feb-1996 | 12.7 | 8.330.08 |
| 26-Feb-1996 | 14.0 | 6.990.07 |
| 27-Feb-1996 | 3.6 | 7.460.15 |
| 28-Feb-1996 | 14.5 | 6.750.08 |
| 28-Feb-1996 | 15.2 | 5.390.09 |
| 29-Feb-1996 | 0.6 | 5.830.35 |
| 29-Feb-1996 | 3.2 | 6.840.07 |
| 29-Feb-1996 | 3.2 | 6.730.16 |
| 03-Mar-1996 | 12.5 | 7.700.08 |
| 07-Mar-1996 | 16.3 | 9.580.07 |
| 07-Mar-1996 | 0.8 | 9.040.32 |
| 10-Mar-1996 | 6.1 | 7.690.11 |
| Date | Exp (ksec) | Ctr |
|---|---|---|
| 18-Dec-1996 | 12.8 | 7.320.09 |
| 18-Dec-1996 | 4.4 | 5.420.14 |
| 18-Dec-1996 | 5.5 | 7.610.12 |
| 19-Dec-1996 | 10.0 | 8.130.10 |
| 19-Dec-1996 | 3.2 | 8.380.17 |
| 23-Dec-1996 | 14.3 | 6.120.08 |
| 23-Dec-1996 | 9.5 | 4.840.09 |
| 25-Dec-1996 | 11.7 | 2.25 0.09 |
| 25-Dec-1996 | 6.6 | 2.47 0.11 |
In Fig. 1 we present the 2-10 keV light curves for all sources using a bin size of 25ksec (time in this figure is measured from the beginning of the first observation of each source). The light curves show variations on all sampled timescales (days/months). For example, ESO103-G35 shows a per cent variation within a few days, while IC5063 shows a decline by a factor of within 4 months. The maximum amplitude of the observed variability is in the case of NGC7172, for NGC4507 and IC5063, and per cent in the case of ESO103-G35 light curve. Consequently, on timescales larger than day, these four Seyfert 2 galaxies show keV flux variability similar to that observed in Seyfert 1. In fact, the light curves show significant variations on time scales as short as a few hundred seconds as well (these results will be presented elsewhere). This is not an unexpected result, since for these Seyfert 2 galaxies we believe that we can detect the nuclear emission above a few keV directly.


4.1 Hardness Ratios
Next, we investigate if there is any spectral variability during the flux variations. For this reason we extracted light curves at the following energy bands: , , and keV, using a bin size of 5400 sec (this is roughly equal to the orbital period of RXTE ). Variations of the emission/absorption components in the spectrum of Seyfert 2 galaxies are expected to contribute in a different way in these energy bands. For example, any absorbing column density changes around should affect mainly the keV band, while the Fe-K emission line and the reflection component variations should affect the keV and keV bands respectively. On the other hand, the keV band light curve should be representative of the power-law continuum variations only. Using these light curves we calculated three hardness ratios: , and , where is the count rate of the band light curve. Under the hypothesis that there are no spectral changes, the s should remain constant.
Fig. 2 shows the plot for the sources as a function of the normalised (the normalisation is necessary in order to compare the sources since they have different luminosities). NGC7172 shows the largest amplitude variations in the keV band. Within the common range of the normalised values, the s have similar values for all objects except for NGC4507 (open diamonds in Fig. 2). Both and for this source have a large value. In fact we could not calculate as its keV light curve has a mean value of almost zero. The similarity of the values for ESO103-G35, IC5063 and NGC7172 suggests that they have similar spectra, while the NGC4507 spectrum appears to be much “harder”. This is probably due to the fact that NGC4507 has a larger absorbing column density, which reduces mainly the count rate in the “soft” bands, and hence results in larger values.
In order to investigate the presence of spectral variations we fitted the data for each galaxy with a model of the form: (in fitting the data we took account of the errors in both and ). In all cases, a line in the log-log space fits the data well (ie the best fit values can be accepted with confidence larger than per cent). If the values remain constant during the flux variations, we expect (ie the slope of the line) to be consistent with zero. We discuss below the best fit results for each galaxy.
ESO103-G5 shows no variations (). On the other hand, both and are variable: and . The variations suggest that the spectrum of the source above keV steepens as the source brightens. The ratio shows the opposite behaviour. It implies a “flattening” of the keV spectrum as the source brightens. In the case of IC5063, both and are variable (, and ) while remains constant (). Both and indicate that the source’s spectrum becomes softer as it brightens. NGC4507 shows a different behaviour. remains constant (), while is significantly variable (). The spectrum below keV appears to become softer as the source flux increases. NGC7172 shows a similar behaviour. remains constant (), shows marginal changes () while shows more significant variations (). These variations indicate again a steepening of the spectrum below keV as the source flux increases.
5 SPECTRAL ANALYSIS
In our spectral analysis, we used only data between 3 and 20 keV, where the effective area of PCA, and hence the signal-to-noise ratio, is highest. By discarding the data below 3 keV we also avoid the complications associated with the soft X-ray excess in these sources (see Turner et al. 1997). The PCA data from each observation were binned to give a minimum of 20 counts per channel (source plus background). The spectral fitting analysis was carried out using the XSPEC v.10 software package on the basis of “joint fits” to our RXTE observations. All errors correspond to the 90 per cent confidence level for one interesting parameter. All energies quoted refer to the emitter’s rest-frame.
We have employed two group of models (see below) in order to characterize the spectra of the objects at each observation. Within each group, in order to assess the significance of new parameters added to the initial model of the group we have adopted the 95 per cent confidence level using the F-test for additional terms. To compare models with different number of parameters within each group and models between the two groups we have used the “likelihood ratio” (Mushotzky 1982) and accepted values of the ratio larger than 100 as showing significant improvement in the model fits.
Note that the RXTE background estimation software calculates errors on the simulated background spectrum assuming Poisson statistics. This is an overestimate of the statistical error on the background spectrum, which is estimated using a large amount of data. In fact, for faint objects (such as AGN) the error that the standard software calculates for the background is comparable to the error in the total observed rate. In practice, the background spectrum errors should be negligible compared to the errors on the observed spectrum. Since the XSPEC software estimates the error in the net spectrum (source - background) by combinning the errors in the observed spectrum with those of the simulated background, the reduced values in many cases are very small. However, the F and “likelihood ratio” tests are not affected by this. Finally, due to the large errors, the confidence regions that we estimate for the best fit parameter values are almost certainly enlarged.
5.1 Power Law and Gaussian Line Models.
Following previous Ginga and ASCA results, we first employ a simple spectral model consisting of a power-law continuum, with photon spectral index , modified by absorption in a column density, , of cool neutral material. A Gaussian line was also included to account for Fe-K emission. The line energy and the width were allowed to vary freely. However, when the width was found to be smaller than the RXTE spectral resolution, we fixed it at keV. The values of the , the photon index and the normalization of the Fe line are free parameters but tied to the same value for all observations. The normalization of the power law is allowed to vary freely. The results of fitting this spectral model are presented as model A in Tables 5, 6, 7 and 8. Next, we allow for the column density and the power-law index to vary freely (models B and C in the same tables). Finally, in model D we allow for the normalization of the Gaussian line to vary freely while now both the power-law index and the column density are tied to the same value between all the observations. We discuss the results for each galaxy in turn.
ESO103-G35. It shows a large column density ( ) in excellent agreement with the Ginga observations. However, the spectral index is flat (, model A) in contrast with the Ginga results. Moreover, the best fit energy line is very low ( 6 keV) and marginally resolved, ie broader than the energy resolution of PCA, having a of keV. The EW of the line does not remain constant. It ranges from to eV. The data show strong evidence for spectral variability, since models B,C and D give a significantly better fit to the data when compared to model A. When the line normalisation is untied (model D), we obtain a for 14 addtitional parameters. A larger value is obtained when the column density is untied and an even larger when the power law index is untied ( and 162 respectively for 14 additional parameters). Based on the likelihood ratios, model C gives the best fit to the data.
Following Forster et al. (1997), we tried an additional model. We added an absorption edge component (model EDGE in XSPEC) to model A and kept the Fe line energy fixed at 6.4 keV. We obtain a highly statistically significant improvement in compared to model A ( for one additional parameter). The photon index becomes now steeper ( and ). The best-fit energy for the edge is keV and the optical depth is .
IC5063. Model A does not provide a good fit in this case. The column density is while the power-law is flat () both in good agreement with the Ginga results. The EW of the Fe line varies between and eV. As before with ESO 103-G35, we find highly significant evidence for spectral variability. Models B and C give a significant improvement compared to model A (in this case model D does not improve the fit significantly). The best fit is obtained when the photon index is untied (model C): . However, the Fe line energy is low ( keV with ). We therefore included an absorption edge in model C. The line energy is marginally improved, keV, with . The edge energy was fixed at 6.9 keV while the optical depth found was . However, the inclusion of the edge did not improve the fit at a statistically significant level (, as compared to for model C).
NGC4507. Model A results in a high absorbing column ( ) and a flat spectrum (), in agreement with the Ginga observations. The line energy is keV with the line width being unresolved (). The EW ranges from up to eV. All models B,C and D give a significant improvement when compared to model A, indicating again the presence of significant spectral variability. Based on the likelihood ratios, it is model B this time that provides the best fit to the data.
NGC7172. Model A shows a large column density ( ) in agreement with previous Ginga results. The power-law has a value of , also in good agreement with the Ginga results, and typical of the intrinsic AGN spectral index. The Fe line has an energy of keV. The line width is consistent with the line being narrow. The resulting EW varies from to eV in the nine observations. Model D does not improve the fit, while models B and C give a statistically significant improvement to the value of the fit. When the column density becomes a free parameter (model B) we obtain a for 12 additional parameters. When the photon index becomes untied (model C), we obtain an equally good with varying between and . This suggests that the two parameters (photon index and column density) are degenerate and it is therefore difficult to disentangle the origin of the observed spectral variation. We plot the variations of column density and of the photon index as a function of the keV flux in Fig. 5 and 6 respectively. We can see that the changes in the spectrum of this source can be explained by a decrease of by per cent as the source flux increases by a factor of . Alternatively, a increase by (from up to ) can explain the spectral changes equally well.
5.2 Power Law, Gaussian Line and Reflection Component Models.
Although the power-law plus gaussian line prescription defined above gives an acceptable fit in terms of the statistic, there is evidence from the flat power-laws derived for NGC4507, IC5063 and ESO103-G35 for the presence of a strong Compton reflection component. The next step in the current analysis was therefore to include a reflection component in the spectral modeling. Specifically we use the PEXRAV model (Magdziarz & Zdziarski 1995) in XSPEC. This model calculates the expected X-ray spectrum when a source of X-rays is incident on optically thick, neutral (except hydrogen and helium) material. We assume that both the reflection component and the power-law are absorbed by the cold gas column density. The strength of the reflection component is governed by the parameter R, representing the strength of the reflected signal relative to the level of the incident power-law continuum. We set R=1 (which corresponds to a solid angle subtended by the optically thick material). We fix the inclination angle for the disk at , since the shape of the reflection spectrum below 20 keV is relatively independent of the inclination angle. We also fix the energy of the exponential cutoff at 300 keV. Both the iron and light element abundances were kept fixed at the solar abundance values.
We added this reflection component to all models A,B,C and D, creating a new set of models (A’,B’,C’ and D’). In all new models, the normalisation of the reflection component is tied to a single value across the set of observations. We also set the spectral index of the power-law continuum to (in all models apart from model C’). As before, in model A’ the power-law normalisation is allowed to vary in each observation while the column density and the Fe line normalization are tied between the different observations. In model B’ we untie the column density, in model C’ we untie the photon index and in model D’ we let the gaussian line normalisation free. Finally, we let the reflection component normalisation free (model E’). The results are presented in tables 9 to 12.
ESO103-G35. In the case of ESO103-G35, the inclusion of a reflection component gives a statistically significant improvement to the data fit. For example, we obtain a (with the addition of one extra parameter) when we include the reflection component in model A. This is in agreement with the findings of Smith & Done (1996) using Ginga data. Furthermore, all models (B’,C’,D’ and E’) significantly improve the fit when compared to model A’. The best fit to the data is obtained when the photon-index is allowed to vary with time (model C’, ). An equally good fit is also obtained when the reflection component normalisation is allowed to vary with time (model E’). Both these models give a better fit than model C, showing again that the inclusion of the reflection component significantly improves the fit.
In Fig. 3 we present the variations of the power-law and the reflection flux between the different observations (model E’; time in this figure and in Fig. 4 as well is measured in seconds from the mission launch date). We see that the power-law component shows rapid flux variations (up to a factor of 50 per cent) within days. Similar variations, but not well correlated with the power-law variations, are observed in the reflection component flux as well. In Fig. 6 we plot model’s C’ best fit values as a function of the keV flux. A change of (from up to ) can explain the spectral variability in this case.
However, the best fit line energy in models C’ and E’ is abnormally low ( keV). We therefore introduced an absorption edge to model E’. The resulting is 505/714, which indicates that, compared to model E’, the improvement to the fit is statistically significant. The best fit line energy now becomes keV, roughly consistent with the line energy of neutral Fe. The best fit edge energy is keV (ionised Fe) while the optical depth is . Similar results are obtained when we add a warm edge component to model C’.
IC5063. In IC5063 the inclusion of a reflection component does not represent a statistically significant improvement. Models C’, E’ and C (which does not include a reflection component) give an equally good fit to the data. However, the inclusion of the reflection component (for example model E’) yields a line with an energy of keV, which is roughly consistent with the energy of line from neutral Fe. In Fig. 4 the variations of the power-law and the reflection flux are presented (model E’). The power-law component flux decreases by a factor of two with time. In contrast, the reflection signal, although variable as well, does not correlate with the power-law flux. Alternatively, a change of between roughly and (model C’, see Fig. 6) yields a similarly good fit to the data, and results in the same best fit line energy value. However, the photon index does not correlate well with the continuum flux.
NGC4507. In this case, the use of a reflection component improves the fit dramatically. Models B’ and C’ give a much better fit to the data than model B. These two models (untied column densities or photon indices) fit equally well the data: in the first case the varies roughly between and , while in the second case varies between and .
The line energy is again low ( keV) and therefore we included an absorption edge component in both models B’ and C’ above. We obtain a statistically significant improvement in the fit in both cases. However, the best fit is now clearly obtained in the case of a column density variation (=643/794 as compared to =655/794 for an untied ). The edge energy was frozen at 6.9 keV while its optical depth was found to be . The line energy was kept fixed at 6.4 keV (=0.1 keV). In Fig. 5 we plot the variations of as a function of the 3-20 keV flux (model B’ with edge). A per cent decrease in the absorpting column while the source flux increases by a factor of 2 can explain the observed spectral changes.
NGC7172. In this case, the inclusion of a reflection component does not improve the fit at a statistically significant level. Models B’ and C’ present the best fit to the data, however the goodness of fit is comparable to that of the models B and C. The lack of a reflection component is rather expected given the steep power-law index found earlier in the case of the simple power-law and a Gaussian line model. Note that the Ginga results required the presence of a reflection component only marginally.


5.3 Soft excess models
The X-ray spectra of Seyfert-2 galaxies usually show some level of soft X-ray emission despite the strong photoelectric absorption (eg Turner et al. 1997). This soft excess could be due to either a strong star-forming component or scattered emission from the nucleus. The contribution of the soft excess in our case (ie above 3 keV) should be negligible. Nevertheless, we tried to investigate whether a constant soft excess combined with a power-law component with varying normalization may explain the strong spectral variability observed in our data. Therefore, we include a power-law component with the same photon index as the hard X-ray power-law and with a free normalization (but tied between all the observations) in the models above.
In NGC7172 we add the soft power-law to model A since a reflection component is not needed by the data. We obtain =303.8 ie identical to that of model A, despite the addition of one extra parameter. We conclude that an extra soft component is not needed by the data. In the other three cases we add the soft power-law component to model A’. In the case of ESO103-G35 we obtain =568.5/729 which represents a statistically significant improvement to model A’. However, the fit is worse when compared to models C’ and E’. In NGC4507 we obtain similar to model A’ with the soft power-law normalization being zero. Finally, in the case of IC5063 we obtain an identical to model A’ (269/239) while the soft power-law normalization is again zero. The above confirm that the presence of any soft excesses do not affect our data above 3 keV, and they cannot account for the observed spectral variability.
6 SUMMARY
ESO103-G35 presents a complex spectrum. Models C’and E’, with the addition of a warm edge, give the best fit to our data. Our best fit edge energy is keV with . The best fit edge energy matches the results from the 1988 and 1991 Ginga observation (Warwick et al 1993, Smith and Done 1996), and also the 1996 ASCA observation (Forster et al 1999). The energy of the edge implies the presence a significant amount of ionised iron. The optical depth of the iron edge was observed to increase between the 1994 and 1996 ASCA observations (Forster et al 1999), and the edge line in the former observation was consistent with that from neutral iron. Our best fit edge optical depth is significantly smaller than the respective ASCA result (Forster et al. 1999). However, the quality of the present data set is not good enough to investigate if there exist any changes in the optical depth and/or the energy of the edge during the RXTE observations. The spectral variability can be explained by a variable spectral index (model C’, Fig. 6). Although these variations are subtle, they are highly statistically significant. The photon index is correlated with the 3-20 keV flux in the sense that the spectrum steepens with increasing flux. The same variations can be equally well explained by a variable reflection component (model E’, Fig. 3). Interestingly, Akylas et al. (2000) find no reflection component in the BeppoSAX observations despite the large passband (2-60 keV) and the good signal-to-noise ratio of their observations. This may suggest that the relative normalization of the power-law and the reflection component must change in different epochs, and supports the interpratation that the spectral variations seen by RXTE are caused by a variable reflection component. Furthermore, in this case we can also explain naturally the fact that although the ratio of ESO103-G35 is variable, the ratio remains constant.
IC5063 can be well fit with a simple spectrum consisting of a power-law and a Gaussian line but the energy of the line is abnormally low ( keV). The addition of an edge does not yield a reasonable value for the energy of the Fe line. However, the addition of a reflection component (models C’ and E’), although it does not improve the , yields an Fe line with an energy of keV compatible within the errors with the energy of cold Fe line. IC5063 shows strong evidence for spectral variability (Fig. 2). The spectral variability can be explained either by the reflection component being variable between the observations (model E’) or by the photon index being variable (model C’, 1.6 - 2.2). According to model E’ best fit results there is no correlation between the reflection component and the intrinsic power law flux variability (Fig. 4). Similarly, in the model C’ case, there is no clear correlation between the photon index and the continuum flux (Fig. 6).
NGC4507 presents a similar spectrum to ESO103-G35. We find strong evidence for a reflection component (note that such a component was not evident in neither the Ginga nor the ASCA data). We also find evidence for a cold Fe edge (with an energy fixed at 6.9 keV), in excess of the absorption edge associated with the reflection component. Assuming the iron cross section given by Leahy and Creighton (1993), the optical depth of the edge () implies an equivalent hydrogen column density of . This is smaller than our best fit value of . The edge component is required by the data, but with its addition we can get a good fit to the data with the iron line energy fixed at 6.4 keV. However, there is a possibility that residuals in the PCA calibration matrix around 5 keV due to Xe may still be present. In such a case it is possible that the line energy obtains somewhat low values due to these residuals. Therefore, we believe that the detection of a cold Fe edge in this object remains uncertain. We find strong evidence for spectral variability (Fig. 2). The best model fit to the data (model B’) suggests flux correlated column density changes: the column becomes lower with increasing flux (Fig. 5). This model can explain naturally the variations observed for this object, and at the same time the lack of variations.
NGC7172 is the only object which shows no evidence for a reflection component. Ginga found marginal evidence for such a component while in BeppoSAX data a reflection component is needed only if the spectral index is fixed to the canonical value (Akylas et al. 2000). Similarly, if is fixed to 1.9, models with reflection (B’ and C’) can fit the present data set well but simple power law models (B and C) can fit the data equally well. There is no evidence for an edge, and spectral variability is observed again. The spectral fitting cannot discriminate between variations in the photon index or the column density: as the flux increases, either the column drops () or the photon index steepens () in a similar fashion to ESO103-G35 and NGC4507.
7 DISCUSSION AND CONCLUSIONS
The RXTE observations of ESO103-G35, IC5063, NGC4507 and NGC7172 show that, in all objects, the X-ray flux is significantly variable on time scales larger than a day, with an amplitude similar to that observed in Seyfert 1 galaxies. This result on its own suggests that, in these objects, we are seeing directly the nuclear emission. This emission is transmitted through a heavily absorbing material with a density of . Apart from the flux variability, we searched for the presence of spectral variations, taking advantage of the fact that the present data set consists of many observations for each object all made with the same instrument. In the past, spectral variability studies in Seyfert 2 galaxies were not conclusive mainly because it is difficult to compare the results from different spectral fits performed across various instruments with different bandpasses. We detected significant, flux related variations in the hardness ratios that we calculated for all objects (Fig. 2). This result suggests that spectral variability may be a ubiquitous feature in Seyfert-2 galaxies.
In principle, the observed hardness ratio variations could be an artefact of poor background subtraction. However, the variations do not show the same behaviour in all sources, and are well correlated with the source flux. Therefore, if these variations are due to background subtraction errors, those errors should be different at different epochs and should operate in such a way so that the resulting ratios should mimic the flux correlated variations seen in Fig. 2. We consider this possibility unlikely to be the cause of the spectral variations that we observe.
Still, the explanation for the observed spectral variability is model dependent and is based on the spectral fitting results. In some cases, these results are somehow uncertain. For example, in NGC7172 and NGC4507, significantly different values are observed in just one observation, namely the one with the highest flux (Fig. 5). Although the hardness ratios clearly show that the variability in both NGC4507 and NGC7172 is attributed to more than one observation, we investigated whether the spectral fitting results could be affected by problems associated with the background subtraction in the highest flux observations. Hence, we examined the data below 3 keV in layer 1 where the signal is mostly due to particles as the effective area of the PCA is negligible. We also examined the signal in the full energy band of layers 2 and 3 which are again sensitive to particles only. We find that the particle spectrum was consistent with the background model predictions, especially below 5 keV. In conclusion, we believe that the spectral variability is real in all four objects, and that our model fit results can be used in order to explain its origin.
The origin of the spectral variability appears to be different in each object. We discuss below briefly the implications of our results on the processes that operate in the nuclei of Seyfert 2 galaxies.
7.1 Photon index changes
In three cases, namely ESO103-G35, IC5063 and NGC7172, models with a variable photon index (model C’ for the first two sources and model C for NGC7172) can fit the data well. Turner et al (1998) have found significant photon index variability in many Seyfert 2 galaxies by comparing historical X-ray observations. Significant photon index variability has also been observed in many Type 1 objects (eg MCG 6-30-15, Lee et al. 1999; NGC4051, Guainazzi et al. 1996; Mrk 766, Leighly et al. 1996; NGC4151, Warwick et al. 1996). In all these objects, the power law becomes steeper with increasing flux. The same pattern is followed by the photon index with flux in our case as well. In ESO103-G35 and NGC7172 we observe increasing by and for a and flux increase respectively. In IC5063, increased by while the source doubled its flux, but is far from clear in this case that the variations are correlated with the source flux.
According to standard Comptonization models, hard X-rays in AGN are produced through the scattering of the soft UV photons from the accretion disk on a hot ( 40 keV) corona above the accretion disk. Opacity changes in the corona can give rise to significant spectral variability, even if the total luminosity of the hard X-rays remains constant (Haardt et al 1997). If the corona opacity is not dominated by pairs, as the optical depth of the corona, , increases the intrinsic spectrum becomes steeper (as long as ). As a result, as long as , the the photon index correlates with the photon flux: a increase in the keV flux can result in a increase in the photon index (Fig. 7 in Haardt et al 1997). The best fit values that we find are less than in almost all cases and the changes that we detect for the observed source flux variations are in broad agreement with the predictions of this model.
We note in passing that Seyfert 2 galaxies with “flat spectrum” (ie Smith & Done 1996) may not be intrinsically flat. If those sources also exhibit flux related photon index variations, then values as flat as can be expected according to Haardt et al. (1997). Monitoring observations of these sources could resolve the issue.
7.2 Absorption column changes
In NGC4507 and NGC7172, models with a variable absorption column density (models B’ and B respectively) give a good fit to the data. In fact, model B’ gives the best fit to the NGC4507 data. In both cases, the column density is anticorrelated with the X-ray flux: a decrease in is observed while the source flux increases by a factor of and respectively (Fig. 5). Absorbing column variations in Seyfert 2 galaxies have been observed in the past as well (eg NGC526A, Turner & Pounds 1989; NGC7582, Warwick et al. 1993; ESO103-G35, Warwick, Pounds and Turner 1988). In the first two cases significant column changes on a time scale of years were detected, while two EXOSAT observations of ESO103-G35 revealed a significant drop in the column density within 90 days.
The flux correlated variations can be explained if the obscuration is not due to a uniform torus, but due to individual clouds rotating around the nucleus instead. We may expect clouds of different column density to intercept the emission from the nucleus at different epochs. In this case, a small increase of the column density will be associated with a decrease in the total flux. This model requires both high velocities for the covering clouds and a small X-ray source size. For example, in the case of NGC7172, the lowest flux observations (last two points in Fig. 1) have similar values and are and days apart from the highest flux observation (third point in Fig. 1). Assuming that a cloud of and velocity of km/sec covered the X-ray source in days, then the size of the X-ray source should be smaller than a few () light hours.
The variations could also be explained by partial photo-ionisation of the obscuring screen. Varying degrees of photo-ionisation caused by intrinsic luminosity variations of the source can result in column density changes. This model can explain succesfully the variable X-ray absorption in MR2251-178 (Halpern 1984, Pan et al. 1990). Recently, Comastri et al. (1998), presented strong evidence for the existence of photonionised material with a column density of in NGC4507. In order for the absorbing column to adjust itself instantaneous to the continuum flux variations (and hence explain the rather “continuous” variations shown by its plot in Fig. 2), the absorbing material should be close to the central source and in a thin shell (so that its density will be larger than a few cm-3, Netzer 1993). Interestingly, Turner et al. (1998) have recently presented evidence for the existence of absorbing material close to the central source in Seyfert-2 galaxies. Neither the ASCA nor the RXTE data show evidence for a warm edge in the spectrum of NGC4507. For an ionised material with a column density of a few the respective edge should have an optical depth of less than 0.1, and hence difficult to detect. On the other hand, ESO103-G35 shows a warm iron edge in its spectrum but no indication of absorption column variations. Perhaps in this case, the small amplitude continuum variability together with possible variability of other spectral components (ie , reflection component normalisation) render the detection of any absorption variations difficult. Finally, in the case of NGC7172, ASCA observations did not show any evidence of photo-ionised material (Guainazzi et al 1998). The keV flux of the source during the ASCA observation was erg cm-2s-1, which is similar to the flux during the last RXTE observation. Their best fit value , which is consistent with our estimate (, Table 8). This result supports the idea that in NGC7172 flux related changes (ie model C) rather than variations (model B) are responsible for the spectral variability.
The detection of variations in just one source indicates that distribution of the absorbing material in Seyfert 2 galaxies may not be the same in all objects (eg Turner et al. 1998). Material away from the nucleus is not expected to be ionised and will not respond to the continuum variability. As a result, in these objects will remain constant with time.
7.3 Reflection component and Iron Line
Model E’ (a variable reflection component) can explain the spectral variability observed in ESO103-G35 and IC5063. If true, this would imply that the cold material responsible for reflection is close to the nucleus eg an accretion disk as suggested by Nandra et al. (1997) for Seyfert 1 galaxies. In this case we expect a positive correlation and no appreciable lags in the reflection response to the continuum flux variations. Contrary to this, we find that the reflection variations are not correlated with the continuum variations, especially in the case of IC5063 (Fig. 3, 4). One can assume, rather arbitrarily, that there is after all a lag and therefore the reflection component is responding to past, unobserved continuum variations. Further evidence for the existence and possible variability of the reflection component can be provided by the iron line results.
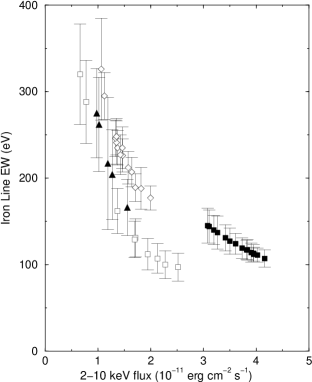
All sources show a strong, unresolved emission line at keV. The only exception is ESO103-G35 where the line may be marginally resolved( keV, models C’ and E’). This is consistent with the results of Turner et al. (1997) for this source. The intensity of the line though remains constant. This is indicated by the fact that model D’ (a variable iron line) does not improve the fit when compared with model A’ in IC5063 and NGC4507. The same holds for model D when compared with model A for NGC7172. Fig. 7, shows a plot of the line EW as a function of the source keV flux. The equivalent widths were estimated using results from the best fit of model B’ for NGC4507 and NGC7172, model C’ for IC5063 and the same model plus a warm iron edge for ESO103-G35. Since all models require a constant line, in all cases the EW decreases as the source flux increases. The errors on the EW are small enough to see that the EW variations are significant.
The fact that the lines are narrow (except for ESO103-G35) and constant implies that they are produced by the obscuring torus. For IC5063, NGC4507 and NGC7172, the EW of the iron line can be as large as eV in the lowest flux observations (Fig. 7). The measured column densities in the line of sight toward those sources is , and respectively. For these values, we expect an emission line with equivalent width of eV, eV and eV respectively (Ghisellini et al. 1994). The larger than expected EW suggests that there exists a source of line photons other than from the line-of-sight absorbing material. A 6.4 keV iron line can also be produced by fluorescence from an acrretion disk. The expected angle-averaged EW in this case is eV. Consequently, in NGC4507 and IC5063 the iron line that we observed is probably the sum of two lines - most of the line is produced by the torus and there is additional contribution by the accretion disk itself. Any variations of the accretion disk line would be diluted by the presence of the torus line and hence difficult to detect. Furthermore, the lack of line variability indicates that the torus should be in a distance larger than approximately two light weeks and approximately six light months in NGC4507 and IC5063 respectively.
For NGC7172, the discrepancy between the EW observed in the two lowest flux observations of this source ( eV), and the EW expected in the case of a torus plus an accretion disk line ( eV) remains. Furthermore, the Ginga and ASCA results (Smith & Done 1996, Turner et al. 1997) showed a cold iron line with EW and eV respectively (these estimates had large errors associated with them). The continuum flux was erg s -1 cm-2 in both cases. Despite the large errors, for this source flux level, the equivalent widths are in agreement with these expected according to EW vs flux plot for this source in Fig 7. Guainazzi et al. (1998) report the same EW when the source was times fainter. Their estimate appears to be inconsistent with our results, and suggests that the line follows the continuum on time scales of a year. The RXTE observations were made within a week. One explanation could then be that the line is mainly produced by the torus which is located at a distance larger than a light week and smaller than a light year.
ESO103-G35 was observed three times by ASCA (Forster et al. 1999). In all cases, the source flux was lower than during the RXTE observations. The EW of the iron line was higher ( eV), in agreement with the trend shown in Fig. 7. As in the case of NGC7172, the large EW observed by ASCA requires an extra source of line photons apart from the torus and the accretion disk. Forster et al. (1999) suggest various possibilities in order to explain this. The fact that the iron line appears broad in the RXTE observations is a direct indication that a part of the line is produced by fluorescence from the accretion disk. In fact, ESO103-G35 is the only source were a model with a variable iron line (model D’) improves significantly the goodness fit when compared to model A’. This indication of line variability supports the idea that the spectral variability in this object is due to a variable reflection component (model E’). Such a model could also explain naturally the fact that in the case of ESO103-G35 is variable while remains constant. The possible detection of line and reflection component variability in this object only indicates that the orientation of the central source may not be the same in Seyfert 2 galaxies (despite the predictions of the unification models in their simplest form). Our results are consistent with the idea that the central source in ESO103-G35 is seen close to face on and at a larger inclination in the other objects. In the latter case, the contribution from the reflection component and the disk iron line emission will be supressed and it will be more difficult to detect any variations associated with them.
The main result from the RXTE observations of the four Seyfert 2 galaxies ESO103-G35, IC5063, NGC4507 and NGC7172 is that they all show significant spectral variability in the sense that the spectrum steepens with increasing flux. This is a model independent result and is based on the analysis of the hardness ratios (see Section 4.1, Fig. 2). The origin of this variability may not be the same for all of them. In NGC4507 and NGC7172 we observe flux related and variations respectively. In ESO103-G35 the spectral variability could be due either to photon index variations (like NGC7172) or to reflection component changes. The results for IC5063 are puzzling. The stability of the iron line flux does not support reflection component variations as the reason of the observed spectral variations. On the other hand, the photon index variations are not well correlated with the continuum flux. Since this object is a radio galaxy, perhaps the normal “Seyfert - type” X-ray source in this case is “contaminated” by emission from the non-thermal source which is responsible for the radio emission.
The differences in the origin of the spectral variability observed in these objects suggest that the orientation of the nucleus and/or the distribution of the absorbing matterial around the nucleus is not the same in all Seyfert 2 galaxies. We believe that future monitoring observations of these objects with XMM mission which has both a large effective area and good spectral resolution are necessary in order to clarify the issue of spectral variability in Seyfert 2 galaxies and provide stringent constraints on the geometry of the nucleus and the location of the cirumnuclear matter.
8 Acknowledgements
We are grateful to D.A. Smith for numerous conversations and suggestions regarding the RXTE background. This research has made use of data obtained from the High Energy Astrophysics Science Archive Research Center (HEASARC), provided by NASA’s Goddard Space Flight Center.
References
- [1] Akylas, A., Georgantopoulos, I., Comastri, A., 2000, MNRAS, submitted
- [2] Antonucci, R.R.J., Miller, J.S., 1985, ApJ, 297, 621
- [3] Bassani, L., Malaguti, G., Jourdain, E., Roques, J.P., Johnson, W.N., 1995, ApJ, 444, L72
- [4] Colina, L., Sparks, W.B., Maccheto, F., 1991, ApJ, 370, 102
- [5] Comastri, A., Vignali, C., Cappi, M., Matt, G., Audano, R., Awaki, H., Ueno, S., 1998, MNRAS, 295, 443
- [6] Durret, F., Bergeron, J., 1986, A&A, 156, 51
- [7] Forster, K., Leighly, K.M., Kay, L.E., 1999, ApJ, 523, 521
- [8] Georgantopoulos, I., Papadakis, I., Warwick, R.S., Smith, D.A., Stewart, G.C., Griffiths, R..E., 1999, MNRAS, 307, 815
- [9] George, I.M., Fabian, A.C., 1991, MNRAS, 249, 352
- [10] Ghisellini, G, Haardt, F., Matt, G., 1994, MNRAS, 267, 743
- [11] Glasser, C.A., Odell, C.E., Seufert, S.E., 1994, IEEE Trans. Nucl. Sci., 41, 4
- [12] Griffiths, R.E., Warwick, R.S., Georgantopoulos, I., Done, C., Smith, D.A., 1998, MNRAS, 298, 1159
- [13] Guainazzi, M., Mihara, T., Otani, C., Matsuoka, M., 1996, PASJ, 48, 781
- [14] Guainazzi, M., Matt, G., Antonelli, L.A., Fiore, F., Piro, L., Ueno, S., 1998, MNRAS, 298, 824
- [15] Haardt, F., Maraschi, L., Ghisellini, G., 1997, ApJ, 476, 620
- [16] Halpern, J.P., 1984, ApJ, 281, 90
- [17] Inglis, M.D., Brindle, C., Hough, J.H., Young, S., Axon, D.J., Bailey, J.A., Ward, M.J., 1993, MNRAS, 263, 895
- [18] Krolik, J.H., Begelman, M.C., 1986, ApJ, 308, 55
- [19] Kulkarni, V.P. et al., 1998, ApJ, 429, L121
- [20] Leahy, D.A., Creighton, J., 1993, MNRAS, 263, 314
- [21] Lee, J.C., Fabian, A.C., Brandt, W.N., Reynolds, C.S., Iwasawa, K., 1999, MNRAS, 310, 973
- [22] Leighly, K.M., Mushotzky, R.F., Yaqoob, T., Kunieda, H., Edelson, R., 1996, ApJ, 469, 147
- [23] Lightman, A.P., White, T.R., 1988, ApJ, 335, 57
- [24] Magdziarz, P., Zdziarski, A., 1995, MNRAS, 273, 837
- [25] Mushotzky, R.F., 1982, ApJ, 256, 92
- [26] Mushotzky, R.F., Done, R.F., Pounds, K.A., 1993, ARA&A, 31, 717
- [27] Nandra, K., George, I.M., Mushotzky, R.F., Turner, T.J., Yaqoob, T., 1997, ApJ, 476, 70
- [28] Netzer, H., 1993, ApJ, 411, 594
- [29] Pan, H.C., Stewart, G.C., Pounds, K.A., 1990, MNRAS, 242, 177
- [30] Phillips, M.M., Feldman, F.R., Marshall, F.E., Wamsteker, W., 1979, A&A, 76, L14
- [31] Polletta, M., Bassani, L., Malaguti, G., Palumbo, G.G.C., Caroli, E., 1996, ApJS, 106, 399
- [32] Ryde, F., Poutanen, J., Svensson, R., Larsson, S., Ueno, S., 1997, A&A, 328,69
- [33] Sharples, R.M., Longmore, A.J., Hawarden, T.G., Carter, D., 1984, MNRAS, 208, 15
- [34] Smith, D.A., Done, C., 1996, MNRAS, 280, 355
- [35] Turner, T.J., & Pounds, K.A., 1989, MNRAS, 240, 833
- [36] Turner, T.J., George, I.M., Nandra, K., Mushotzky, R.F., 1997, ApJS, 113, 23
- [37] Turner, T.J., George, I.M., Nandra, K., Mushotzky, R.F., 1998, ApJ, 493, 91
- [38] Warwick, R.S., Pounds, K.A., Turner, T.J., 1988, MNRAS, 231, 1145
- [39] Warwick, R.S., Sembay, S., Yaqoob, T., Makishima, K., Ohashi, T., Tashiro, M., Kohmura, Y., 1993, MNRAS, 265, 412
- [40] Warwick, R.S., et al. 1996, ApJ, 470, 349
- [41] Ulvestad, J.S., Wilson, A.S., 1984, ApJ, 285, 439
| Model | Energy (keV) | (keV) | /dof | ||
|---|---|---|---|---|---|
| A1 | 791.3/730 | ||||
| B2 | 684.3/716 | ||||
| C3 | 629.4/716 | ||||
| D4 | 0.1 | 723.7/716 |
Notes: 1 , tied; 2 untied,
tied; 3 tied, untied;
4
gaussian line normalizations untied ; 5 in units of
| Model | Energy (keV) | (keV) | /dof | ||
|---|---|---|---|---|---|
| A1 | 310.0/240 | ||||
| B2 | 191.9/236 | ||||
| C3 | 177.2/236 | ||||
| D4 | 302.6/236 |
Notes: 1 , tied; 2 untied,
tied; 3 tied, untied;
4
gaussian line normalizations untied ; 5 in units of
| Model | Energy (keV) | (keV) | /dof | ||
|---|---|---|---|---|---|
| A1 | 887.2/807 | ||||
| B2 | 742.5/794 | ||||
| C3 | 763.7/794 | ||||
| D4 | 815.8/794 |
Notes: 1 , tied; 2 untied,
tied; 3 tied, untied;
4
gaussian line normalizations untied ; 5 in units of
| Model | Energy (keV) | (keV) | /dof | ||
|---|---|---|---|---|---|
| A1 | 0.1 | 304.2/437 | |||
| B2 | 0.1 | 274.6/429 | |||
| C3 | 0.1 | 274.7/429 | |||
| D4 | 0.1 | 299.8/429 |
Notes: 1 , tied; 2 untied,
tied; 3 tied, untied;
4 gaussian line normalizations untied ; 5 in units of
| Model | Energy (keV) | (keV) | /dof | ||
|---|---|---|---|---|---|
| A’2 | 1.9 | 627.5/730 | |||
| B’3 | 1.9 | 556.2/716 | |||
| C’4 | 523.5/715 | ||||
| D’5 | 1.9 | 604.7/716 | |||
| E’6 | 1.9 | 525.8/716 |
Notes: 1 in units of ;
2 , tied; 3 untied,
tied; 4 tied, untied;
5 gaussian line normalizations untied ; 6
reflection component normalisation untied
| Model | Energy (keV) | (keV) | /dof | ||
|---|---|---|---|---|---|
| A’2 | 1.9 | 0.1 | 269.3/241 | ||
| B’3 | 1.9 | 0.1 | 186.8/237 | ||
| C’4 | 0.1 | 181.8/236 | |||
| D’5 | 1.9 | 0.1 | 264.3/237 | ||
| E’6 | 1.9 | 0.1 | 176.7/237 |
Notes: 1 in units of ;
2 , tied; 3 untied,
tied; 4 tied, untied;
5 gaussian line normalizations untied ; 6
reflection component normalisation untied
| Model | Energy (keV) | (keV) | /dof | ||
|---|---|---|---|---|---|
| A’2 | 1.9 | 0.1 | 737.2/807 | ||
| B’3 | 1.9 | 0.1 | 701.5/795 | ||
| C’4 | 0.1 | 700.7/794 | |||
| D’5 | 1.9 | 0.1 | 732.0/795 | ||
| E’6 | 1.9 | 0.1 | 717.8/795 |
Notes: 1 in units of ;
2 , tied; 3 untied,
tied; 4 tied, untied;
5 gaussian line normalizations untied ; 6
reflection component normalisation untied
| Model | Energy (keV) | (keV) | /dof | ||
|---|---|---|---|---|---|
| A’2 | 1.9 | 0.1 | 299.7/436 | ||
| B’3 | 1.9 | 0.1 | 273.5/428 | ||
| C’4 | 0.1 | 274.1/428 | |||
| D’5 | 1.9 | 0.1 | 297.1/428 | ||
| E’6 | 1.9 | 0.1 | 280.7/428 |
Notes: 1 in units of ;
2 , tied; 3 untied,
tied; 4 tied, untied;
5 gaussian line normalizations untied ; 6
reflection component normalisation untied