CLASS B0739+366: A new two-image gravitational lens system
Abstract
We present the discovery of CLASS B0739+366, a new gravitational lens system from the Cosmic Lens All-Sky Survey. Radio imaging of the source with the Very Large Array (VLA) shows two compact components separated by , with a flux density ratio of 6:1. High-resolution follow-up observations using the Very Long Baseline Array (VLBA) at 1.7 GHz detect weak, parity-reversed jet emission from each of the radio components. Hubble Space Telescope NICMOS F160W observations detect infrared counterparts to the lensed images, as well as an extended object between them which we identify as the lensing galaxy. Redshifts for the galaxy and lensed source have not yet been obtained. For typical lens and source redshifts of and , respectively, preliminary mass modeling predicts a time delay of days in a flat universe. The small predicted time delay and weak radio components will make CLASS B0739+366 a challenging target for Hubble constant determination.
1 Introduction
Gravitational lensing is a potent tool for addressing a number of current problems in cosmology and astrophysics. First, measured time delays between the images of a lensed source, when combined with a well-constrained mass model for the system, allow for a determination of the Hubble constant, (Refsdal 1964). Thus far time delays have been measured for six gravitational lens systems (Schechter et al. 1997; Kundic et al. 1997; Lovell et al. 1998; Biggs et al. 1999; Fassnacht et al. 1999b; Koopmans et al. 2000) and favor a Hubble constant of (Koopmans & Fassnacht 1999). Second, the lensing rate in a systematic survey can place strong limits on the cosmological density parameters, particularly the cosmological constant (Turner, Ostriker & Gott 1984; Turner 1990). For flat () cosmological models, recent analyses favor at confidence (Kochanek 1996; Falco, Kochanek & Muñoz 1998; Helbig et al. 1999). Finally, gravitational lensing is an excellent means of constraining the properties of galaxy mass distributions (Kochanek 1991).
The Cosmic Lens All-Sky Survey (CLASS; Browne et al. 1999; Myers et al. in preparation) seeks to discover new cases of gravitational lensing among flat-spectrum radio sources. Such sources are compact, which eases the identification of multiple imaging, and variable, so time delays can be measured from component lightcurves. CLASS builds upon the success of the Jodrell-VLA Astrometric Survey (JVAS; Patnaik et al. 1992; Browne et al. 1998; Wilkinson et al. 1998; King et al. 1999) and extends the search to weaker flux densities. CLASS has observed over sources with the Very Large Array (VLA) in A-configuration at 8.4 GHz. The observations have been performed over four phases (CLASS 1–4) from spring 1994 to summer 1999, and are now complete.
Sources in the first two phases of CLASS were selected from the 87GB 5 GHz catalogue (Gregory & Condon 1991), with mJy and spectral index (where ) between 5 GHz and the 327 MHz Westerbork Northern Sky Survey (WENSS; Rengelink et al. 1997) or the 365 MHz Texas Survey (Douglas et al. 1996). Recently, the sources in the CLASS sample were reselected using the 5 GHz GB6 catalogue (Gregory et al. 1996) and the 1.4 GHz NRAO VLA Sky Survey (NVSS; Condon et al. 1998), with a 5 GHz cutoff of 30 mJy and the same spectral criteria. The final CLASS statistical sample will consist of sources (Myers et al. in preparation).
The VLA survey data are calibrated in the data reduction package AIPS with the usual procedure, and are mapped using an automated script within the imaging package DIFMAP (Shepherd 1997). The data are then modeled with Gaussian components, which provides a quantitative means of describing the observed radio morphologies. Sources modeled with multiple compact components are selected as preliminary lens candidates. These candidates are followed up with high-resolution radio observations using the Multi-Element Radio-Linked Interferometer Network (MERLIN) and then the Very Long Baseline Array (VLBA) for the few surviving sources. The vast majority of the lens candidates are rejected on surface brightness and morphological grounds. Those candidates surviving the radio filter are followed up further with optical and/or near-infrared imaging and spectroscopy.
The first phase of CLASS observations (CLASS–1) has yielded four new lens systems: B0712+472 (Jackson et al. 1998), B1600+434 (Jackson et al. 1995), B1608+656 (Myers et al. 1995) and B1933+503 (Sykes et al. 1998). The second series of observations (CLASS–2) has until now produced three new lenses: B1127+385 (Koopmans et al. 1999), B1555+375 (Marlow et al. 1999) and B2045+265 (Fassnacht et al. 1999a). Two additional lens systems have recently been discovered during the third phase of CLASS observations (CLASS–3): B1152+199 and B1359+154 (Myers et al. 1999; Rusin et al. 2000). Radio follow-up observations of the remaining CLASS–3 and CLASS–4 candidates are currently taking place.
Here we present the discovery of a new two-image gravitational lens system from CLASS–2: B0739+366. In section 2 we outline the radio observations of the source. Section 3 describes NICMOS imaging of the lens. In section 4 a preliminary mass model for the lens system is presented. Section 5 concludes with a summary of our results and discusses future work.
2 Radio Observations
2.1 VLA and MERLIN Observations
The B0739+366 system was observed on 1995 August 13 with the VLA at 8.4 GHz in A-configuration during the second phase of the CLASS survey observations. The data were modeled within DIFMAP by two compact Gaussian components separated by , with a flux density ratio of 6.4:1. The final map is shown in Fig. 1 and has an angular resolution of . Follow-up VLA 5, 8.4 and 15 GHz A-configuration observations were performed on 1999 August 30. The component flux densities are given in Table 1. The spectral indices of the components are and (), respectively, between 5 GHz and 15 GHz. Since the B0739+366 VLA survey data were fitted with multiple compact components, the source was considered a promising lens candidate and selected for high-resolution radio follow-up.
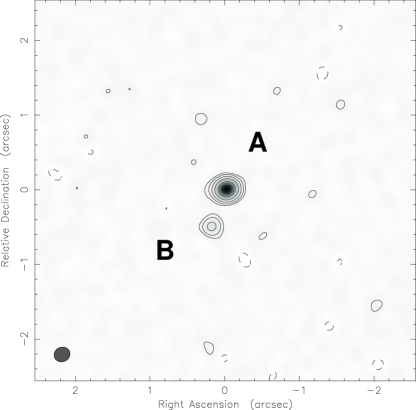
MERLIN 5 GHz snapshot observations of B0739+366 were performed on 1996 December 27. The data were modeled by two compact components with a flux density ratio of 6.9:1. Subsequently, a second MERLIN 5 GHz observation was made on 1998 December 4. The total integration time was 12 hours. The final map (Fig. 2) shows a slight extension to the primary image. The compactness of the components and their similarity in spectral index are evidence of the lensed nature of this system.
2.2 VLBA Observations
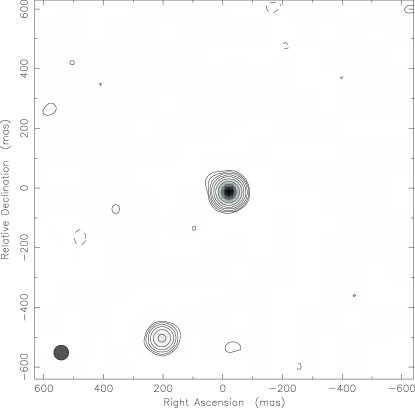
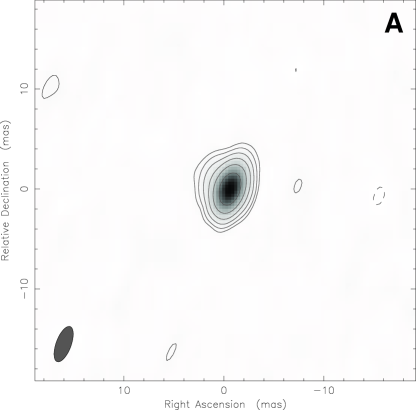
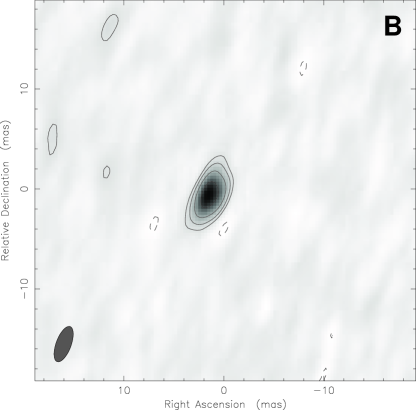
VLBA 5 GHz observations of B0739+366 were obtained on 1997 August 2. Snapshots were taken over a range of hour angles to synthesize -coverage. The total integration time was 32 minutes. Phase referencing was performed by switching from the nearby strong VLBI calibrator B0738+313. Fringe-fitting was performed on B0738+313 and the solutions were transferred to B0739+366 directly. Both components seen in the MERLIN map were detected. The naturally-weighted 5 GHz VLBA maps are shown in Fig. 3 and have a resolution of mas and an RMS noise level of Jy/beam. The primary component shows evidence of substructure and was modeled by two Gaussian subcomponents. The secondary component appears to be very slightly resolved, but was modeled by a single Gaussian. The positions, flux densities and sizes of the VLBA modelfit components are listed in Table 2.
A deep 1.7 GHz VLBA observation of the system was obtained on 1999 August 29. Alternate observations of the target source and a phase reference source (B0749+376) were iterated on a cycle of 3 minutes and 1.5 minutes, respectively. The total integration time was 8 hours. Fringe-fitting was performed on B0749+376 and the solutions were transferred to B0739+366. Naturally-weighted 1.7 GHz VLBA longtrack maps of B0739+366 are shown in Fig. 4. The maps have a resolution of mas and an RMS noise level of Jy/beam. Weak, extended jet emission is detected to the east of component A and to the west of component B. The oppositely directed jets in A and B are characteristic of parity reversal induced by gravitational lensing.
3 HST/NICMOS Observations
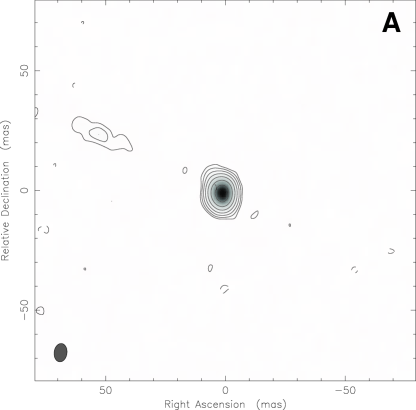
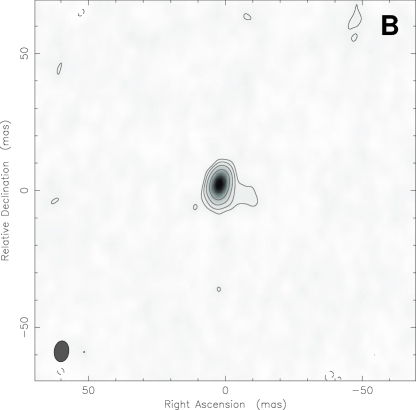
Hubble Space Telescope (HST) observations of B0739+366 were performed on 1998 April 10 with the Near-Infrared Camera and Multi-Object Spectrometer (NICMOS). The F160W filter was used, which corresponds roughly to ground-based band. The observations were performed with the NIC1 camera, which has a detector scale of 43 mas/pixel and a field-of-view of . The total exposure time was 2624 seconds. The data were subjected to the standard calibration pipeline involving bias and dark current subtraction, linearity and flat-field correction, photometric calibration and cosmic ray removal.
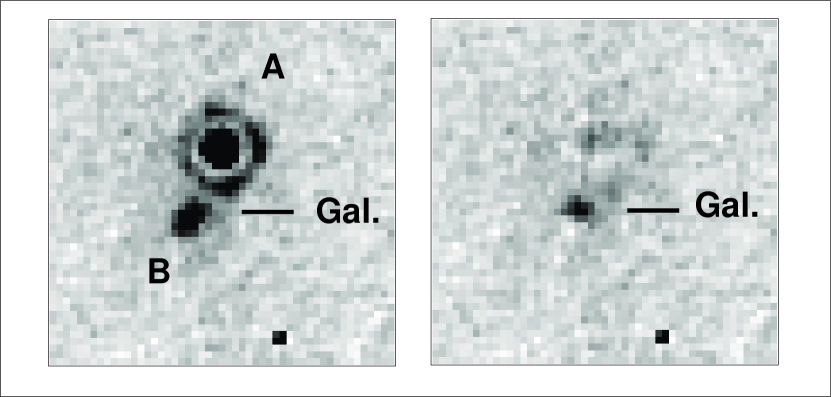
The calibrated image (Fig. 5) shows two clear emission peaks corresponding to the lensed images. The ring surrounding component A is due to the NICMOS point-spread function (PSF). In addition, an extended emission feature appears to be blended with component B. We identify this with the lensing galaxy. The relative positions of the lensed images match those seen at radio wavelengths to within mas. The F160W magnitudes are for image A, for image B and for the galaxy.
A PSF subtraction was performed to better study the lensing galaxy. First a standard TinyTim PSF (Krist & Hook 1997) for the NICMOS/F160W filter was fitted to the center of component A using the MAXFIT task in the AIPS data analysis package. Component A was removed using a manually-scaled best-fit PSF. The PSF was then shifted to the radio position of component B, which was removed using a scaled fit. The ratio subtracted at A and B was 6.3 with an error of approximately 0.4. This is very close to the ratio of flux densities measured for the radio components, and indicates very little dust extinction at band, assuming no variability of the lensed source. The subtracted image (Fig. 5) offers a greatly improved view of the lensing galaxy. The detection of optical counterparts to the radio components along with extended galaxy emission provides strong evidence for the lensing hypothesis.
4 Modeling
In this section we present a preliminary mass model that describes the observed properties of the B0739+366 lens system. We assumed a flat universe with , a lens redshift of and a source redshift of for all calculations.
We modeled the system with a singular isothermal ellipsoid mass distribution (SIE; Kormann, Schneider & Bartelmann 1994). Although each radio component exhibits core and jet emission, the jet features are quite weak and highly resolved. Since their centroids are poorly determined, they are unlikely to provide good additional modeling constraints at the present time. Therefore we use only the positions of the core components in our modeling analysis.
To limit the number of free parameters and ensure a constrained model, we fixed the SIE on the surface brightness center of the lens galaxy from the NICMOS image. The model therefore has only five free parameters – the lens velocity dispersion, axial ratio and position angle, and two source coordinates. The 5 GHz VLBA data provided five constraints – four absolute image coordinates and a flux density ratio. The number of degrees of freedom (NDF) is therefore zero. The position of component A was taken to be that of VLBA component A1. The flux density of component A was taken to be the sum of A1 and A2.
Modeling was performed with an image plane minimization, as described by Kochanek (1991). We optimized the goodness of fit parameter using the image positions and magnification ratio ,
| (1) |
where primed quantities are model-predicted and unprimed quantities are observed. Because NDF , the best-fit model is described by , independent of the positional and flux density errors. The optimized model parameters, predicted magnifications and time delays are listed in Table 3. The critical curves and caustics for the system are shown in Fig. 6.
A series of Monte Carlo simulations was performed to examine the stability of the best-fit model parameters. Gaussian-distributed errors accounting for observational uncertainties were added simultaneously to the galaxy position ( mas in each coordinate) and component flux densities (). This latter uncertainty also accounts for the possible effect of source variability on the flux density ratio. The optimized model parameters and recovered time delay were determined for each of 10,000 trials. The uncertainties in the best-fit model parameters were found from the ranges enclosing of the results, and are given in Table 3.
5 Summary and Future Work
We have discovered a new gravitational lens system in the Cosmic Lens All-Sky Survey – CLASS B0739+366. The system consists of two components separated by , with a flux density ratio of 6:1. VLA observations have determined that the spectral indices of the radio components agree within the measurement errors. Follow-up observations with the VLBA have detected jet emission extending from each of the radio components. The jets are oppositely directed, and provide a classic example of lensing-induced parity reversal. All available radio data of B0739+366 is therefore consistent with what is expected for a gravitational lens system.
HST/NICMOS imaging has detected infrared counterparts to each of the radio components, as well as an extended emission feature which we identify with the lensing galaxy. These observations offer further proof for the lensing hypothesis. We note that no lens candidate that has survived high-resolution radio and optical filters such as those presented here has ever been rejected by additional observations.
A preliminary lens model has been constructed using constraints derived from the VLBA and HST data. Assuming typical lens and source redshifts of and , respectively, the predicted time delay between the lensed components is days for and a flat cosmology. The error on the time delay due to observational uncertainties is roughly .
Deeper VLBA or global VLBI observations of B0739+366 are required to study the extended jet emission present in each of the lensed radio components, with a view to acquiring additional constraints on our lens model. Such observations would demand significantly longer integrations than those already undertaken ( hr), as the jets are very weak and extended. Future optical observations will focus on obtaining redshifts for both the lensing galaxy and lensed source. Redshifts are necessary to convert a measured time delay into a value of the Hubble constant, and will also provide important input to statistical analyses of the CLASS survey data.
Even if the redshifts can be measured, CLASS B0739+366 will be a challenging lens system to use for Hubble constant determination. First, the predicted time delay is quite short, which would require a rather densely sampled monitoring program. Second, the weakness of component B will make it difficult to construct a clean lightcurve for this image. A moderately variable source (with an amplitude of ) would produce features at the level of only a few tenths of a mJy in component B, which is approximately the error associated with absolute flux densities derived from VLA monitoring observations (eg. Fassnacht et al. 1999b; Koopmans et al. 2000). In addition, the lightcurves of weak compact radio images could be susceptible to scintillation, as the component sizes may not be more than a few tens of microarcseconds (eg. Koopmans & de Bruyn 2000). For these reasons B0739+366 is not considered one of the best CLASS lenses with which to determine . However, when combined with the other lenses discovered in the JVAS and CLASS surveys, this system will add to the statistical evidence placing limits on the values of the cosmological energy densities.
References
- (1)
- (2) Biggs, A.D., Browne, I.W.A., Helbig, P., Koopmans, L.V.E., Wilkinson, P.N., Perley, R.A. 1999, MNRAS, 304, 349
- (3)
- (4) Browne, I.W.A., Wilkinson, P.N., Patnaik, A.R., Wrobel, J.M. 1998, MNRAS, 293, 257
- (5)
- (6) Browne, I.W.A., et al. 1999, to appear in “Gravitational Lensing: Recent Progress and Future Goals,” eds. T. Brainerd and C. Kochanek
- (7)
- (8) Condon, J.J., Cotton, W.D., Greisen, E.W., Yin, Q.F., Perley, R.A., Taylor, G.B., Broderick, J.J. 1998, AJ, 115, 1693
- (9)
- (10) Douglas, J.N., Bash, F.N., Bozyan, F.A., Torrence, G.W., Wolfe, C. 1996, AJ, 111, 1945
- (11)
- (12) Falco, E.E., Kochanek, C.S. and Muñoz, J.A. 1998, ApJ, 494, 47
- (13)
- (14) Fassnacht, C.D., et al. 1999a, AJ, 117, 658
- (15)
- (16) Fassnacht, C.D., Pearson, T.J., Readhead, A.C.S., Browne, I.W.A., Koopmans, L.V.E., Myers, S.T., Wilkinson, P.N. 1999b, ApJ, 527, 498
- (17)
- (18) Gregory, P.C., Condon, J.J. 1991, ApJS, 75, 1011
- (19)
- (20) Gregory, P.C., Scott, W.K., Douglas, K., Condon, J.J. 1996, ApJS, 103, 427
- (21)
- (22) Helbig, P.J., Marlow, D., Quast, R., Wilkinson, P.N., Browne, I.W.A., Koopmans, L.V.E. 1999, A&A, 136, 297
- (23)
- (24) Jackson, N., et al. 1995, MNRAS, 274L, 25
- (25)
- (26) Jackson, N., et al. 1998, MNRAS, 296, 483
- (27)
- (28) King, L.J., Browne, I.W.A., Marlow, D.R., Patnaik, A.R., Wilkinson, P.N. 1999, MNRAS, 307, 225
- (29)
- (30) Kochanek, C.S. 1991, ApJ, 373, 354
- (31)
- (32) Kochanek, C.S. 1996, ApJ, 466, 638
- (33)
- (34) Koopmans, L.V.E., et al. 1999, MNRAS, 303, 727
- (35)
- (36) Koopmans, L.V.E., Fassnacht, C.D. 1999, ApJ, 527, 513
- (37)
- (38) Koopmans, L.V.E., de Bruyn, A.D., Xanthopoulos, E., Fassnacht, C.D. 2000, A&A, 356, 391
- (39)
- (40) Koopmans, L.V.E., de Bruyn, A.G. 2000, A&A, 358, 793
- (41)
- (42) Kormann, R., Schneider, P., Bartelmann, M. 1994, A&AS, 284, 285
- (43)
- (44) Krist, J.E., Hook, R. 1997, Proc. HST calibration workshop, p. 192, STScI
- (45)
- (46) Kundic, T., et al. 1997, ApJL, 482, 75
- (47)
- (48) Lovell, J.E.J., Jauncey, D.L., Reynolds, J.E., Wieringa, M.H., King, E.A., Tzioumis, A.K., McCullough, P.M., Edwards, P.G. 1998, ApJL, 508, 51
- (49)
- (50) Marlow, D.R., et al. 1999, AJ, 118, 654
- (51)
- (52) Myers, S.T., et al. 1995, ApJL, 447, 5
- (53)
- (54) Myers, S.T., et al. 1999, AJ, 117, 2565
- (55)
- (56) Patnaik, A.R., Browne, I.W.A., Wilkinson, P.N. & Wrobel, J.M. 1992, MNRAS, 254, 655
- (57)
- (58) Refsdal, S. 1964, MNRAS, 128, 307
- (59)
- (60) Rengelink, R.B., Tang, Y., de Bruyn, A.G., Miley, G.K., Bremer, M.N., Roettgering, H.J.A., Bremer, M.A.R. 1997, A&AS, 124, 259
- (61)
- (62) Rusin, D., Hall, P.B., Nichol, R.C., Marlow, D.R., Richards, A.M.S., Myers, S.T. 2000, ApJL, 533, 89
- (63)
- (64) Schechter, P.L., et al. 1997, ApJL, 475, 85
- (65)
- (66) Shepherd, M.C. 1997, in Astronomical Data Analysis Software and Systems IV, eds. G. Hunt and H. E. Payne, (ASP Conference Series, v125) 77
- (67)
- (68) Sykes, C.M., et al. 1998, MNRAS, 301, 310
- (69)
- (70) Turner, E.L., Ostriker, J.P., Gott, J.R. 1984, ApJ, 284, 1
- (71)
- (72) Turner, E.L. 1990, ApJL, 365, 43
- (73)
- (74) Wilkinson, P.N., Browne, I.W.A., Patnaik, A.R., Wrobel, J.M., Sorathia, B. 1998, MNRAS, 300, 790
- (75)
| Comp | (mJy) | (mJy) | (mJy) | (mJy) |
|---|---|---|---|---|
| A | 26.8 | 21.7 | 20.3 | 19.1 |
| B | 4.9 | 3.4 | 3.8 | 2.8 |
| Comp | Offset (E) | Offset (N) | (mJy) | (mas) |
|---|---|---|---|---|
| A1 | 0 | 0 | 29.0 | 1.6 |
| A2 | 2.1 | 1.7 | ||
| B | 6.2 | 2.0 |
| Parameter | Model |
|---|---|
| (km/s) | |
| (, ) | |
| (, ) | |
| , | |
| ( days) |
 |
 |
 |
 |