THE HE II EMITTING NEBULA N44C IN THE LMC: OPTICAL/UV SPECTROSCOPY OF THE NEBULA AND ITS IONIZING STAR11affiliation: Based in part on observations with the NASA/ESA Hubble Space Telescope obtained at the Space Telescope Science Institute, which is operated by the Association of Universities for Research in Astronomy, Inc., under NASA contract NAS5-26555.
Abstract
We present HST spectroscopy and imaging, along with new ground-based spectroscopy and ROSAT HRI imaging, of the He II emitting nebula N44C and its ionizing star. A GHRS spectrogram of the ionizing star yields a spectral type of about O7 for the star. The lack of P Cygni profiles for Si IV and C IV indicates that the star is not a supergiant. The nebular abundances in the ionized gas are consistent with average abundances for LMC H II regions, with the possible exception that nitrogen may be enhanced. Enrichment by a former evolved companion star is not evident. A long-slit echelle spectrogram in H + [N II] shows no evidence for high-velocity gas in N44C. This rules out high-velocity shocks as the source of the nebular He II emission. A 108 ks ROSAT HRI image of N44C shows no X-ray point source to a 3 upper limit 1034 erg s-1 in the 0.1-2.0 keV band. Based on new measurements of the electron density in the He II emitting region, we derive recombination timescales of 20 yrs for He+2 and 4 yrs for Ne+4. If N44C is a fossil X-ray ionized nebula, this places severe constraints on when the putative X-ray source could have turned off. The presence of strong [Ne IV] emission in the nebula is puzzling if the ionizing source has turned off. It is possible the system is related to the Be X-ray binaries, although the O star in N44C does not show Be characteristics at the present time. Monitoring of X-rays and He II emission from the nebula, as well as a radial velocity study of the ionizing star, are needed to fully understand the emission line spectrum of N44C.
1 Introduction
Despite more than a century of observing and classifying stars, nature continues to surprise us with exotic and fascinating new species in the stellar zoo. Such has been the case with the recent discovery of several otherwise normal H II regions that exhibit strong nebular He II recombination line emission (Stasińska, Testor, & Heydari-Malayeri, 1986; Pakull & Angebault, 1986; Garnett et al., 1991). Such emission is unknown in normal H II regions: He+2 requires ionizing photons of at least 54 eV to exist in photoionized nebulae, and so is normally seen only in nebulae with very hot stars such as planetary nebulae. Nevertheless, six H II regions with nebular He II emission have been identified in Local Group galaxies (see Garnett et al. (1991); Dopita et al. (1990)). Four of these nebulae appear to be ionized by high-excitation WO or WN stars, while one is ionized by the massive X-ray binary LMC X-1 (Pakull & Angebault, 1986). The sixth, the nebula N44C in the LMC, has an uncertain ionization source, and is the subject of this paper.
Of all these objects, LMC-N44C is perhaps the most intriguing. N44C is part of the large H II complex N44, which includes the OB associations LH 47 and LH 48. N44C is a very high-excitation nebula, with [O III] 5007 Å/H ratios as high as 8 in parts of the nebula, and strong He II emission as well (Stasińska, Testor, & Heydari-Malayeri, 1986) – characteristics common to planetary nebulae. Nevertheless, N44C is too large ( 60 arcsec or 14.5 pc diameter) and too luminous [L(H) 4.51037 ergs s-1, L(4686) 61035 ergs s-1 (Garnett et al., 1991)] to be a classical PN. From the observed nebular L(4686)/L(H) luminosity ratio, Stasińska, Testor, & Heydari-Malayeri (1986) and Garnett et al. (1991) both deduced that an ionizing star would need to have 70,000 K, based on non-LTE model stellar atmospheres, to account for the observed He II emission.
Photometric studies of stars in the field of N44C (Stasińska, Testor, & Heydari-Malayeri, 1986; Oey & Massey, 1995), show only one likely candidate for the ionizing star – identified as Star 2 in Stasińska, Testor, & Heydari-Malayeri (1986), with V = 14.2, B–V = –0.22 (Oey & Massey, 1995). Yet this star appears to be a normal O star: estimates of the spectral type of this star range between O4 and O7 (Stasińska, Testor, & Heydari-Malayeri, 1986; Pakull & Motch, 1989; Oey & Massey, 1995). Spectral classification of the star is somewhat uncertain because of contamination from strong emission lines of H, He I, and He II from the surrounding high surface brightness nebula.
Determining the spectral type of the star is critical to understanding the nature of the ionization source. A normal mid to late-type O main sequence star is very unlikely to produce sufficient photons above 54 eV to account for the nebular He II emission. Because of this, Pakull & Motch (1989) hypothesized that N44C is a fossil X-ray-ionized nebula whose X-ray source had switched off in the recent past. On the other hand, non-LTE stellar atmosphere models by Gabler et al. (1992) suggest that hot ( 50,000 K) stars near the Eddington limit could account for observed nebular He II emission in some cases; such stars would appear as extreme O supergiants. Although the published results appear to rule out this hypothesis for the ionizing star of N44C, the uncertainty in determining the spectral type from the optical spectrum suggests that another approach is in order.
In this paper we present a comprehensive imaging and spectroscopic study of N44C and its ionizing star. We have obtained narrow-band imaging and UV/optical spectroscopy of the nebula using both ground-based telescopes and the Hubble Space Telescope to study the ionization balance and element abundances in the nebula, in order to better understand the ionization mechanism and to look for abundance anomalies that would signal the presence of a highly evolved star. We have also obtained an ultraviolet spectrogram of Star 2 with the Goddard High Resolution Spectrograph (GHRS) on HST to determine the stellar spectral type free of uncertainties due to nebular contamination. Our goals are to understand better the physical properties of N44C and the ionizing star, and to answer the question of whether Star 2 is the actual source of the ionizing photons powering the nebular He II emission.
The importance of understanding the origin of this unusual nebular He II emission goes beyond the peculiarity of the stars themselves. Numerous metal-poor starburst galaxies exhibit narrow He II emission (e.g., Campbell, Terlevich, & Melnick (1986); Kunth & Sargent (1983)), often interpreted as nebular emission. This may indicate that unusually hot ionizing stars are relatively common in starbursts. Many do not show WR features however, and so hot O stars may be the cause. The existence of very hot extreme O stars and WR stars in distant giant H II regions will affect the nebular ionization balance and complicate the use of nebular diagnostics to understand the massive star population in distant star-forming regions. These hot stars may be important in young galaxies as well, and so may have an important effect on the spectral appearance of star-forming galaxies at high redshift. Some authors (e.g., Melnick & Heydari-Malayeri (1991)) have identified the He+-ionizing stars as the putative “warmers”, postulated hot Wolf-Rayet stars which are capable of producing the hard ionizing continuum needed to explain the spectra of some active galactic nuclei; synthetic spectra of starbursts including such hot stars are also becoming common (e.g., Schmutz, Leitherer, & Gruenwald (1992)). However, the local examples of these stars need to be studied in greater detail before their applicability to AGNs and starbursts can be properly assessed.
2 Observations
2.1 Ground-based Optical Imaging
Narrow-band optical images of N44C were obtained as part of a general search for high-excitation H II regions in the Magellanic Clouds. These images were taken in December 1991 using the 0.9-m telescope at Cerro Tololo Interamerican Observatory. A Tektronix 10241024 CCD was used as the detector; the field covered in each image was 405405, at a pixel scale of 04 per pixel. The seeing at the time of the observations was about 2. We used narrow-band filters from the Rutgers Fabry-Perot order-sorting set to image the region in H, [O III] 5007 Å, He II 4686 Å, and the continuum at 5081 Å. Central wavelengths of the four filters were 4861 Å, 4993 Å, 4685 Å, and 5081 Å; all filters have bandwidths of 44 Å FWHM. Generally, the exposures were short because of the survey nature of the observations: 600 s for H, 300 s each for the [O III] and 5081 Å filters, and 900s in the 4686 Å filter.
For each image, we subtracted a DC offset determined from the overscan region of each frame, as well as a bias which was constructed from the median of 35 zero exposure images. The images were flat-fielded using exposures of the illuminated dome taken through the appropriate filter. Seven to ten dome exposures were obtained through each filter and combined by averaging with a sigma-clipping algorithm to reject cosmic rays. The combined images were normalized to provide a master flat field for each filter, which was then divided into the object frames. We converted count rates in the reduced emission line images to fluxes using our long-slit 4-m spectra (see below). We will use these images primarily to measure integrated H and He II 4686 Å luminosities for N44C.
2.2 Ground-based Optical Spectroscopy
Long-slit optical spectra of N44C were also obtained at CTIO in December 1991. We used the RC spectrograph on the 4-m reflector to obtain both blue and red spectra of the nebula. Grating KPGL1 was used in first order to observe the 3350-5500 Å wavelength region at 3.8 Å resolution (FWHM), while grating 181 was used in first order with a GG385 order-sorting filter to cover the 4200-8500 Å region at approximately 7 Å resolution; a Reticon 1200400 CCD was the detector. Five 120 s exposures were made with the blue setting and seven 60 s exposures with the red setting; the exposure times were kept short to avoid overexposure in the very strong [O III] lines. The 2 by 330 slit was oriented N-S and approximately centered on Star 2; both Star 2 and Star 1 located about 8 to the south were included in the slit.
Our reduction of the data followed common practice for two-dimensional spectra. The DC offset and a bias image were subtracted from the spectral images. A normalized flat-field, constructed from images of the illuminated dome and twilight sky, was divided into each frame to correct for both pixel-to-pixel sensitivity variations and non-uniform illumination of the slit. We solved for the wavelength as a function of pixel position using a He-Ne-Ar arc lamp spectrum, fitting a low-order polynomial function to the line positions. The rms residuals of the actual to fitted wavelengths were of order 0.1 pixel, or 0.4-0.7 Å. The spectra were corrected for atmospheric extinction using mean CTIO extinction coefficients. Finally, the photometric flux calibration was determined from observations of spectrophotometric standard stars from the list of Stone & Baldwin (1983), with the red extended data of Hamuy et al. (1992). The standard stars were observed with the slit width opened to 10 to reduce slit losses. At least three standards were observed on each night. The calibrated images were combined with an averaged sigma-clipping algorithm.
We extracted a one-dimensional spectrum by summing the two-dimensional data over the entire region of emission from N44C, including the ionizing star, and excluding the nebular emission outside the nebular boundary. Our spectra were taken during near full moon, so the sky background was relatively high. Background subtraction for the N44C frames was complicated by the extent of the nebulosity along the slit and by numerous stars within the slit. Nevertheless, we located sufficient regions clear of nebulosity and stars to determine and subtract accurately the sky background. The background was determined by a linear fit over those regions. Residual [O I] 5577 Å night-sky emission in the red spectrum amounted to only about 3% of the original line flux, while residual OH sky emission was not detected. The Hg I 4358 Å airglow line was almost negligibly weak in our blue spectrum; the [O III] 4363 Å line, shifted to 4368 Å by the LMC radial velocity, was thus not affected by airglow contamination. Figure 1 displays our fully calibrated and extracted one-dimensional blue and red spectra.
The Reticon spectra suffered somewhat from focus variations due to the wrinkled surface of the chip. Care was taken so that important closely-separated sets of lines, such as H and [O III] 4363 Å and the H-[N II] group, were in well-focused regions of the detector. The effects of the focus variations are evident in the distorted profiles of the [O III] 4959, 5007 Å and H lines in the blue spectrum (Figure 1).
2.3 HST Spectroscopy
N44C-Star 2 was observed with the Goddard High Resolution Spectrograph (GHRS) on the Hubble Space Telescope during Cycle 6. We employed the low-resolution grating G140L to observe the 1200-1765 Å region in two settings with a resolving power R = 2000. A journal of the observations is given in Table 1. A loss of guide star lock resulted in a premature end to the shorter-wavelength GHRS observation, with central wavelength 1342 Å, from the planned 760 s to 235 s. Despite this, the spectrum had sufficient signal/noise (S/N 10 per pixel) for classification of the star. The redward exposure, with central wavelength 1617 Å was carried out with the planned exposure time. The spectra were reduced by the STScI pipeline. Comparison of the blue and red spectra showed excellent photometric consistency in the 18 Å region of overlap. We conclude from this that the loss of lock did not affect the photometry of the first spectrum. We show the merged GHRS spectrogram of Star 2 in Figure 2, along with UV spectra of comparison O III-V stars in the Magellanic Clouds from Walborn et al. (1995).
Immediately following the GHRS observations, we obtained spectroscopy of the nebula with the Faint Object Spectrograph (FOS). The 086 circular aperture was positioned 3 north of Star 2, to sample the region of highest surface brightness. The FOS observations were planned to cover the 1200-6800 Å spectral region with five of the high-dispersion (R = 1200) gratings. The two original FOS/BL observations failed because the FOS aperture door failed to open during the exposures. We therefore repeated four of the FOS exposures in February 1997 (excluding G270H). Comparison of the G190H exposures taken at the two epochs, and the G570H exposures also, showed good agreement. Therefore, we averaged the multiple G190H and G570H exposures to improve the signal/noise. These data were also processed with the STScI pipeline, and Table 1 gives the journal for these observations. Portions of the FOS spectrogram are shown in Figures 3 and 4.
2.4 WFPC-2 Imaging
In addition to the HST spectroscopy, we obtained WFPC-2 narrow-band images of N44C in Cycle 6 to look for evidence of filamentary structure that might indicate a shock and to look for evidence of a companion to Star 2 on scales of a few thousand AU (0.1 arcsec 5000 AU at the distance of the LMC). We collected images in F502N ([O III]), F547M (emission-free continuum), F656N (H), and F675W (red continuum). The telescope was positioned so that Star 2 was centered in chip WF2 of the camera. These images were processed through the HST pipeline and mosaicked to produce the final images. A color composite of the F656N, F502N, and F547M images is shown in Figure 5.
3 The UV Spectrum of the Ionizing Star
N44C Star 2 was identified as the primary source of ionizing photons for the nebula early on by Stasińska, Testor, & Heydari-Malayeri (1986), based on the stellar colors, O-type spectral features in the optical spectrum, and the fact that the He II 4686 Å nebular emission is centered on this star. Another bright star some 8 arcsec south of Star 2, Star 1 in Stasińska, Testor, & Heydari-Malayeri (1986), with magnitude V = 13.8 and color B-V = 1.06 (Stasińska, Testor, & Heydari-Malayeri, 1986), shows strong features of Ca I 4227 Å, the G-band of CH, and the Mg I b lines in our CTIO spectrogram. These features clearly indicate that Star 1 is a late-type star, most likely a foreground G or K star.
Our purpose in obtaining the GHRS spectrogram was to determine an accurate spectral type for Star 2 and to look for spectral peculiarities. Spectral typing of O stars embedded in bright nebulosity is sensitive to the subtraction of the strong, spatially variable H and He recombination lines from the nebula, and this is true for N44C. In contrast, the UV spectrum of O stars includes a number of spectral features which are sensitive to spectral type and luminosity (Walborn, Nichols-Bohlin, & Panek, 1985; Walborn et al., 1995), while nebular emission is largely absent in the UV. For example, the N V 1240 Å, N IV 1718 Å, and O V 1371 Å features provide some discrimination between early- and late-type O stars, while the Si IV 1400 Å feature strongly discriminates between supergiants and dwarfs, developing a distinctive P Cyg wind profile in O supergiants of type O4 and later.
Our GHRS spectrogram displayed in Figure 2 shows features typically found in O stars, the most prominent of which include N V 1238,42, C IV 1548-50, Si IV 1398, 1420, N IV 1718, He II 1640, and O IV 1339,44. The N V feature exhibits an unsaturated P Cygni profile characteristic of a strong stellar wind, but except for a possible weak C IV feature, no other stellar feature has a P Cyg profile at the limits of the signal/noise of the spectrogram.
The spectrum also shows a number of strong, narrow interstellar absorption features. The most prominent is the saturated Ly line (with the geocoronal Ly emission in the core; note also that the Ly absorption goes to zero, indicating that scattered light is absent). The centroid of the absorption line is offset from the geocoronal emission by about 250 km s-1, evidence that the bulk of the absorbing neutral hydrogen lies within the LMC. Other prominent interstellar features include the S II/C I blend at 1260 Å, O I + Si II near 1304 Å, C II 1335 Å, Si II 1526 Å, and Al II 1670 Å. Most of these lines show double profiles separated by approximately 230 km s-1. The low velocity component likely arises from foreground gas in the Galaxy, while the higher velocity component arises from gas in the LMC.
Gabler et al. (1992) proposed that extreme O supergiants with 50,000 K close to the Eddington limit could produce sufficient numbers of He+-ionizing photons to account for nebular He II emission in some cases. On the other hand, nebular He II recombination emission has not been seen associated with Population I O3 stars in either the Galaxy or the Magellanic Clouds. Our GHRS spectrogram shows clearly that Star 2 is not an early O supergiant. Such stars in the Galaxy and the Magellanic Clouds display saturated P Cygni profiles for C IV 1550 Å and N V 1550 Å, as well as P Cyg profiles for He II 1640 Å and N IV 1718 Å. Supergiants of type O4 and later also show P Cyg profiles for Si IV 1400 Å. Except for N V, none of these lines shows a prominent P Cyg profile in the spectrum of Star 2. In addition, neither our low-resolution optical spectrum nor a high-dispersion echelle spectrum (kindly provided by K. Venn and D. Lennon) for Star 2 show the N IV 4058 Å feature nor the N V 4604, 4620 Å lines observed in O3-O4 supergiants.
At the same time, the UV spectrum shows some evidence for peculiarities that confuse the spectral classification. Comparing with the O5 V star Sk–70 69 and the O9 III star AV 238 (Figure 2), we see that while N V 1240 Å has a strength consistent with the earlier spectral type, the C IV feature has a strength more similar to the later spectral type. The actual strength of the C IV profile is difficult to determine because of the likely presence of superposed C IV interstellar absorption from both the Galaxy and the LMC. However, the stellar C IV feature is noticeably weaker than observed in other O7 V stars (Walborn, Nichols-Bohlin, & Panek, 1985; Walborn et al., 1995)). The strength of N V and the weakness of C IV suggest the possibility that Star 2 is an ON-type star (Walborn & Panek, 1985). Enhanced N and deficient C in the star would indicate that it is moderately evolved. A more detailed analysis is needed to determine if there are actual abundance anomalies in the star. Nevertheless, it is clear that Star 2 is an unlikely source for the photons capable of producing the nebular He II emission. On the basis of the UV spectrum, we estimate the spectral type of Star 2 to be approximately O7 III-V, consistent with that derived by Oey & Massey (1995) from the optical spectrum.
4 Features from Narrow-Band WFPC2 Imaging
The composite WFPC2 image of the N44C region (Figure 5) shows three main features: (1) the high surface brightness, high-excitation ([O III] 5007/H 6) main body of N44C, which is mostly contained in chip WF2 (upper left); (2) diffuse, high-excitation filamentary emission to the SW of N44C; and (3) low-excitation diffuse and dusty gas, seen mostly as H emission to the N and W of the bright H II region.
The bright main body of N44C has the appearance of a normal H II region, apart from its high excitation and He II emission. The E, NE, and NW boundaries of N44C are relatively sharp and have low [O III]/H, indicating the presence of an ionization front. We infer that the nebula is bounded by a molecular cloud on these three sides. The low-excitation H emission to the N of the nebula, separated by a dust lane from N44C, is part of the superbubble surrounding the association LH 47.
The WFPC2 images shows Star 2 to be single to the limits of the WFPC2 resolution, about 5000 AU at a distance of 50 kpc. This is consistent with the normal appearance of the spectrum of Star 2. Any companion must be much fainter than the O star, unless it is of the same spectral type.
A large region of diffuse filamentary gas is seen to the SW of N44C. These filaments appear to outline a roughly spherical cavity, and have [O III]/H comparable to what is seen in N44C. The streamers running south from N44C may be part of this structure. It is clear that these streamers are foreground to N44C since they can be seen in dust absorption against the bright western part of the nebula. We therefore infer that the diffuse filamentary structure is physically unrelated to N44C. The structure may be a wind-blown bubble associated with the Wolf-Rayet star Br 25, which can be seen at the bottom of the PC frame in Figure 5. Such bubbles are known to have high-excitation shells (e.g., NGC 2359; Dufour (1989)).
Perhaps more intriguing is the series of east-west oriented arcs located approximately 40-50 south of Star 2. The arcs are concave towards N44C, giving the impression of an expansion in that direction, possibly associated with a stellar outburst. Our echelle spectrogram slit (discussed below) did not cross the arcs. However, the slit used by Goudis & Meaburn (1984) in their kinematic study did cross a part of these arcs. As discussed below, they saw little evidence for high-velocity gas in N44C, apart from the feature we now know to be He II 6560 Å. In the absence of stronger kinematic evidence, we speculate that the brightest arc represents an edge-on ionization front, isolated from the main nebula by a superposed dust lane and/or a shadow region.
The PC frame shows a region of dusty material. This region is most likely associated with the star-forming complex N44B, which is located just outside the image to the NW (upper right). This region shows extensive dust structures and also extensive nebular emission for which the ionizing sources are not obvious. Infrared imaging of this region could reveal evidence of significant star formation activity.
5 The Nebular Spectrum and Element Abundances
We measured the emission-line features in each spectrogram using the SPLOT routine in IRAF111IRAF is distributed by the National Optical Astronomy Observatories, which are operated by the Association of Universities for Research in Astronomy, Inc., under cooperative agreement with the National Science Foundation.. Line strengths relative to H were measured by integrating the fluxes under the emission-line profiles. The hydrogen Balmer emission line strengths in the CTIO spectrogram were corrected for stellar absorption by the ionizing star using an approximate spectral type of O7, based on the initial inspection of the HST GHRS stellar spectrogram. This corresponds to an absorption equivalent width of 2.8 Å for the H line. Certain features, such as [Ar IV] 4711 Å + He I 4713 Å, are strongly blended. In such cases, we determined the relative fluxes for the individual lines by using the appropriate theoretical ratios for hydrogen and helium from Hummer & Storey (1987). The measured fluxes for strong lines in the overlap region of the red and blue CTIO spectra agreed to within 5%, so we averaged the measurements in the overlap region. Upper limits for some undetected lines were determined from the rms noise in the local continuum.
5.1 Reddening Corrections
Assuming an intrinsic H/H ratio equal to 2.86 for = 10,000 K and = 100 cm-3, close to the derived physical conditions for N44C (see below), we estimate that the interstellar reddening toward N44C corresponds to = 0.250.05 magnitude, using a standard Galactic extinction curve (Cardelli, Clayton, & Mathis, 1989) with = 3.1. This is roughly consistent with the foreground extinction toward the LMC of = 0.28 magnitude, based on the extinction maps of Burstein & Heiles (1984). The fact that we derive slightly smaller reddening may be attributed to uncertainties in the reddening measurement, and to patchiness in the foreground extinction which is not resolved by the large beam of the Burstein & Heiles maps.
Correcting the FOS emission line measurements for interstellar reddening is less straightforward, as the UV reddening function can vary dramatically with environment (Cardelli, Clayton, & Mathis, 1989). Even within the LMC there is no ‘standard’ UV reddening curve, as demonstrated by Fitzpatrick (1986), who showed that the UV reddening curve differs for stars inside and outside the 30 Doradus region. Our FOS spectrogram has a number of He II and He I recombination lines (in particular the bright He II 1640 Å line) in the UV and visible spectral regions, which we could use to constrain the UV reddening curve. We compared the theoretical ratios for He II lines with respect to He II 4686 Å and He I lines with respect to 4471 Å, along with the hydrogen Balmer decrement, with reddening-corrected ratios based on the LMC reddening curves derived by Fitzpatrick (1986) and the standard Galactic reddening curve with = 3.1 from Cardelli, Clayton, & Mathis (1989). We found empirically that the average interstellar reddening curve for regions within 0.5 degrees of 30 Dor derived by Fitzpatrick (1986), with = 0.260.05 mag, provided the best match to the relative strengths of the He II, He I, and H I lines.
The reddening-corrected line fluxes for the CTIO spectrogram are listed in Table 2, while those for the FOS spectrogram can be found in Table 3. The tabulated fluxes are normalized to the H flux in both tables. The tabulated uncertainties in the line fluxes were evaluated from the rms noise in the continuum near each emission line, combined with the uncertainty in the relative photometric calibration across the spectrum (estimated to be approximately 3% based on standard stars) and the uncertainty in the reddening correction.
5.2 Physical Conditions
It is necessary to determine the electron temperature and electron density in the ionized gas in order to derive ionic abundances from the emission-line spectrum. A number of diagnostic emission line ratios are measureable in our spectra (Table 3). We used an updated version of the Lick Observatory five-level atom program FIVELEV (DeRobertis, Dufour, & Hunt, 1987) to derive the physical conditions from the diagnostic line ratios. The various diagnostic emission-line ratios and physical conditions derived from the line ratios are listed in Table 5.
The [S II] line ratio integrated over the CTIO spectrogram corresponds to in the low-density limit. However, the [Ar IV] line ratio in the CTIO spectrogram and the [S II] and [Ar IV] ratios in the FOS spectrogram yield a higher density of approximately 2000 cm-3 in the high surface brightness region within 3 of the ionizing star. Thus, the bulk of the nebula, as sampled by the larger CTIO slit, appears to consist of moderately low-density material, with the central He II-emitting region sampled by the FOS aperture being the illuminated face of a molecular cloud in close vicinity to the ionizing star, similar to what is observed in the Orion Nebula (Baldwin et al., 1991). The higher density in this central region is still too low to have a significant effect on the abundances derived for the nebula.
The various results for from [O III] line ratios in Table 3 agree to within measurement errors. A weighted mean of the three measurements yields = 11,200 200 K. We adopt this value for the ion abundance calculations to follow. A plot of the 5007 Å/4363 Å ratio along the CTIO slit shows little variation other than noise, suggesting that the nebula is largely isothermal. The values of derived from the [S II] 4069 Å/6725 Å and [O II] 2470 Å/3727 Å ratios are somewhat smaller, approximately 9000 K; the uncertainties are large, however, and the results are sensitive to the assumed electron density. The better measurement of [O II] 3727 Å/7325 Å yields a temperature much closer to the [O III] temperature. Although photoionization models (e.g., Garnett (1992)) predict that the electron temperature in the low-ionization zone (including O+, N+, and S+) should be about 400 K cooler, we will treat the nebula as isothermal here. Only a small error in the abundances derived here will be introduced by such an assumption, since the nebula is highly ionized. As is shown in the next section, the ionic abundances determined from the CTIO spectra and the FOS spectra are in good agreement with each other, indicating that the isothermal assumption does not lead to very large errors. We adopt = 11,200 K and = 150 cm-3 for the CTIO observations, and = 11,200 K, = 1500 cm-3 for the FOS observations.
5.3 Ionic Abundances
We calculated ionic abundances relative to H+ from each spectrum separately using the five-level atom code, adopting the and values listed in the previous section. In general, the brightest or least density-sensitive measurable emission lines of each ion were used to determine the ionic abundances. The abundances for all ions observed in both spectra are listed in Table 3.
The He+ and He+2 abundances were determined using the theoretical emissivities from Benjamin, Skillman, & Smits (1999), including the contributions for collisional excitation of He I. We used 1500 cm-3 and = 11,200 K to derive He+ from the FOS spectrogram; at this electron density, the collisional contribution is at most 15%, for the 5876 Å line, and less for the other He I lines. For the CTIO observation, we used = 150 cm-3 to compute the He+ abundance; at the higher density used for the FOS measurements, we obtained larger differences between the He+ abundances derived from the 5876 Å, 4471 Å, and 6678 Å lines than when we use the lower density. The He+ abundance from the CTIO data is a weighted mean of the values from the 4026, 4471, 5876, and 6678 Å lines; for the FOS data, we used the weighted mean values from the 2945, 3188, 4471, 5876, and 6678 Å lines. For He+2, we used the 4686 Å line only.
The ionic abundances determined from the two spectral datasets are in relatively good agreement, apart from differences that can be attributed to variations in ionization. The small He II-bright region observed within the FOS aperture exhibits higher ionization than the larger region encompassed by the CTIO slit, as reflected by the larger derived abundances for He+2 and Ar+3 and the lower abundances for O+, N+, and S+ from the FOS spectrogram. The O+2 and Ne+2 abundances are roughly the same between the two spectra, but these two species would be expected to be partially replaced by O+3 and Ne+3 in the He+2 zone, so little variation would be expected.
5.4 Total Abundances
5.4.1 Nebular Parameters and Ionization Models
The total abundances for each element can be determined, in principle, by summing the contributions from each ionization state. For many of the elements we study here, however, some important ionization states are not observed, or have poorly determined limits. To estimate corrections for unseen ionization states, we have computed photoionization models using the code Cloudy version 90.04 (Ferland, 1996).
First, we establish a few stellar and nebular properties. We estimated the total H- and He+-ionizing photon fluxes by determining the H and He II 4686 Å fluxes from our CTIO images. We measured the counts in the H and He II 4686 Å images (with stars subtracted) within a 2 strip centered on Star 2, corresponding to the slit used for the CTIO spectra. The H and 4686 Å fluxes measured in our CTIO spectrogram were used to determine the conversion from counts to flux in the images. We then measured total line fluxes for H and He II in the region encompassing the nebula from the images. The measured fluxes were F(H) = (3.00.6)10-10 erg cm-2 s-1 and F(4686) = 7.310-13 erg cm-2 s-1, after correcting for obscuration = 0.25 mag, corresponding to emission-line luminosities L(H) 91037 erg s-1 and L(4686) 2.21035 erg s-1 at a distance of 50 kpc. For case B recombination, the derived H-ionizing photon luminosity is Q(H0) = 1.91050 s-1 and Q(He+) = 2.31047 s-1.
The values for L(4686)/L(H) and Q(He+)/Q(H0) derived here for N44C are a factor of six smaller than those derived earlier by Garnett et al. (1991) from published measurements. There are several possible reasons for this discrepancy. First, the line fluxes in Garnett et al. (1991) were derived from the average surface brightnesses obtained from the small-aperture spectra of Stasińska, Testor, & Heydari-Malayeri (1986), multiplied by the estimated nebular area. These fluxes may have significant uncertainties due to the large geometric correction and the uncertainty in the average surface brightness. Second, the He II flux derived from our CTIO image may have a large uncertainty arising from the subtraction of the bright stars in the nebula. We estimate that our value for the He II line flux may be uncertain by 50%. Third, it is possible that the He II flux may have experienced a significant decline between the 1986 observations and our 1991 observations (see discussion below).
Following the example of Ferland (1998) for the Orion Nebula, we can estimate the distance from Star 2 to the ionization front for our FOS position from the nebular surface brightness and the derived Q(H0). We assume that the bulk of the H emission within the FOS aperture arises from the surface of a molecular cloud on the far side of the star from us (see section 5). The H surface brightness within the FOS aperture is 4.010-14 erg cm-2 s-1 arcsec-2. If the nebula emits isotropically, this corresponds to 4J 0.02 erg cm-2 s-1 at the surface, or about 5.2109 H photons cm-2 s-1. In case B recombination, approximately one out of every nine recombinations produces an H photon, so the recombination rate at the surface is approximately 4.51010 cm-2 s-1. For an ionization-bounded nebula, the ionizing photon surface flux must be at least equal to the surface recombination rates. Thus, for our derived Q(H0), the separation between Star 2 and the ionized surface layer is about 1.81019 cm. In reality, photons reflected by the molecular cloud will contribute a small amount to the H flux, and grains will compete with H atoms for ionizing photons, which will lead to a somewhat smaller derived separation. For the purposes of our analysis, we will assume a star-gas separation of 1019 cm.
Ionizing stellar fluxes for the photoionization calculations were taken from the NLTE stellar atmosphere models of Husfeld et al. (1984). Other more recently computed atmosphere flux models are available, but as we shall see below the corrections for unseen ionization states are small for most of the elements we observe, and the uncertainty in the ionizing radiation field is not critical to our estimates of element abundances in the case of N44C. We used average LMC element abundances from Garnett (2000) and Dufour (1990), with refractory elements depleted by a factor of ten. Orion-type grains were included with an abundance of 0.25 times the Milky Way value. Model runs were computed for = 50,000, 75,000, and 85,000 K stellar atmospheres, and for ionization parameters log U = 2.5, 3.0, and 3.5. Estimated total abundances for the elements observed in N44C are listed in Table 6. We discuss individual elements in detail below.
5.4.2 Helium
Computing the total helium abundance is trivial in principle, being the simple sum of the He+ and He+2 abundances. Simple photoionization models predict negligible neutral helium in the H+ zone for stars at least as hot as O7.
Table 8 shows that He/H derived from the CTIO and FOS spectra disagree, with a 2.5 difference between the two values. This is unlikely to be due to unaccounted observational errors. One possible explanation is that the adopted electron density for the FOS observation may be too large. The He+ abundance is sensitive to the correction for collisional excitation. Lowering the electron density would result in a higher He+ abundance. Nevertheless, we can conclude that there is no evidence for He enrichment in N44C; the CTIO value is in good agreement with the average LMC He/H listed in Dufour (1990).
5.4.3 Oxygen
Most of the oxygen in H II regions is in the form O+ and O+2. However, in regions where He+2 is present O+3 is expected as well. Our photoionization models indicate that the O+3 fraction is tightly correlated with He+2/He+, and depends only weakly on the ionization parameter. The predicted corrections to the oxygen abundance are 2% and 14% for the CTIO and FOS spectra, respectively. These results are consistent with the corrections derived by the scheme listed in Kingsburgh & Barlow (1994) based on planetary nebula models (4% and 19% respectively). The values of O/H from the two spectra after these corrections agree to within 3%. The mean value, O/H = 2.110-4, is consistent with the average O/H for LMC H II regions (Garnett, 2000; Dufour, 1990).
5.4.4 Carbon
Our 2 upper limit on the C IV emission leads to a significant upper limit on the C+3 fraction, less than 25% of the total C/H obtained from the FOS observations. This is consistent with our photoionization models, which predict that C+3/C+2 0.1-0.2 for the observed He+2 fraction. C+4 contributes negligibly. We therefore adopt C/H = (71)10-5 for N44C. This value is within 6% of the value derived for 30 Doradus by Garnett et al. (1995). We thus find no evidence that carbon is enriched in N44C.
5.4.5 Nitrogen
The nitrogen abundance has the largest potential uncertainties, because only one ionization state, N+, is observed directly. The large O+2/O+ ratio in N44C tells us that N+ is only a minor fraction of the nitrogen abundance, and so a large ionization correction will be incurred.
The analysis by Garnett (1990) suggested that, for metal-poor H II regions ionized by stars hotter than 40,000 K, the N+/O+ ratio was a good approximation for N/O, to within 20% accuracy. The ionization models computed here confirm those results. We find from the models that (1) the ratio N+/O+ varies between 1.0 and 1.15 times N/O, with no systematic variation with O+2/O+; and (2) the ratio (N+3 + N+2)/N+ = O+2/O+ to within a few percent over the entire range of ionization parameter and considered here. Our 2 upper limit on N+2/H+ from the FOS spectrum is consistent with these results, but is too large to provide a useful constraint. Using these theoretical relations yields N/O = 0.05 for the CTIO specturm and N/O = 0.08 for the FOS spectrum. For the rest of our discussion we adopt the mean of the two results, log N/O = 1.20.1, noting the potentially large uncertainty in the ionization correction. This value is 0.3 dex larger than the mean value for LMC H II regions (Garnett, 2000). Thus there is some evidence for an nitrogen enrichment in N44C.
5.4.6 Sulfur, Neon, and Argon
The neon abundance can be derived straightforwardly from the sum of Ne+2 and Ne+3 from the FOS spectrum, while the Ar abundance is the sum of Ar+2 and Ar+3 in the CTIO spectrum. The low upper limits on Ne+4 and Ar+4 indicate that these species contribute negligibly, and the ionization models concur that these two species are less than 2% of the total Ne and Ar abundances. The contributions from Ne+ and Ar+ are predicted to be less than 10% of the total by the ionization models.
The total Ar/H abundance for N44C is within the range observed for ionized nebulae in the LMC and in other galaxies (Garnett, 2000). The value log Ar/O = –2.3 in N44C is also close to the mean value for the LMC. On the other hand, Ne/O is about 0.2 dex higher than the mean for LMC H II regions. We are puzzled as to the source of the high Ne. We obtain a high Ne abundance even if we consider only Ne+2. One possible solution is if in the regions where Ne+2 and Ne+3 are produced is approximately 13,000 K, instead of the 11,400 K used here. This might be expected for such high-ionization species. On the other hand, for Ne+2 is expected to be similar to that for O+2 (Garnett, 1992), and one might also expect to measure a higher in the FOS data than in the CTIO data, which is not observed. A higher in the high-ionization zone would also lead to a significant reduction in the Ar abundance, leading to a discrepancy with the mean LMC abundance for that element. A measurement of the high-excitation [Ne IV] lines would provide a constraint on for the higher ionization states.
We detect S+ and S+2 in both our spectra. For a hot ionizing star, significant amounts of S+3 and S+4 may also be present. Our photoionization models predict that these two species should have abundances of 0.20.1 times the S+2 abundance in the CTIO data and 0.350.1 times the S+2 abundance in the FOS data. The resulting total S abundance for the two sets of observations are in excellent agreement. Our derived values log S/H = –5.40.1 and log S/O = –1.70.1 are consistent with the mean value for LMC H II regions.
6 Echelle Spectrum
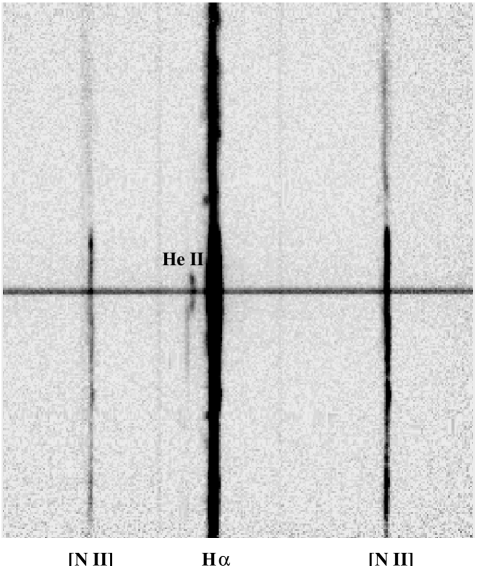
A long-slit echelle observation of the H + [N II] lines was made with the 4m telescope at Cerro Tololo Inter-American Observatory on 7 January 1988. The observing configuration of the spectrograph has been described by Chu & Kennicutt (1994). Thorium-Argon lamp scans were used for wavelength calibration and distortion correction; however, the geocoronal H component at zero observed velocity was used to fine-tune the velocity calibration. N44C was observed with a slit width of 250 m (164). The resulting instrumental FWHM of the H line was 181 km s-1. The slit was oriented E-W and passed through Star 2, extending from 175 arcsec east of Star 2 to 90 arcsec west of the star. Figure 6 displays a portion of the two-dimensional echelle spectrogram. The three most prominent lines are [N II] 6548, H, and [N II] 6583 from left to right. The spectrum of Star 2 is the continuous horizontal band. Three weak night-sky features are also seen extending along the entire slit. The H and [N II] lines show little velocity structure beyond turbulent motions in the ionized gas.
Immediately to the left of the H line is the He II 6560 Å line. This feature may have been identified by Goudis & Meaburn (1984) as a possible signature of high-velocity gas prior to the discovery of the nebular He II emission. The He II emission extends only about 14 arcsec (20 pixels) along the slit. Closer inspection of the 6560 Å line reveals that the feature is curved: at positions close to the star the He II line is redshifted by about 10 km s-1 with respect to the end positions of the feature. This velocity structure is not observed in either H nor [N II].
We can compare our measured H and He II velocities with the CO measurements of Chin et al. (1997). From our echellogram of N44C, we measure the wavelength of the geocoronal H was 6562.58 Å; the observed H wavelength of N44C was 6569.17 A; and the observed He II wavelength of N44C was 6566.54 A, averaged over the 20 pixels containing the bright He II emission. Correcting for earth and solar motions, we find that V(helio) = 300 km s-1 and V(LSR) = 284 km s-1 for H in N44C, V(LSR) = 289 km s-1 for the He II line, with uncertainties of 2 km s-1 in the velocities. Chin et al. (1997) measured the CO emission at two positions in N44; the measurement at 05h 22m 24.8s, 68∘ 01′ 12′′ is closest to Star 2, 11′′ NE of the star. At this position, the CO velocity is V(LSR) = 281.4 km s-1. Thus, the the H velocity of N44C, 284 km/s, is very similar to the CO velocity, while the He II emission appears to be redshifted with respect to the molecular cloud. We speculate that the He II emission represents material that is being accelerated by the wind of the O star; the redshift of the gas would then indicate that the He II emission arises primarily from gas behind the O star. We also infer from this that the densest gas in the nebula, associated with the face of the molecular cloud, is behind the star, similar to the Orion Nebula.
7 X-ray Imaging
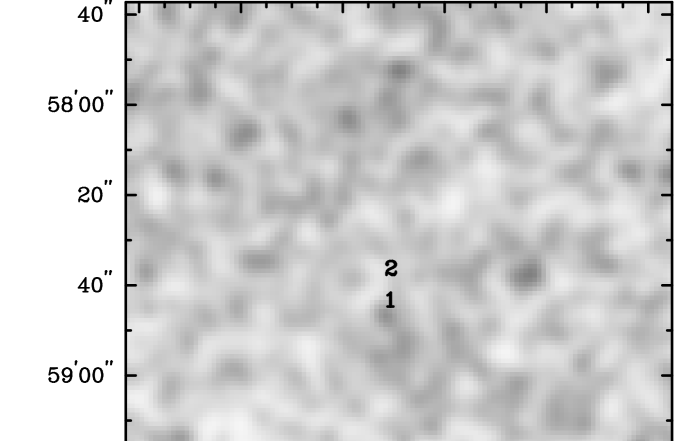
A deep, 108 ks exposure of the N44 complex was obtained in November 1997 with the High Resolution Imager (HRI) on board the ROSAT satellite. The HRI is sensitive to the energy range 0.1-2.0 keV; it has a 3838′ field of view and an on-axis angular resolution of . These observations were obtained to study the diffuse X-ray emission from the N44 supershell, but can also be used to constrain the luminosity of any point source in N44C. Figure 7 shows a portion of the HRI image centered on N44C; positions 1 and 2 on the image mark the G star and the O star respectively. The image has been smoothed with a Gaussian having = 2.
Figure 7 shows that there are no significant X-ray point sources in N44C. A weak emission peak is seen approximately 3 SE of the G star. This peak could be associated with the G star; the aspect solution of ROSAT is accurate to about 5, and Galactic G stars can be X-ray sources. Unfortunately, no bright point sources exist in the field for astrometric calibration.
We estimated a limit on the X-ray flux from a point source at the position of the O star (Star 2) from this smoothed image. We used a 5-radius aperture to account for the HRI PSF and the nominal positional uncertainty, and two different regions for background. Neither the O star nor the G star could be considered detected based on this analysis. For Star 2, the 3 limit for the count rate is 1.5x10⁻⁴ counts s-1 in the HRI bandpass.
To convert this count rate to a limit on the X-ray luminosity LX, we must make a few assumptions and corrections. First, we assume that the X-ray emission can be approximated by a Raymond & Smith (1977) thin plasma model with a temperature 106 K. We then use the conversion from counts to energy given in the ROSAT Mission Description for a given temperature, assuming that the PSPC count rate is three times that of the HRI. Assuming a distance of 50 kpc to the LMC and a count rate of 4.5x10⁻⁴ counts s-1 in the PSPC, our computed 3 upper limits on LX are given in Table 7 as a function of temperature and X-ray absorption N(H).
We must now estimate the opacity to X-ray emission along the line of sight. This is typically expressed as a column density of H atoms along the line of sight (N(H)). Note that in X-ray absorption models N(H) is the X-ray absorption expressed in the units per H atom using opacities from Morrison & McCammon (1983). This absorption column density is not equal to the H I column density because the absorption column density includes the ionized and molecular H as well. However, the H I column density includes all H I along the line of sight, while the absorption column density includes only the material between the object and us, so the H I column density is commonly used to approximate the absorption column density. We will use this approximation as well. The H I map of the N44C complex from Kim et al. (1998) indicates that the H I column density toward N44C is only 1021 cm-2. The analysis of ASCA data for N44 by Magnier et al. (1996) indicates a similar value for N(H). Finally, we note that the low interstellar obscuration suggests a relatively small column of absorbing material in front of the nebula. Therefore, we are justified in assuming a absorption column density log N(H) = 21.0 - 21.5 cm-2.
Based on parameters adopted above and the results in Table 7, we infer that the 3 upper limit on LX for any currently active point source with T 106 K in N44C is 1034 ergs s-1 in the ROSAT 0.1-2.0 keV band. This limit may be somewhat conservative because the assumed absorption column density is relatively high. Note that a softer source could have a significantly larger luminosity and remain undetected. On the other hand, our limit is an order of magnitude smaller than that inferred by Pakull & Motch (1989), and is four orders of magnitude smaller than the luminosity of LMC X-1, which powers an X-ray ionized nebula (Pakull & Angebault, 1986).
8 Discussion
Our analysis of N44C still leaves us with a puzzle: where is the evidence for the source of the He+-ionizing photons that power the He II zone? Garnett et al. (1991) outlined several possible mechanisms which could account for the He II emission. The data presented here rule out virtually all of the proposed mechanisms. Our GHRS spectrogram of Star 2 shows it to be consistent with a main sequence dwarf star, and thus it is incapable of ionizing the He II zone according to state-of-the-art stellar atmosphere models. Except for, possibly, nitrogen, the nebular abundances are consistent with average LMC values. Evidence for a previous evolved companion star is thus largely absent. We see no evidence for high-velocity H anywhere in N44C, ruling out the possibility that a shock front produces the He II emission.
The one possibility that remains open is the hypothesis by Pakull & Motch (1989) that N44C is a fossil X-ray-ionized nebula. They conjectured that N44C once contained an X-ray binary similar to LMC X-1 in which the X-ray emission had switched off some time within the recent past. Noting the presence of He II emission and the absence of [Ne V] emission, they computed the recombination time scales for both species and estimated that the putative X-ray source would have had to shut off between 20 and 100 years prior to 1986.
These estimates by Pakull & Motch were obtained assuming an electron density of 200 cm-3. However, we know from the present data that 1000-2000 cm-3 in the He II-emitting region of the nebula. At this density the recombination time-scales for He+2 and Ne+4 are approximately 20 and 5 years, respectively. Given that our CTIO spectrogram was obtained in 1991, this implies that the putative X-ray source shut down sometime between 1970 and 1978 (when the observatory surveyed X-ray sources in the LMC). This is a very narrow window for the shut-off to occur. There is a further problem: the presence of considerable amounts of Ne+3, which requires 63 eV photons to exist. The [Ne IV] 2420 Å line is strong and well-measured, as seen in Figure 3, so observational uncertainties are small. If the collision strength for this transition is greatly underestimated we would overestimate the Ne+3 abundance, but the abundance would still be significant if overestimated by a factor of ten. The radiative recombination coefficient for Ne+3, 9.810-12 cm3 s-1 at T = 10,000 K (Gould, 1978), is even larger than that for Ne+4, and we derive a recombination timescale of only about 3 yrs for Ne+3. This analysis neglects dielectronic recombination, which has a much larger cross section than radiative recombination for Ne+3 and Ne+4 at nebular temperatures (Nussbaumer & Storey, 1987). Thus, if the lack of [Ne V] emission is due to rapid recombination in a fossil X-ray-ionized nebula, we should not expect to see [Ne IV] emission either. What keeps the Ne+3 ionized?
Nevertheless, as we noted earlier, the inferred L(4686) in our 1991 observations is much smaller than that inferred from the 1986 observations. This suggests that we are observing the recombination of He+2 with time. In addition, the inferred Q(H0) for Star 2 from our data is much higher than that expected from an O7V star, suggesting that there may have been an additional source of ionizing photons. Further spectral monitoring of N44C is warranted to confirm if the nebula is evolving as expected under the fossil nebula hypothesis.
Markert & Clark (1975) reported the detection by -7 of a source, LMC X-5, near the position of N44C, but the positional error circle (0.3 degree) was so large that a definitive identification can not be established. This source was detected significantly (4 level) only in the 3-10 keV band. Griffiths & Seward (1977) claimed to have confirmed this detection with the observatory, but the positional uncertainty is much larger. The candidate LMC X-5 was not detected by Long, Helfand, & Grabelsky (1981) in their observatory survey of the LMC; they placed an upper limit of 21035 ergs s-1 for the 0.15-4.5 keV luminosity of the source. No source was detected in our ROSAT HRI observation in 1997, nor in a shorter pointed HRI observation in 1993. Pakull & Motch noted that there are some cases of “permanent” X-ray binaries for which the X-ray emission subsides for periods of several years (Jones, Forman, & Liller, 1973; Pietsch et al., 1986), although these cases are low-mass X-ray binaries, not massive stars such as the case here. In the low-mass X-ray binaries, the mechanism for X-ray turn-off is proposed to be pulsations in the secondary star which cause the secondary to alternately fill and underfill its Roche lobe, leading to periodic X-ray activity. This phenomenon is less likely to occur in an O-type star. Another possibility is that an unseen compact companion may be in a highly eccentric orbit about Star 2. Such a companion could trigger activity through accretion of material from the O star as the companion approaches periastron; X-ray activity would then shut off as the companion moves outward on its orbit. A configuration such as this would have to be young enough that tidal forces have not significantly circularized the orbits. An interesting possibility is that the system is related to the Be X-ray binaries (Rappaport & van den Heuvel, 1982), although Star 2 itself does not currently show evidence of Be activity. X-ray and optical spectral monitoring, and a radial velocity study, are needed to constrain the models for this system.
9 Summary
We have presented new CTIO and HST spectroscopy of the He II-emitting nebula LMC-N44C, a low-resolution UV spectrogram of its ionizing star, new nebular kinematic data, and deep high-resolution X-ray imaging of the nebula. We summarize our analysis here:
(1) The GHRS spectrogram of the ionizing star (Star 2) yields a spectral type of about O7 for the star. The Si IV, He II, and C IV features do not show P Cygni profiles, showing definitively that the star is not a supergiant. No other stellar source is visible within 5000 AU of the O7 star in WFPC2 images, nor is any close companion evident in the spectrum of the star.
(2) The abundances of He, C, O, S, Ar, and Ne in the ionized gas are all consistent with average abundances for LMC H II regions. Nitrogen may show an enhancement by about a factor of two, although the correction for unseen ionization states is large and uncertain. There is thus little evidence for enrichment by a previous evolved companion.
(3) A long-slit echelle spectrogram in H + [N II] shows no signs of high-velocity gas ( 100 km s-1) in N44C. Thus, high-velocity shocks do not account for the nebular He II emission.
(4) No X-ray point source is seen in a 108 ks ROSAT HRI image of N44C. We set an upper limit of 1034 erg s-1 for the 0.1-2.0 keV luminosity of any point source in the nebula.
(5) Based on new measurements of the electron density in the He II emitting region, we derive recombination timescales of 20 yrs for He+2 and 4 yrs for Ne+4, about a factor of five smaller than the values derived by Pakull & Motch (1989). This places severe constraints on the time window within which a putative X-ray source could have turned off. An additional puzzle is why [Ne IV] emission is still observed in the nebula if the ionizing source has shut off.
(6) X-ray monitoring and optical spectral monitoring of the nebula, and a radial velocity study of the ionizing star, are needed to fully understand the source of the hard ionizing photons that produced the He II and [Ne IV] emission in N44C.
References
- Baldwin et al. (1991) Baldwin, J. A., Ferland, G. J., Martin, P. G., Corbin, M. R., Cota, S. A., Peterson, B. M., & Slettebak, A. 1991, ApJ, 374, 580
- Benjamin, Skillman, & Smits (1999) Benjamin, R. A., Skillman, E. D., & Smits, D. P. 1999, ApJ, 514, 307
- Burstein & Heiles (1984) Burstein, D. & Heiles, C. 1984, ApJ Suppl., 54, 33
- Campbell, Terlevich, & Melnick (1986) Campbell, A., Terlevich, R., & Melnick, J. 1986, MNRAS, 223, 811
- Cardelli, Clayton, & Mathis (1989) Cardelli, J. A., Clayton, G. C., and Mathis, J. S. 1989, ApJ, 345, 245
- Chin et al. (1997) Chin, Y.-N., Henkel, C., Whiteoak, J. B., Millar, T. J., Hunt, M. R., & Lemme, C. 1997, å, 317, 548
- Chu & Kennicutt (1994) Chu, Y.-H., & Kennicutt, R. C., Jr. 1994, ApJ, 425, 720
- DeRobertis, Dufour, & Hunt (1987) DeRobertis, M. M., Dufour, R. J., Hunt, R. W. 1987, RASC, 81, 195
- Dopita et al. (1990) Dopita, M.A., Lozinskaya, T., MacGregor, P.J., & Rawlings, S.J., 1990, ApJ, 351, 563
- Dufour (1989) Dufour, R. J. 1989, RMxAA, 18, 87
- Dufour (1990) Dufour, R. J. 1990, in Evolution in Astrophysics: IUE Astronomy in the Era of New Space Missions (ESA SP-310), p. 117
- Ferland (1996) Ferland, G. J. 1996, Hazy, a Brief Introduction to Cloudy, University of Kentucky Department of Physics and Astronomy Internal Report
- Ferland (1998) Ferland, G. J. 1998, in Ringberg Conference on the Orion Nebula, astro-ph/9808107
- Fitzpatrick (1986) Fitzpatrick, E. L. 1986, AJ, 92, 1068
- Gabler et al. (1992) Gabler, R., Gabler, A., Kudritzki, R.-P., & Mendez, R.H., 1992, A&A, 265, 656
- Garnett (1990) Garnett, D. R., 1990, ApJ, 363, 142
- Garnett (1992) Garnett, D. R. 1992, AJ, 103, 1330
- Garnett (2000) Garnett, D. R. 2000, in IAU Symposium 190, New Views of the Magellanic Clouds, eds. Y.-H. Chu, N. B. Suntzeff, J. E. Hesser, and D. A. Bohlender, (San Francisco: ASP), p. 266
- Garnett et al. (1991) Garnett, D.R., Kennicutt, R.C., Chu, Y.-H., & Skillman, E.D., 1991, ApJ, 373, 458
- Garnett et al. (1995) Garnett, D. R., Skillman, E. D., Dufour, R. J., Peimbert, M., Torres-Peimbert, S., Terlevich, R., Terlevich, E., & Shields, G. A., 1995, ApJ, 443, 64
- Goudis & Meaburn (1984) Goudis, C. & Meaburn, J., 1984, A&A, 137, 152
- Gould (1978) Gould, R. J., 1978, ApJ, 219, 250
- Griffiths & Seward (1977) Griffiths, R. E., & Seward, F. D. 1977, MNRAS, 180, 75P
- Hamuy et al. (1992) Hamuy, M., Walker, A. R., Suntzeff, N. B., Gigoux, P., Heathcote, S. R., & Phillips, M. M., 1992, PASP, 104, 533
- Hummer & Storey (1987) Hummer, D. G., & Storey, P. J. S. 1987, MNRAS 224, 801
- Husfeld et al. (1984) Husfeld, D., Kudritzki, R.-P., Simon, K.P., & Clegg, R.E.S., 1984, A&A, 134, 139
- Jones, Forman, & Liller (1973) Jones, C. A., Forman, W., & Liller, W. 1973, ApJ, 182, L109
- Kim et al. (1998) Kim, S., Chu, Y.-H., Stavely-Smith, L., & Smith, R. C. 1998, ApJ, 503, 729
- Kingsburgh & Barlow (1994) Kingsburgh, R. L., & Barlow, M. J. 1994, MNRAS, 271, 257
- Kunth & Sargent (1983) Kunth, D., & Sargent, W. L. W. 1983, ApJ, 273, 81
- Long, Helfand, & Grabelsky (1981) Long, K. S., Helfand, D. J., & Grabelsky, D. A. 1981, ApJ, 248, 925
- Magnier et al. (1996) Magnier, E. A., Chu, Y.-H., Points, S. D., Hwang, U. & Smith, R. C. 1996, ApJ, 464, 829
- Markert & Clark (1975) Markert, T. H., & Clark, G. W. 1975, ApJ, 196, L55
- Melnick & Heydari-Malayeri (1991) Melnick, J., & Heydari-Malayeri, M. 1991, in IAU Symposium 143, Wolf-Rayet Stars and Interrelations with Other Massive Stars in Galaxies, eds. K. A. van der Hucht and B. Hidayat (Dordrecht: Kluwers), p. 409
- Morrison & McCammon (1983) Morrison, R., & McCammon, D. 1983, ApJ, 270, 119
- Nussbaumer & Storey (1987) Nussbaumer, H., & Storey, P. J. 1987, A&AS, 69, 123
- Oey & Massey (1995) Oey, M. S., & Massey, P., 1995, ApJ, 452, 210
- Pakull & Angebault (1986) Pakull, M. W., & Angebault, L.P., 1986, Nature, 322, 511
- Pakull & Motch (1989) Pakull, M. W., & Motch, C., 1989, Nature, 337, 337
- Pietsch et al. (1986) Pietsch, W., Steinle, H., Gottwald, M., & Graser, U. 1986, A&A, 157, 23
- Rappaport & van den Heuvel (1982) Rappaport, S., & van den Heuvel, E. P. J. 1982, in IAU Symposium 98, Be Stars, eds. M. Jaschek and C. Groth (Dordrecht: Reidel), p. 327
- Raymond & Smith (1977) Raymond, J. C., & Smith, B. W. 1977, ApJS, 35, 419
- Schmutz, Leitherer, & Gruenwald (1992) Schmutz, W., Leitherer, C., & Gruenwald, R., 1992, PASP, 104, 1164
- Stasińska, Testor, & Heydari-Malayeri (1986) Stasińska, G., Testor, G., & Heydari-Malayeri, M., 1986, A&A, 170, L4
- Stone & Baldwin (1983) Stone, R. P. S., & Baldwin, J. A. 1983, MNRAS, 204, 347
- Walborn et al. (1995) Walborn, N.R., Lennon, D.J., Haser, S.M., Kudritzki, R.-P., & Voels, S.A., 1995, PASP, 107, 104
- Walborn, Nichols-Bohlin, & Panek (1985) Walborn, N.R., Nichols-Bohlin, J., & Panek, R.J., 1985, IUE Atlas of O-Type Spectra from 1200 to 1900 Å, NASA RP-1155
- Walborn & Panek (1985) Walborn, N.R., & Panek, R.J., 1985, ApJ, 291, 806


| Observation ID | Obs. Date | Instrument | Spectral Element | Exposure Time |
|---|---|---|---|---|
| Z3IQ0304T | 13 Nov 1996 | GHRS | G140L(1197-1487) | 235saaExposure shortened due to loss of guide star lock |
| Z3IQ0305T | 13 Nov 1996 | GHRS | G140L(1469-1765) | 653s |
| Y3IQ0306T | 13 Nov 1996 | FOS/BLUE | G400H | 360sbbNo signal; FOS aperture door closed during exposure |
| Y3IQ0307T | 13 Nov 1996 | FOS/BLUE | G130H | 1500sbbNo signal; FOS aperture door closed during exposure |
| Y3IQA301T | 13 Nov 1996 | FOS/RED | G270H | 650s |
| Y3IQA302T | 13 Nov 1996 | FOS/RED | G570H | 110s |
| Y3IQA303T | 13 Nov 1996 | FOS/RED | G190H | 1200s |
| Y3IQ5305T | 10 Feb 1997 | FOS/BLUE | G130H | 1610s |
| Y3IQ5306T | 10 Feb 1997 | FOS/RED | G190H | 1300s |
| Y3IQ5307T | 10 Feb 1997 | FOS/RED | G570H | 180s |
| Y3IQ5308T | 10 Feb 1997 | FOS/RED | G400H | 370s |
| U3IQB301T | 13 Nov 1996 | WFPC2 | F656N | 700s |
| U3IQB302T | 13 Nov 1996 | WFPC2 | F656N | 700s |
| U3IQB304T | 13 Nov 1996 | WFPC2 | F675W | 80s |
| U3IQB305T | 13 Nov 1996 | WFPC2 | F675W | 80s |
| U3IQB306T | 13 Nov 1996 | WFPC2 | F502N | 700s |
| U3IQB307T | 13 Nov 1996 | WFPC2 | F502N | 700s |
| U3IQB308T | 13 Nov 1996 | WFPC2 | F502N | 700s |
| U3IQB309T | 13 Nov 1996 | WFPC2 | F547M | 80s |
| U3IQB30AT | 13 Nov 1996 | WFPC2 | F547M | 80s |
| Ion | I()/HaaCorrected for reddening as described in text. 1 uncertainties given in parentheses; upper limits are 2 bounds. | Ion | I()/HaaCorrected for reddening as described in text. 1 uncertainties given in parentheses; upper limits are 2 bounds. | |||
|---|---|---|---|---|---|---|
| (Å) | (Å) | |||||
| [Ne V] | 3425 | 0.01 | [Ar IV] | 4740 | 0.017(0.002) | |
| [O II] | 3727 | 1.87(0.07) | [O III] | 4959 | 2.21(0.07) | |
| H 12 | 3750 | 0.035(0.004) | [O III] | 5007 | 6.60(0.20) | |
| H 11 | 3770 | 0.039(0.005) | He I | 5876 | 0.113(0.005) | |
| H 10 | 3798 | 0.052(0.005) | [O I] | 6300 | 0.067(0.003) | |
| H 9 | 3835 | 0.069(0.007) | [S III] | 6312 | 0.017(0.002) | |
| [Ne III] | 3868 | 0.61(0.02) | [O I] | 6363 | 0.023(0.002) | |
| He I | 4026 | 0.019(0.003) | H | 6563 | 2.86(0.010) | |
| [S II] | 4068 | 0.021(0.003) | [N II] | 6583 | 0.161(0.06) | |
| H | 4101 | 0.25(0.01) | He I | 6678 | 0.031(0.002) | |
| H | 4340 | 0.469(0.015) | [S II] | 6716 | 0.233(0.009) | |
| [O III] | 4363 | 0.063(0.003) | [S II] | 6731 | 0.163(0.006) | |
| He I | 4471 | 0.040(0.003) | [Ar V] | 7005 | 0.002 | |
| He II | 4686 | 0.064(0.003) | He I | 7065 | 0.017(0.001) | |
| [Ar IV] | 4711 | 0.019(0.002) | [Ar III] | 7135 | 0.095(0.004) | |
| [Ne IV] | 4725 | 0.007 | [O II] | 7325 | 0.043(0.003) |
| Ion | I()/HaaCorrected for reddening corresponding to A(V) = 0.260.05 as described in text. 1 uncertainties are given in parentheses; upper limits are 2 bounds. | Ion | I()/HaaCorrected for reddening corresponding to A(V) = 0.260.05 as described in text. 1 uncertainties are given in parentheses; upper limits are 2 bounds. | |||
|---|---|---|---|---|---|---|
| (Å) | (Å) | |||||
| C IV | 1548 | 0.2 | H I | 3835 | 0.064 (0.005) | |
| He II | 1640 | 1.4 (0.1) | [Ne III] | 3868 | 0.55 (0.02) | |
| O III] | 1667 | 0.07 (0.03) | H | 4101 | 0.28 (0.01) | |
| N III] | 1750 | 0.05 | H | 4340 | 0.48 (0.02) | |
| Si III] | 1883 | 0.06 (0.01) | [O III] | 4363 | 0.063 (0.004) | |
| C III] | 1908 | 0.47 (0.04) | He I | 4471 | 0.031 (0.004) | |
| C II] | 2327 | 0.05 (0.01) | He II | 4686 | 0.22 (0.01) | |
| He II | 2386 | 0.022 (0.009) | [Ar IV] | 4711 | 0.034 (0.005) | |
| [Ne IV] | 2424 | 0.22 (0.02) | [Ar IV] | 4740 | 0.026 (0.005) | |
| [O II] | 2470 | 0.023 (0.008) | [O III] | 4959 | 2.17 (0.09) | |
| He II | 2511 | 0.043 (0.007) | [O III] | 5007 | 6.9 (0.3) | |
| He II | 2733 | 0.032 (0.005) | He I | 5876 | 0.088 (0.007) | |
| He I | 2945 | 0.013 (0.005) | [O I] | 6300 | 0.020 (0.006) | |
| O III | 3133 | 0.064 (0.006) | [S III] | 6312 | 0.017 (0.006) | |
| He I | 3188 | 0.023 (0.006) | H | 6563 | 2.84 (0.12) | |
| He II | 3203 | 0.078 (0.006) | [N II] | 6583 | 0.124 (0.008) | |
| [O II] | 3727 | 0.73 (0.03) | He I | 6678 | 0.021 (0.007) | |
| H I | 3750 | 0.029 (0.005) | [S II] | 6716 | 0.088 (0.008) | |
| H I | 3770 | 0.055 (0.007) | [S II] | 6731 | 0.112 (0.008) | |
| H I | 3798 | 0.044 (0.006) |
| Spectrum | Diagnostic Ratio | Observed Line Ratio | Quantity | Derived Value |
|---|---|---|---|---|
| CTIO | [S II] 6717/6731 | 1.430.08 | 160 cm-3 | |
| CTIO | [Ar IV] 4711/4740 | 1.120.18 | 28002200 cm-3 | |
| CTIO | [O III] 5007/4363 | 1437 | 11200400 K | |
| CTIO | [O II] 3727/7325 | 443 | 107001200 K | |
| FOS | [S II] 6717/6731 | 0.790.09 | 1500800 cm-3 | |
| FOS | [Ar IV] 4711/4740 | 1.190.29 | 20002000 cm-3 | |
| FOS | [O III] 5007/4363 | 14410 | 11200500 K | |
| FOS | O III] 1666/5007 | 0.0100.004 | 10800800 K | |
| FOS | [O II] 2470/3727 | 0.030.01 | 90001600 K |
| Ion | Abundance relative to H+ | |
|---|---|---|
| CTIO | FOS | |
| He+ | (8.40.3)e-2 | (5.90.4)e-2 |
| He+2 | (5.30.3)e-3 | (1.80.2)e-2 |
| C+ | (4.81.0)e-6 | |
| C+2 | (5.40.6)e-5 | |
| C+3 | 1.8e-5 | |
| N+ | (2.40.1)e-6 | (1.90.1)e-6 |
| N+2 | 2.7e-5 | |
| O+ | (4.50.2)e-5 | (2.20.1)e-5 |
| O+2 | (1.610.05)e-4 | (1.670.08)e-4 |
| Ne+2 | (4.30.2)e-5 | (3.90.2)e-5 |
| Ne+3 | 2.3e-4 | (2.20.2)e-5 |
| Ne+4 | 6.9e-7 | |
| S+ | (6.60.4)e-7 | (4.50.4)e-7 |
| S+2 | (2.60.3)e-6 | (2.60.9)e-6 |
| Ar+2 | (6.80.3)e-7 | |
| Ar+3 | (2.60.3)e-7 | (3.80.7)e-7 |
| Ar+4 | 3.0e-8 | |
| Element | Log Abundance | Dufour 1990 | Garnett 2000 |
|---|---|---|---|
| He/H | –1.080.03 | –1.07 | |
| C/H | –4.160.06 | –4.07 | –4.1 |
| N/H | –4.90.1 | –5.03 | –5.1 |
| O/H | –3.680.02 | –3.57 | –3.6 |
| Ne/H | –4.220.05 | –4.36 | –4.4 |
| S/H | –5.40.1 | –5.15 | –5.3 |
| Ar/H | –2.30.1 | –5.8 | –5.8 |
| log N(H) | T = 106 K | T = 5106 K | T = 107 K |
|---|---|---|---|
| 20.5 | 6.81033 ergs s-1 | 1.71033 ergs s-1 | 1.51033 ergs s-1 |
| 21.0 | 4.51034 | 3.31033 | 1.91033 |
| 21.5 | large | 9.01033 | 3.61033 |
| 22.0 | large | 6.71034 | 2.31034 |