X–ray emission from the galactic center region supernova remnant G0.9+0.1
Abstract
We report the results of a BeppoSAX observation of the composite supernova remnant G0.9+0.1, located in the Galactic Center region. This new observation, in which the core of G0.9+0.1 is observed on–axis, confirms our previous results obtained from a pointing in which the supernova remnant was serendipitously observed at a large off–axis angle. The better quality of the new data allows us to confirm the non–thermal nature of the X–ray source coincident with the central plerion, to significantly improve the estimate of its spectral parameters, to put more stringent upper limits on the presence of coherent pulsations (in the range of periods from 4 ms to 4104 s), to obtain marginal evidence of the possible extended nature of the X–ray plerion and to put a better upper limit on the 2–10 keV X–ray emission from the 8′ diameter radio shell (L erg s-1). The X–ray spectrum is best fit with a power–law model with a photon index 2, cm-2and a 2–10 keV luminosity of erg s-1. The broad band (radio–X–ray) properties of the composite supernova remnant G0.9+0.1 are indicative of the likely presence of a young (2,700 yr) neutron star in its central radio core.
Key Words.:
ISM: supernova remnants: individual: G0.9+0.1 – X–rays: ISM1 Introduction
Supernova remnants (SNRs) are usually classified into three categories, based on their radio morphology: plerions, shell–like and “composite”. About one tenth of known SNRs belongs to this last category (Green 1998). They are characterized by a radio/X–ray shell, related to the expanding ejecta, plus a central synchrotron nebula, powered by the loss of rotational energy from a neutron star (Weiler & Sramek 1988).
The radio source G0.9+0.1 was classified as an SNR by Kesteven (1968). Subsequent radio observations with the VLA and the Molonglo Observatory Synthesis Telescope showed that G0.9+0.1 can be classified as a composite SNR. In fact, it consists of a radio polarized core component (2′ diameter), surrounded by a shell (8′ diameter) with a steeper radio spectrum (Helfand & Becker 1987, hereafter HB87; Gray 1994). La Rosa et al. (2000) recently confirmed the composite morphology of the radio emission with VLA observations at 20 and 90 cm. They measured spectral indices r for the shell and r for the core, typical of composite SNRs.
The position of G0.9+0.1 is very close to the Galactic Center (GC) direction, and a distance estimate based on the -D relation places it at 10 kpc (Downes 1971). Owing to the high interstellar absorption ( cm-2), this SNR was not previously observed in soft X–rays, with the possible exception of a marginal detection with the Observatory (Helfand & Becker 1987). During the BeppoSAX Survey of the GC region (Sidoli et al. 1999), we obtained the first clear X–ray detection of G0.9+0.1 (Mereghetti et al. 1998). Here we report on a longer, follow-up BeppoSAX observation aimed at better characterizing the properties of the X–ray emission from G0.9+0.1.
2 Observations and data analysis
The observations were obtained with the Medium Energy Concentrator Spectrometer (MECS, Boella et al. 1997) that covers the 1.8–10 keV energy range. This is an imaging detector that provides good spatial and energy resolution (8.5% full width at half maximum (FWHM) at 6 keV) over a circular field of view with a diameter of .
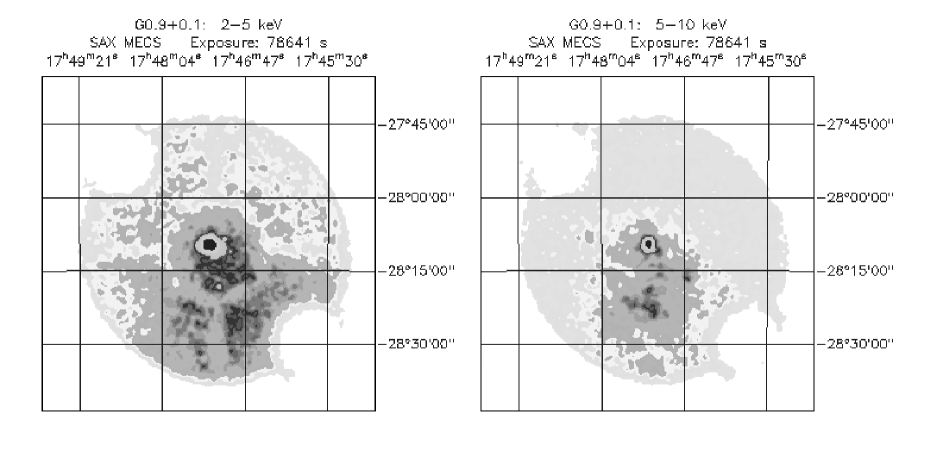
The location of G0.9+0.1 was observed on 1999 August 25–27 for a net exposure time of 78.6 ks in each of the 2 available MECS units. The images in the soft (2–5 keV) and hard (5-10 keV) energy ranges are shown in Fig. 1. The central strong source, located at R.A., Dec. (J2000, 1′ uncertainty), is coincident with the radio core of G0.9+0.1. Due to the proximity of the GC, significant diffuse X–ray emission is present in the whole field of view (see e.g., Koyama et al. 1996; Sidoli & Mereghetti 1999). This emission is particularly strong in the Southern part of the image, where the Sgr B2 molecular cloud is located (Murakami et al. 1999; Sidoli 2000).
Observations of the G0.9+0.1 field carried out with the BeppoSAX high energy non–imaging instrument (PDS, 15–200 keV) are not useful in this context, because of the severe crowding of contaminating hard X–ray sources in the GC region.
2.1 Spectral analysis

The location of G0.9+0.1 is contaminated both by the GC thermal diffuse emission (kT keV), and by X–rays originating from the SgrB2 molecular cloud, with its intense 6.4 keV iron line (see Fig. 1).
To minimize the influence of these components unrelated to G0.9+0.1, we used a circular extraction region of only 2′ in the spectral analysis. In order to properly subtract the Sgr B2 contribution, the local background was estimated from the Southern half of an annular region centered on G0.9+0.1 with inner and outer radii of 5′ and . The resulting MECS net count rate is 0.02470.0007 s-1. We rebinned the MECS counts in order to have at least 20 net counts in each energy bin, and to sample the instrumental energy resolution with no more than 3 spectral channels.
We tried to fit the spectrum with different models: power–law, thermal bremsstrahlung, black body, thermal hot plasma (mekal in XSPEC). The results are reported in Table 1. The best fit model is a power–law with photon index , absorption, , of cm-2, and flux F erg cm-2 s-1 (2–10 keV, corrected for interstellar absorption). A thermal bremstrahlung gives an equally good fit, but the resulting high temperature (too high for a SNR) means that it mimics a power–law in the energy range of our observations.
As shown in Fig. 2, the power–law best fit parameters are marginally consistent with those derived in our previous off–axis observation of G0.9+0.1, and their uncertainties are much smaller. The spectrum is shown in Fig. 3, together with the residuals. The addition of a narrow gaussian line in the range 6.4–7 keV is not required by the data, yielding a normalization consistent with zero, within 90% uncertainties. The upper limit to the equivalent width of a narrow Fe K line is 330 eV, at a confidence level of 90%.
Worse fits were obtained with a blackbody (see Table 1), and with a thermal plasma model (mekal in XSPEC) with abundance fixed at the solar value. Allowing the abundance to vary, we obtain a bremsstrahlung–like spectrum, with abundance consistent with zero. We also tried to fit the spectrum with double–component models. However, no combinations of a power–law plus a thermal model (blackbody or mekal) gives significantly better results, nor are required by the data.
The 2–10 keV luminosity corresponding to the best fit power–law spectrum is L erg s-1, assuming a distance of 10 kpc.
| Model | Column density | Parameter | /dof | Flux (2–10 keV) |
|---|---|---|---|---|
| ( cm-2) | ( erg cm-2 s-1 ) | |||
| Power law | ||||
| Bremsstrahlung | T keV | |||
| Black body | T keV | |||
| mekal | T keV |

2.2 Timing analysis
MECS counts were extracted from a region with radius of 4′ and used for the timing analysis, after the correction of their times of arrival to the solar system barycenter. No flux variations were seen during the BeppoSAX observation. We searched for coherent pulsations over a wide range of periods (4 ms – 4104 s), both in the total energy range and for the soft (2–5 keV) and hard (5–10 keV) bands separately, without finding any significant signal. In Table 2 the 3 upper limits to the pulsed fraction, derived for the assumption of a sinusoidal modulation, are listed for selected periods.
| Period | Energy intervals | ||
|---|---|---|---|
| (s) | (keV) | ||
| 2–5 | 5–10 | 2–10 | |
| 10000 | 22% | 33% | 18% |
| 1000 | 18% | 28% | 16% |
| 100–1 | 20% | 28% | 16% |
| 0.1 | 40% | 43% | 30% |
| 0.01 | 41% | 49% | 39% |
| 0.004 | 50% | 68% | 38% |
2.3 Radial profile
In order to check whether the X–ray emission originates from an extended source or from an unresolved point source, we examined the radial distribution of the G0.9+0.1 counts. We used as a comparison a 25 ks observation of Cyg X–1 obtained in 1998 October. We selected only time intervals in which the BeppoSAX attitude was determined with two star trackers (in fact small deviations may be present when no star tracker is active or when only one is in use). This procedure restricted us to consider about 80% of the on–source time. We then extracted the counts from 6 equally spaced Northern semi–annular regions within 3′ from the centroid of G0.9+0.1. The Southern sector, containing the contaminating Sgr B2 emission, was excluded from the analysis. For the G0.9+0.1 background determination we used the Northern semi–annular region of 5′–8′. The same procedure was used for the reference observation of Cyg X–1.
The resulting radial profiles, normalized at the peak, are plotted in Fig. 4. There is evidence that the profile of G0.9+0.1 is slightly broader than that expected for a single point–like source. This might be due to the contribution of a central extended synchrotron nebula, although we cannot exclude that the difference in the two radial profiles is due to the presence of an underlying diffuse emission, not properly subtracted by our background estimate.

2.4 Limits on shell X–ray emission
To estimate an upper limit to the X–ray emission from the radio shell of G0.9+0.1 (located 4′ from the radio core) we considered the counts from an annular region from 3′ to 5′ from the centroid of the emission. Fitting the resulting spectrum with an absorbed mekal model (NH fixed at 1023 cm-2) we derived a 2–10 keV flux F erg s-1 cm-2 (corrected for interstellar absorption), that translates into a luminosity of erg s-1. Of course, this represent an upper limit to the shell luminosity, since some of the counts could be due to Sgr B2.

3 Discussion
The new MECS observation presented here, thanks to the better on–axis spatial and spectral resolution and to the better statistics, allows us to confirm both the association of the X–rays with the central radio core of G0.9+0.1 and their non-thermal nature.
3.1 Radio and X–rays
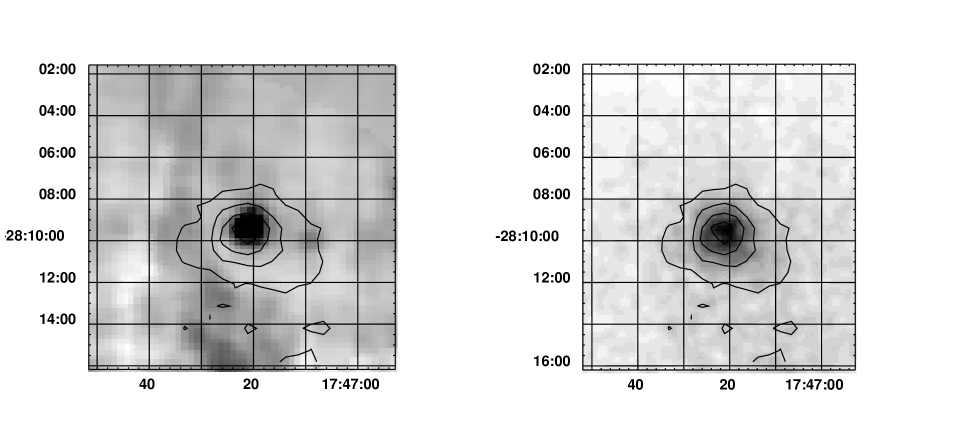
A comparison of the X–ray and radio morphology of G0.9+0.1 is presented in Fig. 6, where it is clearly evident that the observed X–rays originate from the plerionic component rather than from the shell. These radio data are from the NRAO VLA Sky Survey (NVSS, Condon et al. 1998) provided by the public archive available at http://skyview.gsfc.nasa.gov. We note that G0.9+0.1 displays a different morphology depending on the radio frequency: while the image at 1.4 GHz reported here shows the plerion and the Eastern part of the shell (located at a distance of 4′ from the radio core), at 90 cm (HB87; La Rosa et al. 2000) the shell is better defined and the shell emission is stronger in its Western rim.
The upper limit derived in Sect. 2.4, can be compared to the shell X–ray luminosities of other composite supernova remnants reported by HB97. After converting to the 0.5–4.5 energy range, we obtain LXshell erg s-1. From our new X–ray data (extrapolated to the 0.5–4.5 keV range) and the radio observations (HB87; LRcore=7 erg s-1), we find the following ratios: LXc/LXs1.2, LXc/LRc=, where “c” and “s” indicate the core and shell components. These values place G0.9+0.1 well inside the ranges observed in other composite supernova remnants (see e.g., the correlations reported by HB87).
3.2 Energetics and age
As shown in Fig. 2 the spectral parameters of the central component are consistent with those reported earlier (Mereghetti et al. 1998) and there is no evidence for flux variations between 1999 August and 1997 April. This is consistent with the hypothesis that the X–ray emission derives from a synchrotron nebula powered by an energetic pulsar at the center of G0.9+0.1. It is also likely that part of the emission is due to the pulsar itself. The upper limits derived in our periodicity search do not allow us to exclude the presence of a pulsar with a relatively large pulsed fraction (below 30%–40%), in particular for periods shorter than 0.1 s.
The power–law photon index, 1.95, is in agreement with the value of 2 typical of other well studied X–ray synchrotron nebulae (Asaoka & Koyama 1990) powered by young energetic pulsars.
Seward & Wang (1988) derived a relation between the X–ray luminosity and rotational energy loss of neutron stars powering synchrotron nebulae. Although this is just an empirical law, subject to large uncertainties, it can be used to roughly estimate the possible parameters of the neutron star in G0.9+0.1. Assuming I=1045 g cm2 for the neutron star moment of inertia, the Seward & Wang (1988) relations for the pulsar period, period derivative and the surface magnetic field are:
| (1) |
| (2) |
| (3) |
The estimated age for the remnant, as indicated by the diameter of the radio shell (12 pc at the GC distance) is between 1,100 yr (free expansion with velocity v km s-1) and 6,800 yr (adiabatic expansion; Mereghetti et al. 1998). Thus we obtain P=0.19 s, s s-1, and a magnetic field B G for the free expansion age or P=0.078 s, s s-1, and a surface magnetic field B G for the adiabatic age ( erg s-1 from our X–ray data).
The age of the plerion can also be estimated from the frequency break in the broad band spectrum from radio to X-rays shown in Fig. 5. Extrapolating the slope of the now well defined BeppoSAX spectrum back to the radio range and assuming that a single spectral break occurs and that the spectrum is straight after the break, we can place the frequency of the break at 1011 Hz. The energy in relativistic electrons is:
| (4) |
where B is the nebular magnetic field. Assuming equipartition between particles and magnetic fields (Ue=(4/3)UB=B2/6), B can now be calculated, considering a core component volume of cm3 (HB87) and =1011 Hz. This gives B=6.7 G. This translates into a total energy for the magnetic field and the relativistic particles of E erg. So, an independent estimate of the age of the remnant is t = (E 2,700 yr, closer to the free-expansion approximation, than to the adiabatic age.
3.3 Other SNRs in the GC region
The location of the composite SNR G0.9+0.1 in the GC invites a comparison with other SNRs located in this same region. The Green Catalogue (Green 1998) lists seven SNRs in the direction of the GC (), six shell–like and only one composite (G0.9+0.1). Besides G0.9+0.1, only two of them have been reported to clearly emit X–rays: G359.1–0.5, from its central region surrounded by the radio shell, and G359.0–0.9, from a part of its radio shell (Bamba et al. 2000; ASCA). While G359.1–0.5 seems to be located at the GC distance, G359.0–0.9 is probably a foreground object.
Another possible SNR, the SgrA East halo (Pedlar et al. 1989), has been recently reported to emit thermal X–rays with kT0.6 keV (Sidoli & Mereghetti 1999). The SgrA East halo is a radio source with a diameter of 20 pc located near the center of our Galaxy. It is a distinct object from the nearby SgrA East (Pedlar et al. 1989) and is not included in the Green catalogue.
The lack of X–ray detections from the other SNRs in the GC region could be due to several reasons: their shells may not emit X–rays, due to an evolved age of the remnants (in the case of thermal emission) or, as suggested by Bamba et al. (2000), because of a reduced lifetime of the electrons emitting synchrotron X–rays caused by a higher magnetic field in the GC region (in the case of non–thermal emission from the shell). In addition, if their shells emit soft X–rays, their observability is hampered by the severe interstellar absorption (especially below 2 keV) and by the presence of contaminating X–ray sources, both point–like and diffuse. It is thus not surprising that definite detections have been obtained when the emission is hard (as in the case of the plerion G0.9+0.1), or particularly bright (as in the case of the SgrA East halo).
SNRs are thought to contribute to the diffuse X–ray emission observed from the GC, especially at soft X–rays. However, the number of SNRs known to emit high energy radiation is too low to account for this emission (e.g. Koyama et al. 1996), even if the reason for this discrepancy could only be an observational bias.
4 Conclusions
The new BeppoSAX data reported here, the first X–ray observation pointed at the center of the composite SNR G0.9+0.1, have confirmed the non–thermal origin of the X–ray emission that was suggested by the previous serendipitous observation (Mereghetti et al. 1998; Sidoli et al. 1999). Such data could not completely rule out a thermal origin of the X–ray emission, due to the poor statistic of the off–axis spectrum. This follow-up observation has allowed us to significantly better constrain the spectral parameters and to safely conclude that the X–rays observed from G0.9+0.1 are due to non–thermal emission from its radio core.
A thermal model, either originating from the surface of a neutron star, or from a hot diffuse plasma filling the central part of the SNR, can now be excluded as the main contributor to the observed X–rays. A double component model, non–thermal plus thermal (blackbody or mekal) emission components, is not required by the BeppoSAX data.
There are some indications of a diffuse nature of the X–ray emission from G0.9+0.1. However, since a strong contamination from the local background exists, XMM–Newton and observations, with their superior sensitivity and spatial and spectral resolution, are needed to confirm this finding and to discriminate between a point source (i.e. a neutron star) and a synchrotron nebula and to possibly detect X–rays from the radio shell.
Acknowledgements.
The BeppoSAX satellite is a joint Italian-Dutch programme. L. Sidoli and F. Bocchino acknowledge an ESA Fellowship. We thank A. Parmar for helpful discussions. This research has made use of NVSS radio data obtained through , provided by the NASA/Goddard Space Flight Center.References
- (1) Asaoka I., Koyama K., 1990, PASJ 42, 625
- (2) Bamba A., Yokogawa J., Sakano M., et al., 2000, PASJ 52, 259
- (3) Boella G., Chiappetti L., Conti G., et al., 1997, A&AS 122, 327
- (4) Condon J.J., Cotton W.D., Greisen E.W., et al., 1998, AJ 115, 1693
- (5) Downes D., 1971, AJ 76, 305
- (6) Gray A.D., 1994, MNRAS 270, 835
- (7) Green D.A., 1998, , In: “A Catalogue of Galactic Supernova Remnants”, http://www.mrao.cam.ac.uk/surveys/snrs/
- (8) Helfand D.J., Becker R.H., 1987, ApJ 314, 203
- (9) Kesteven M.J., 1968, Australian J. Phys. 21, 739
- (10) Koyama K., Maeda Y., Sonobe T., et al., 1996, PASJ 48, 249
- (11) La Rosa T.N., Kassim N.E., Lazio T.J.W., et al. 2000, ApJ 119, 207
- (12) Mereghetti S., Sidoli L., Israel G. L. 1998, A&A, 331, L77
- (13) Murakami H., Koyama K., Sakano M., et al., 1999, ApJ 534, 283
- (14) Pedlar A., Anantharamaiah K.R., Ekers R.D., et al. 1989, ApJ 342, 769
- (15) Petre R., Becker C.M., Winkler P.F., 1996, ApJ 465, L43
- (16) Rho J., Petre R., 1998, ApJ 503, L167
- (17) Sakano M., Yokogawa J., Mukarami H., et al., 1999, In Proc. of the “Japanese German Workshop on High Energy Astrophysics”, eds. Becker W. & Itoh W., MPE Report 270, 113
- (18) Seward F.D., Wang Z., 1988, ApJ 332, 199
- (19) Sidoli L. 2000, PhD Thesis, University of Milan, Italy
- (20) Sidoli L., Mereghetti S., Israel G.L., et al. 1999, ApJ 525, 215
- (21) Sidoli L., Mereghetti S. 1999, A&A 349, 49
- (22) Weiler K.W., Sramek R.A., 1988, ARA&A 26, 295
- (23) White R.L., Long K.S., 1991, ApJ 373, 543