THE BEPPOSAX VIEW OF THE GALACTIC CENTER REGION
SIDOLI LARA
SSD-ESA/ESTEC
Postbus 299, NL-2200 AG Noordwijk, The Netherlands
Abstract
The Galactic Center Region has been surveyed in 1997–1998 with the Narrow Field Instruments on-board the BeppoSAX satellite (2–10 keV energy range). The X–ray emission from Sgr A*, the putative supermassive black hole at the center of our Galaxy, has been measured and its spectrum studied, together with the X–ray emission from several bright X–ray sources, Low Mass X–ray Binaries (LMXBs) containing neutron stars and black holes located within the region (). New point–like X–ray sources have also been discovered. The results on the diffuse emission coming from the SgrA Complex are summarized here: it displays a two–temperature thermal spectrum (kT 0.6 keV and kT8 keV) and an energy–dependent morphology, with the hard emission (5–10 keV) elongated along the galactic plane and the soft one (2–5 keV) spatially correlated with the radio halo of SgrA East. The results of the study of the diffuse X–ray emission from other three fields in the Galactic Center Region containing the giant molecular clouds Sgr B2, Sgr C and Sgr D are reported for the first time. The diffuse emission from the direction of these three molecular clouds shows a double temperature nature as well, with a prominent iron line at 6.7 keV, the intensity and equivalent width of which depends on the galactic longitude. Moreover, the Sgr B2 spectrum shows an intense 6.4 keV line of fluorescent origin. While the hard component of the Galactic Center diffuse emission displays a similar temperature with respect to the Galactic Ridge, the low temperature plasma is significantly softer. This may be due to a net contribution produced from the accretion of material onto old isolated neutron stars located inside the giant molecular clouds.
1 Introduction
The Galactic Center (hereafter GC) Region is still one of the most enigmatic regions of our Galaxy, despite the deep investigations performed in the entire electromagnetic spectrum. The extreme interstellar absorption severely affects its observability, especially in the optical/ultraviolet range. The interstellar medium is transparent for energies below 2m and above 2 keV. Thus, the X–ray band is one of the privileged observing windows for the GC. Since a large concentration of mass exists towards the GC direction, the crowding of sources, at all energies, is severe as well. For this reason, instruments with a good spatial resolution are needed.
Several peculiar objects are present within a few parsec from the Center of our Galaxy, including the SgrA Complex, a remarkable ensemble of structures observed in the radio band. It is composed by at least four distinct objects (see Fig. 1): the SgrA East shell, the SgrA East halo, the SgrA West HII region, with its mini–spiral shape, and the compact non–thermal radio source Sgr A*. The first two structures are non–thermal radio sources. Their real nature is not clear from the radio observations alone. They might be supernova remnants or by–products of a past outburst of activity from the GC.
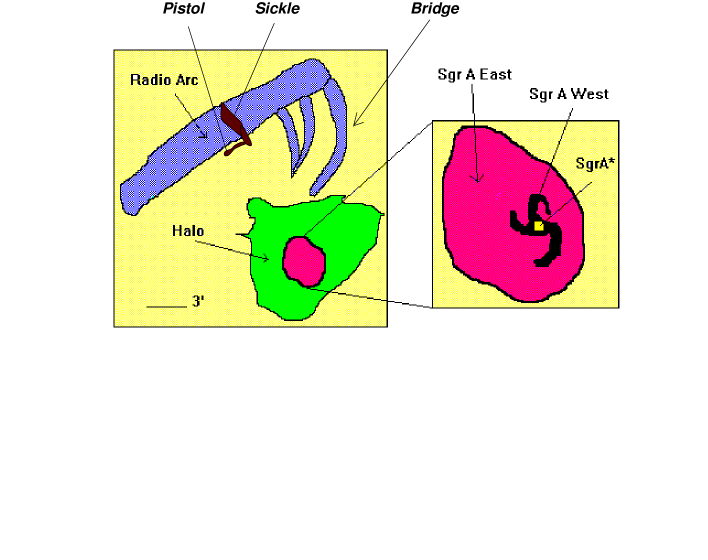
Sgr A*, located at the dynamical center of our Galaxy, is thought to be a super–massive black hole of about 2.5 solar masses. The presence of such a large dark mass towards it is supported by the measurements of the mass distribution and dynamics of infrared stars in the central parsec of the Galaxy (e.g., Ghez et al. 1998). The overall spectrum of Sgr A* is still poorly determined. Up to now there are no sicure counterparts of Sgr A* at any other wavelengths, with the exception of the recent detection with (Baganoff et al. 1999).
The Center of our Galaxy is rather silent at high energies, emitting at a level which is several orders of magnitude below the Eddington luminosity for a super–massive black hole of its mass. In fact, the hard X–ray images obtained with coded–mask detectors have shown that the high energy activity previously detected with non–imaging instruments and associated with the GC, is instead produced by two black hole candidates of stellar origin, 1E 1740.7–2942 and GRS 1758–258, unrelated to the GC. Previous X–ray observations led to the discovery that a high density of point–like sources exists towards the GC. These sources include several transients, i.e. objects that are bright in X–rays only sporadically. It is unclear whether this concentration follows the stellar mass density or if there is evidence of an additional population of X–ray sources. The bright sources (L erg s-1) are binaries containing compact objects (neutron stars or black holes) accreting matter from stellar companions (probably of low mass). Some of these sources are particularly interesting, belonging to the class of “micro–quasars”, with relativistic, double-sided radio jets.
The GC region is also characterized by strong diffuse X–ray emission, first observed with the Observatory (Watson et al. 1981). The satellite revealed the presence of a 6.7 keV line emission from the Galactic Plane which was particularly intense towards the GC direction (Koyama et al. 1989). The ASCA satellite confirmed the presence of this diffuse component, which extends symmetrically with respect to the GC. Its spectrum is well described by a thermal hot plasma with a temperature of 7 keV, but there is also evidence for a multi–temperature plasma. In fact, several emission lines are present, with the K–lines from iron and sulfur (at 2.4 keV) particularly bright (Koyama et al. 1996). The nature of the diffuse emission is still unknown, especially since its temperature is too high to allow the confinement of the emitting plasma by the galactic gravity. Part of it (especially that at the lower energy region of the spectrum) could be due to the integrated thermal emission from supernova remnants. Other emitting processes have been proposed in order to reject the thermal nature of this component or to decrease its temperature: non–thermal emission from SNRs, inverse Compton scattering by relativistic electrons, emission lines of non–thermal origin produced during capture of electrons by accelerated ions, charge exchange by low energy heavy ions with neutral gas, non–thermal emission from the interaction of low energy cosmic ray electrons with the interstellar medium (see, e.g., the recent results of Valinia et al. 2000).
Another diffuse component was discovered with ASCA: a 6.4 keV iron line component of fluorescent origin, the extent of which well correlates with the distribution of the molecular clouds in the GC region (Koyama et al. 1996). This emission is thought to be the result of irradiation of the dense molecular clouds by hard photons coming from bright X–ray sources, located inside or outside the cloud. However, this emission seems too intense to be due to reprocessing of hard X–rays from any known source in the GC region. Thus, a possible explanation is that the illuminating source could have been Sgr A*, during a past phase of high-energy activity (Koyama et al. 1996; Churazov et al. 1996). Thus, the study of the diffuse component can also cast light on the past high energy activity from the GC itself.
I report here on the results of the survey (1997-1998) of the GC region performed with the Narrow Field Instruments (NFI) on-board the BeppoSAX satellite (Boella et al. 1997). Only data obtained from the MECS instrument (2–10 keV energy range) are relevant here. In particular, the main objects of this study are the following:
-
•
the spectral properties of the point–like X–ray sources, low mass X-ray binaries (LMXBs) containing neutron stars and black holes, both displaying persistent and transient emission;
-
•
the X–ray counterpart of Sgr A*, its spectrum and its emission level;
-
•
the spectrum and spatial distribution of the diffuse emission from the GC Region.
2 Spectroscopy of the Point–like Sources
The region of the sky covered by the BeppoSAX NFI observations is shown in Fig. 2. A pointing on the black hole candidate GRS 1758–258, degrees away from the GC, is not included in this mosaic (see Sidoli et al. 1999 and Sidoli 2000 for a detailed description of the analysis and results).
We discovered new X–ray sources: the X–ray emission of plerionic origin coming from the radio core of the composite supernova remnant G0.9+01 (Mereghetti et al. 1998; Sidoli et al. 2000) and weak X–ray emission from a still unidentified object, discovered near the molecular cloud Sgr D at the position R.A.=, Dec.= (J2000, 1′ uncertainty). Its power-law spectrum (photon index 1.4, flux corrected for the absorption FX1.2 erg cm-2 s-1) displays a prominent iron line (EW= keV; Sidoli 2000).
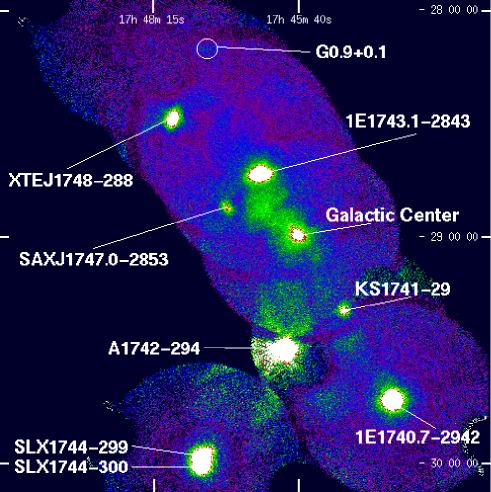
Several bright sources (Lerg s-1), all previously known, have been studied (Sidoli et al. 1999): 1E 1743.1–2843 (Watson et al. 1981; Cremonesi et al. 1998), the persistent black hole candidates 1E 1740.7–2942 (Hertz & Grindlay 1984) and GRS 1758–258 (Sunyaev et al. 1991), the X–ray bursters SLX 1744–299, SLX 1744–300, A 1742–294, KS 1741–293 (Skinner et al. 1990; Pavlinsky, Grebenev & Sunyaev 1994; Kawai et al. 1988), and the source at the GC position (Watson et al. 1981). We also detected two X–ray transients discovered very recently: the X–ray burster SAX J1747.0–2853 (in’t Zand et al. 1998; Sidoli et al. 1998) and the new superluminal source XTE J1748–288 (Smith, Levine & Wood 1998).
The results of the spectroscopy of all these bright sources, low mass X–ray binaries containing neutron stars (indicated by type I X–ray bursts) or black holes (with spectra similar to the “low–hard state” of the well know black hole candidate Cyg X–1) are shown in Fig. 3, where a single power-law model has been used to fit the 2–10 keV emission. The large range in interstellar absorbing column density is also shown in Fig. 4 in dependence of the galactic latitude, that can be translated into height from the galactic plane, since all these sources are likely located at the GC distance.


3 The X–ray Counterpart to Sgr A*
The large concentration of mass towards the GC direction severely complicates the analysis of the X–ray emission from Sgr A*, especially with the MECS instrument, the spatial resolution of which is at a level of 1′ (2.5 pc at the GC distance). Both the presence of the diffuse emission, peaking at the GC, and several point–like sources (known from previous missions and displayed in the Fig. 5) within few arcminutes from Sgr A*, allowed us to place an upper limit to the X–ray flux contributed by Sgr A* in the 2–10 keV band.
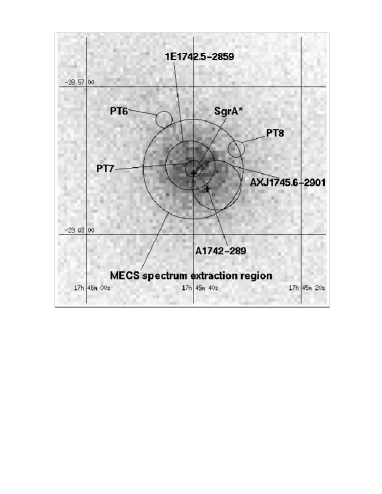
With the first imaging of the GC region with the Observatory (Watson et al. 1981, 0.5–4.5 keV) the point–like source 1E 1742.5–2859, positionally coincident with Sgr A*, was discovered. A diffuse component around the GC was also detected. The ROSAT satellite observed this same region in the 0.1–2.4 keV energy range (Predehl & Trumper, 1994) and, in addition to the diffuse emission, showed the presence of three different sources. One of these sources is highly absorbed and located within from Sgr A*. Other X–ray sources are located within few arcminutes from Sgr A*: the transient A 1742–289, discovered in outburst with Ariel V in 1975 (Branduardi et al. 1976) and the LMXB AX J1745.6–2901 (Maeda et al. 1996).
The spectrum and flux to be ascribed to the GC point source(s) have been estimated (using the MECS data only) extracting counts from a circular region with radius centered at the position of the X–ray peak flux (see Fig. 5). A local background has been taken from an external annular region (), in order to subtract the contribution of the diffuse emission. Several emission lines (especially the sulfur line at keV and the iron line at 6.7 keV) are present in this spectrum, indicative of a contamination from the diffuse emission, that indeed peaks at the GC position. A good fit has been obtained with a hot plasma model with a temperature of keV, absorbed by a column density, NH, of 7 cm-2. No evidence for a 6.4 keV line of fluorescent origin is present, contrary to what is found from the surrounding diffuse emission (see next section). The 2–10 keV flux corrected for the absorption is erg cm-2 s-1 and the luminosity is erg s-1 (a distance of 8.5 kpc is assumed). Since also the diffuse emission contributes to this flux, only an upper limit to the emission from Sgr A* can be placed, at a level of erg s-1 (2–10 keV). This estimate has been obtained extrapolating the surface brightness of the diffuse emission from the surrounding region up to the Sgr A* position, and assuming that all the net flux is contributed only by Sgr A*.
Recently, a observation of the GC detected one weak source, probably the real counterpart to Sgr A*, with a luminosity, LX, of erg s-1 (0.1–10 keV) (Baganoff et al. 1999).
4 Diffuse X–ray emission
The diffuse X–ray emission from the innermost 4 degrees along the galactic plane has been mapped with four MECS pointed observations. The regions considered for the spectral analysis are indicated in Fig. 6. They are marked by circles (radii = 8′) representing the inner part of the field of view of four MECS pointings.
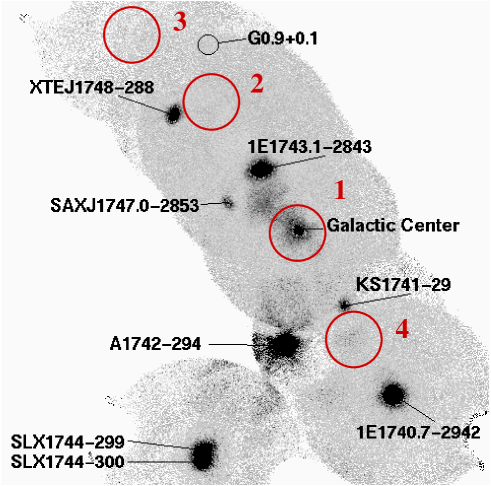
The fields include Sgr D (l1.06, b–0.14; field n. 3), Sgr B2 (l0.65, b–0.04; field n. 2), Sgr A (GC, field n. 1) and Sgr C (l359.4, b–0.11; field n. 4), the main GC molecular clouds complexes as derived with the CO surveys (e.g. Oka et al. 1998). These molecular clouds are part of a large layer of neutral gas distributed along the galactic plane (width50 pc, length 500 pc).
The MECS instrument is particularly suited for the study of the diffuse sources, due to its simple and unstructured point spread function. All the spectra were extracted from within 8′ from the pointing direction in order to use the region of the detector with the best spatial and spectral properties (and also, in some cases, to avoid off–axis point sources). Only the spectrum from the Sgr A pointing was extracted from an annular corona with outer and inner radii of 8′ and 2′ respectively, in order to avoid the central point source(s) and the probable counterpart to Sgr A*.
4.1 Diffuse X–ray emission from the SgrA Complex
The overall spectrum from the SgrA Complex displays several emission lines. A fit with a thermal bremsstrahlung continuum plus three gaussian lines centered at 1.8, 2.4 and 6.7 keV, to account for the most prominent emission lines in the spectrum (from Si, S and Fe respectively), resulted in a temperature of 13 keV. However this temperature is too high to be consistent with the presence of the low energy emission lines. A possible explanation is a multi-temperature plasma. Thus, we fitted the spectrum with two thermal emission plasma models. The best fit parameters are kT10.6 keV and kT28 keV. A gaussian line added at 6.4 keV gives an equivalent width EW120 eV.
To study the spatial distribution of the diffuse emission, images in two different energy bands (2–5 keV and 5–10 keV) were extracted. They show significantly different morphologies, with the hard emission with an elliptical shape elongated in the direction of the Galactic plane, while the soft component shows a triangular shape, spatially correlated with the triangular halo of SgrA East.
The fact that also the spectral data could be well described by a two–temperature model (with kT10.6 and kT28 keV), can suggest that the SgrA Complex diffuse emission may be explained in terms of two plasma components at different temperatures and with different spatial distributions. In this scenario, it is remarkable that the lower temperature plasma is well correlated with the Sgr A East triangular radio halo, a likely evolved SNR (Pedlar et al. 1989).
From the spectral parameters of the soft component and the size of the SgrA East halo (radius10 pc), an electron density ne3 cm-3 and a pressure P3 erg cm-3 can be calculated (Sidoli & Mereghetti 1999). This value is consistent with the pressure PSedov4 erg cm-3 derived for a SNR in a Sedov phase. In conclusion, if we assume that this thermal emission is mostly produced by the Sgr A East halo, its X–ray luminosity, pressure, density, temperature of the emitting gas (0.6 keV) and size (20 pc), match well with a supernova remnant origin in which thermal line emission is produced when the expanding supernova explosion heats the ISM to X–ray temperatures.
4.2 Diffuse X–ray emission from the Molecular Clouds
Three fields located on the galactic plane (within about 200 pc from the GC), free from bright X–ray sources, have been studied (Sidoli 2000). The MECS pointings considered here were centered on three molecular clouds complexes, Sgr B2, Sgr C and Sgr C (Fig. 6). The X–ray emission from these fields is harder than that coming from the Sgr A Complex, and displays weaker emission lines at low energy. On the other hand the Fe lines around 6–7 keV are again particularly bright. An iron line at 6.4 keV is prominent in the spectrum from field n. 2, due to fluorescent emission from the molecular cloud Sgr B2.
The dependence on the galactic longitude of the properties of the iron line diffuse emission are reported in Figs. 7–8. For comparison, also the parameters for the central pointing on Sgr A (Field n.1) are shown. The intensity (Fig. 8) of the 6.7 keV iron line (in the case of field n. 2 it is a blend of 6.7 and 6.4 keV lines) shows a peak at the GC. Field n. 2 displays an excess with respect to field n. 4, located at the same galactocentric distance, due to the iron emission from Sgr B2 molecular cloud itself.


The spectra from the three fields have been fit with thermal plasma models, first with single temperature, then with two–temperature, due to soft excesses remaining when fitting with a single component model. All the results are reported in Table 1. The temperatures of the soft and hard components from these three fields are in the ranges 0.2–0.4 keV and 7–9 keV respectively.
| Field n. | NH | Parameters | Red.(dof) | Flux |
| ( cm-2) | ( erg cm-2 s-1) | |||
| 2 | 1.29 (284) | |||
| E fixed | ||||
| I | ||||
| EW | ||||
| 3 | 0.99 (230) | |||
| 4 | 0.96 (152) | |||
The fact that the GC diffuse emission can be well fit with a two–temperature plasma model, suggests a comparison with the properties of the diffuse emission coming from other regions of the Galactic plane. In fact, the Galactic plane is permeated by a diffuse X–ray component (the so–called Galactic Ridge emission) with a two–temperature as well, kT10.8 keV and kT28 keV (ASCA observations of the Scutum Arm region; Kaneda et al. 1997).
While the hard components in the Galactic Ridge and in the GC display a similar temperature, the soft component coming from the GC shows a significantly lower temperature (0.2–0.4 keV) with respect to the Galactic Ridge emission (0.8 keV).
This discrepancy, other than to different physical conditions of the ISM in the GC region, could be due to a higher interstellar absorption that makes quite uncertain the estimate of the parameters of the soft component in the GC direction. Indeed, in the Scutum Arm both the less severe interstellar absorption and the larger band of the ASCA instruments (0.5–10 keV) resulted in a more precise measurement of the temperature. Another explanation can be a possible “contamination” of the soft part of the spectra by emission physically related with the molecular clouds themselves.
Molecular clouds can emit X–rays in different ways. In several cases the emission is produced in the star forming regions naturally located inside the clouds (e.g. Koyama et al. 1996b). Pre–main sequence stars are strong X–ray emitters (up to 10 erg s-1) with a large variety of behaviours, both with persistent thermal emission and with hard flares.
Another possibility can be the emission from old isolated neutron stars (ONS) accreting from the dense ISM inside the molecular clouds (Treves & Colpi 1991; Zane, Turolla & Treves, 1996). The spectrum emerging from such emission is indeed thermal and rather soft and could explain the lower soft temperature, with respect to the Galactic Ridge, of the fields containing molecular clouds. In this case, the X–ray luminosity contributed by a single ONS depends on the density ncloud of the molecular cloud and on the relative velocity v of the neutron star with respect to the accreting matter: L ncloud v erg s-1, where v10 is the relative velocity in units of 10 km s-1. Assuming v75–100 km s-1 and n cm-3 for a typical molecular cloud in the GC region, we get LONS10 erg s-1. The number of neutron star expected to reside in a single molecular cloud can be calculated from the stellar distribution as n pc-3, where r is the distance from the GC. Assuming r200 pc and a cloud volume V pc3, n ns/cloud; thus each cloud could contribute at a level of about erg s-1 to the luminosity of the soft component of the diffuse emission from the GC region.
Molecular clouds can also be the sites of reprocessing, scattering and reflection of hard photons from X–ray sources located inside or outside the clouds themselves. The strong X–ray emission in the 6.4 keV line from Sgr B2 has be explained by Koyama et al. (1996) and by Sunyaev & Churazov (1996) with the reflection of hard X–rays coming from the GC during a past outburst from Sgr A*. Also our data require the addition of a 6.4 keV line to better fit the spectrum from Sgr B2, but we cannot claim the prevalence of the 6.4 keV fluorescent line with respect to the 6.7 iron line as Murakami et al. (1999).
Observations with a higher spectral and spatial resolution are needed in order to precisely define the properties of this X–ray emitting cloud and to cast light on the possible link with a past high–energy activity of the GC.
5 Acknowledgements
The BeppoSAX satellite is a joint Italian-Dutch programme. I acknowledge an ESA Fellowship. All the results reported here are part of my PhD Thesis, carried out at the “G. Occhialini” Institute of Cosmic Physics (IFC/CNR) of the C.N.R., Milano (Italy).
I would like to thank Sandro Mereghetti for his constant support and careful supervision. Aldo Treves is acknowledged for many suggestions and his guide during the thesis work. Lucio Chiappetti, Gianluca Israel and Giorgio Matt provided very important assistance in the SAX data analysis and it has been a pleasure to collaborate with them. I am very grateful to Silvano Molendi, especially for his help with the analysis of the diffuse emission. I am grateful to Arvind Parmar for his useful comments on this manuscript.
My special thanks go to Annamaria Borriello, for her important help in numerous occasions and for many interesting and constructive discussions.
6 References
Baganoff, F., Angelini, L., Bautz, M., et al.: 1999, AAS 195, 6201
Boella, G., Butler, R.C., Perola, G.C., et al.: 1997, A&AS 122, 299
Churazov, E., Gilfanov, M. & Sunyaev, R.: 1996, ApJ 464, L71
Cremonesi, D.I., Mereghetti, S., Sidoli, L. & Israel, G.L.: 1999, A&A 345, 826
Ghez, A.M., Klein, B.L., Morris, M., Becklin, E.E.: 1998, ApJ 509, 678
Hertz, P. & Grindlay, J.E.: 1984, ApJ, 278, 137
in’t Zand, J.J. et al.: 1998b, IAU circ. n.6846
Kaneda, H. et al. 1997, ApJ 491, 638
Kawai, N., Fenimore, E.E., Middleditch, J.,et al.: 1988, ApJ 330, 130
Koyama, K., et al.: 1989, Nature 339, 603
Koyama, K., Maeda, Y., Sonobe, T., et al.: 1996, PASJ 48, 249
Koyama, K., et al.: 1996b, PASJ 48, L87
Maeda, Y., et al.: 1996, PASJ 48, 417
Menten, K.M., Reid, M.J., Eckart, A. & Genzel, R.: 1997, ApJ 475, L111
Mereghetti, S., Sidoli, L. & Israel, G.L.: 1998, A&A 336, L81
Murakami, H., Koyama, K., Sakano, M., et al., 2000, ApJ 534, 283
Oka, T., Hasegawa, T., Sato, F., et al., 1998, ApJ Suppl. Ser. 118, 455
Pavlinsky, M.N., Grebenev, S.A., & Sunyaev, R.A.: 1994, ApJ 425, 110
Pedlar, A., et al.: 1989, ApJ 342, 769
Predehl, P. & Trumper, J.: 1994, A&A 290, L29
Sidoli, L., Mereghetti, S., Israel, G.L., et al.: 1998, A&A 336, L81
Sidoli, L., Mereghetti, S., Israel, G.L., et al.: 1999, ApJ 525, 215
Sidoli, L. & Mereghetti, S.: 1999, A&A 349, L49
Sidoli, L.: 2000, PhD Thesis, University of Milan, Italy
Sidoli, L., Mereghetti, S., Israel, G.L., Bocchino, F.: 2000, A&A submitted
Skinner, G.K., Foster, A.J., Willmore, A.P., Eyles, C.J.: 1990, MNRAS 243, 72
Smith D.A., Levine, A. & Wood, A.: 1998, IAU Circ. n.6932
Sunyaev, R.A., Churazov, E., Gilfanov, M., et al.: 1991, A&A 247, L29
Treves, A. & Colpi, M.: 1991, A&A 241, 107
Valinia, A., et al.: 2000, ApJ in press
Watson, M.G., Willingale, R., Grindlay, J.E. & Hertz, P.: 1981, ApJ 250, 142
Zane, S., Turolla, R. & Treves A.: 1996, ApJ 471, 248