The anomalous Galactic globular cluster NGC 2808.††thanks: Based on observations made at the European Southern Observatory, La Silla, Chile, and on observations with the NASA/ESA Hubble Space Telescope.
Abstract
We present Johnson , and Kron-Cousins photometry for about 60,000 stars in a region of arcmin2 centered on the Galactic globular cluster (GGC) NGC 2808. The central arcsec region has been mapped also in the F218W, F439W, and F555W bands with the WFPC2 camera. Overall, we cover a field which extends from the center to about 1.7 tidal radii. Photometric calibration has been secured by more than 1000 standards, and the and photometry has been linked to the groundbased system.
We confirm the anomalously elongated horizontal branch (HB) with gaps along it, and we show that the gaps are statistically significant. Most importantly, we find that:
-
•
the extended blue tail of HB (EBT) is present beyond arcsec, corresponding to more than nine times the half mass radius , and extends to also in these external regions;
-
•
also the gaps on the EBT are present at least out to 400 arcsec from the cluster center, and possibly beyond that. The location of the gaps in the HB seems to be the same all over the cluster.
-
•
there are no significant radial gradients in the distribution of the stars in the different HB stumps and some marginal evidence of an increase in the number of red giant branch (RGB) stars in the cluster core.
The observational facts presented in this paper seem to exclude the possibility that the EBTs originate from tidal stripping of the envelope of the RGB stars due to close encounters in high density environments or to mass transfer in close binaries. Also, it is not clear whether the presence of EBTs and gaps on them are the manifestation of the same physical phenomenon.
We have also shown that the jump recently identified in the HB using Strömgren- photometry is clearly visible also in the , plane, at K.
Finally, we present the luminosity function (LF) of the RGB. The LF clearly shows the presence of the usual RGB bump, but also a second feature, 1.4 magnitudes brighter in , that we have named RGB heap. The RGB heap, visible also in other GGCs, is a new feature that, because of its position on the RGB, we have tentatively associated with the recently discovered K giant variables.
Key Words.:
(Stars:) Hertzsprung–Russell (HR) and C-M diagrams; Stars: horizontal-branch; Stars: luminosity function, mass function; Stars: Population II; (Galaxy:) globular cluster: individual: NGC 28081 Introduction
After more than three decades of observational and theoretical efforts, the causes of the star distribution along the horizontal branch (HB) in Galactic globular clusters (GGC) remain obscure. In general, the HBs tend to become bluer and bluer with decreasing metallicity. However, there is a large variety of HB morphologies, and many HBs do not have the color expected for their metal content. Among these, a special case is represented by those clusters that have extended-HB blue tails (EBT), indicating that some of the HB stars lost almost all of their envelope during the red giant branch (RGB) phase or at the helium core flash (Ferraro et al. 1998; Piotto et al. 1999, and references therein). In many GGCs there is another peculiarity: a bimodal or multimodal distribution along the HB (Catelan et al. 1998), which sometimes results in a gap, i.e., a region clearly underpopulated in stars. All the EBTs present at least one gap along them (Ferraro et al. 1998; Piotto et al. 1999). No clear explanation for the origin of the gaps is available at present.
Surely, NGC 2808 represents the most extreme known example of these anomalous GCs. Since Harris Harris (1974), it is known that its HB is rather unusual. In fact, it is rich in both red and blue HB stars, but almost completely lacking in intermediate color objects. Despite the richness of the total HB population, Clement & Hazen Clement & Hazen (1989) found only two RR-Lyrae variables. The bimodality of the HB has been confirmed in many subsequent color magnitude diagram (CMD) investigations of NGC 2808 (Walker 1999, and references therein, hereafter W99), and in some other clusters (Catelan et al. 1998) However, only the deep CMD in the , , and UV (F218W) bands — based on WFPC2 data — allowed the discovery of the other anomalies which make NGC 2808 probably a unique case (Sosin et al. 1997, hereafter S97). S97 showed that the blue HB extends down to very faint magnitudes, well below the main sequence (MS) turn-off. Most importantly, the EBT has also two narrow gaps. S97 could not find any plausible explanation either for the HB extension or for the multimodal distribution of the HB stars. As already suggested by Rood et al. (1993), S97 excluded that these could be due to an age or metallicity dispersion. Also merging events can be excluded (Catelan et al. 1998; S97). No other plausible explanations for the observed HB have been found, yet.
The discovery of the peculiar HB in NGC 2808 is part of a long term program aimed at identifying anomalous stellar populations in the cores of GGCs (Piotto et al. 1999). As groundbased followup, we are also carrying out a project for a wide field mapping of the envelopes of the clusters observed with . It has been often suggested that dynamical interactions in dense clusters could modify their stellar populations (Djorgovski & Piotto 1993; Fusi Pecci et al. 1993). A combination of the high resolution images in the densest inner region of a GGC with the wide field frames of the outer parts allows a direct test of this hypothesis. In this respect, the extreme properties of NGC 2808 offer a unique opportunity. Surely it is of interest to see whether the HB maintains its morphology also in the outskirts of the cluster.
In this paper we present wide-field stellar photometry in of the entire cluster, extending beyond its tidal radius. While we were working to this project, a wide field CMD diagram of NGC 2808 has also been published by W99. Our study complements the W99 work, extending the photometry to stars in outer regions, and to the and bands. A list of the main cluster parameters can be found in Table 1.
2 Observations and reduction
2.1 The data set
NGC 2808 has been observed in the bands in January 1998 with DFOSC mounted on the 1.54 ESO- telescope at La Silla. DFOSC was equipped with a 2048 2048 thinned LORAL CCD, with a pixel scale of 0.39′′/pixel. An area of arcmin2 (Fig.1) has been mapped in with a set of 9 partially overlapping fields. We took two and two exposures per field (50, 1800s in , and 25, 900s in ), plus an additional 25s exposure in for calibration purposes. An additional 12.912.9 field centered on the center of NGC 2808 has been covered with s in , s in , 420s in , and 25s in . Due to the combined effects of seeing and charge bleeding, stellar images had a FWHM around 1.5 arcsec in all the images, but the nights were all photometric.
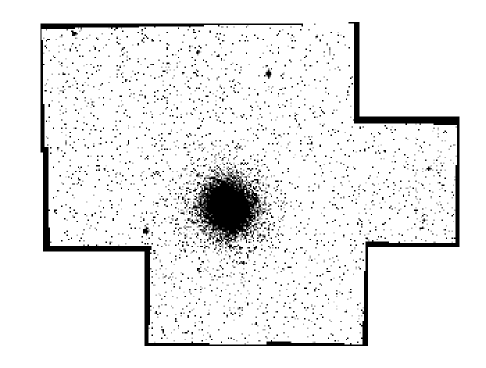
NGC 2808 has also been observed in the bands in March 1995 with EMMI mounted on the ESO- telescope. An area of arcmin2 (Fig.2) has been covered with a mosaic of twelve arcmin2 partially overlapping fields. For each field we obtained one 25s exposure both in and . An additional field centered at arcmin from the cluster center has been covered with exposures of in in . The seeing was stable and around 0.9 arcsec (FWHM), but the night was not photometric.
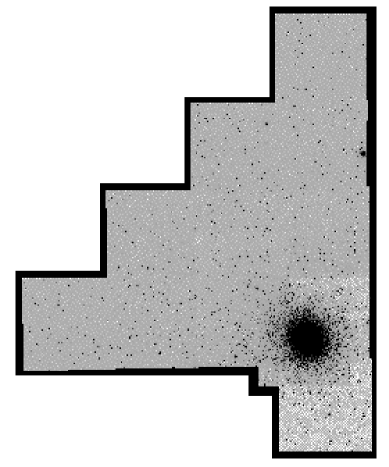
Finally, we also re-reduced the F439W and F555W WFPC2 images used by S97 in their investigation. In this case, the total exposure time was 510s and 57s in F439W and F555W bands, respectively. As the PC camera was approximately centered on the center of NGC 2808, the WFPC2 data allow us to investigate the inner arcsec of the cluster, while the groundbased mosaics extend to , where is the tidal radius (, Table 1).
2.2 Data reduction
All the groundbased images have been pre-processed in the standard way with IRAF, using the sets of bias and sky flat-field images collected during the observing nights. The PSFs have been obtained with the standard routines in DAOPHOT II (Stetson 1987), while we used ALLFRAME (Stetson 1994) on all the images for the actual PSF-fitting photometry. The data have been reduced again (after S97). In S97, for the stellar photometry, they used ALLSTAR (Stetson 1993) and a set of PSFs derived directly from the single NGC 2808 images. Here, we used ALLFRAME on a new list obtained from a median image of all frames (Stetson 1994). The new reduction allowed us to extend the photometry from the data by magnitude fainter than in S97. This is an important improvement, in particular for the determination of the faintest limit of the EBT (cf. Sect. 5).
2.3 Calibration to a standard photometric system
Particular care has been devoted to link the instrumental magnitudes (from both the groundbased and data) to a photometric standard system.
2.3.1 Groundbased data
Only the nights at the telescope were photometric. In order to obtain the transformation equations relating the instrumental () magnitudes to the standard (Johnson), (Kron-Cousins) system, six Landolt (Landolt 1992) fields of standards have been observed. Specifically: the selected areas 95, 98, and the Rubin 149, PG0918+029, PG1047+003, and PG1323-086 fields. In each of these, there are other secondary standard stars by Stetson Stetson (2000) which extend the previous Landolt sequence to 90, 618, 147, 80, 45, and 63 standards, respectively, for each field. Moreover, 34 stars in the field of NGC 2808 from Harris (Harris 1978) and 19 from Walker111 Note that we used the correct stars listed in erratum of Walker Walker (2000). (W99) were used as additional photometric standards for this calibration. For all 1096 of these stars aperture photometry was obtained on all the images after the digital subtraction of neighboring objects from the frames. Most importantly, these standard stars cover the color interval: . We used DAOGROW (Stetson 1990) to obtain the aperture growth curve for every frame and other related codes (by PBS) to determine the aperture corrections, the transformation coefficients, and the final calibrated photometry (e.g., Stetson 1993). We used transformation equations of the form
Second order color terms were tried and turned out to be negligible in comparison to their uncertainties in all four filters. It is a reasonable hypothesis that the color-dependent terms imposed by the telescope, filter, and detector should be reasonably constant over the course of a few nights, so after , , and had been independently determined from each night’s data, we obtained weighted mean values of these parameters and imposed them as fixed quantities for the definitive calibration; note that we had only one night of observations in band. The NGC 2808 images enabled us to define 1690 local standards that met the following conditions: each was well separated from its neighbors (according to a criterion described in Stetson Stetson (1993) Sect. 4.1), each was observed at least eight times, each had a standard error of the mean magnitude (averaged over all filters) less than 0.01 mag, each had a mean instrumental magnitude less than 14.5 (again averaged over all filters), each had a mean value of the goodness-of-fit statistic, CHI, less than 2, and each had a mean value of the image-shape statistics, SHARP, between and . Once calibrated, this local standard sequence enables us to place each of the photometric and nonphotometric observations of NGC 2808 at the telescope on the same magnitude system with an uncertainty of magnitudes for , for , for and for (typical uncertainty in the relative zero point of one frame as referred to the average of all frames). In a similar way, the data have been calibrated to the average photometric system above defined with an uncertainty of 0.003 magnitudes in and 0.004 magnitude in .
2.3.2 calibration
Calibration of the data of S97 — even updated with the most recent Charge Transfert Efficiency correction by Wiggs et al. Wiggs et al. (1997) — shows a strong disagreement (cf. Fig.7) with our and previous W99 photometry, being almost 0.1 mag bluer in than the ground-based results. Therefore, to obtain a calibration as homogeneus as possible between the two samples, the data have been calibrated by comparing the magnitudes of a number of convenient common stars to the ground-based data producing a linear transformation between data and data. These comparison stars had to satisfy the following criteria: each had at least a radial distance of arcsec from the estimated position of the center of the cluster, each had a magnitude brighter than 18.00 in , each had a ground-based error less than 0.20 in , and each had an error less than 0.05 in . Among these a - clipping procedure were followed to choose the best mean magnitude difference based on 164 stars in and 115 in .
After this procedure, the and magnitudes for the data were linked to the groundbased system previously defined with an uncertainty of 0.003 magnitudes in both the two bands.
3 The Color Magnitude Diagrams
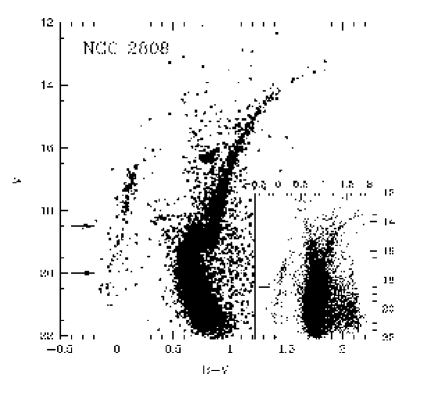
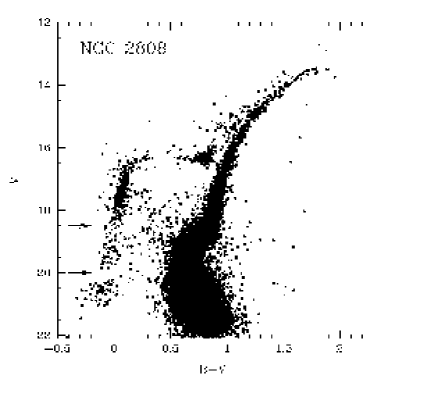
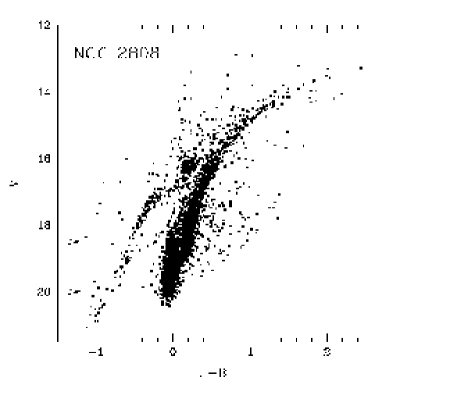
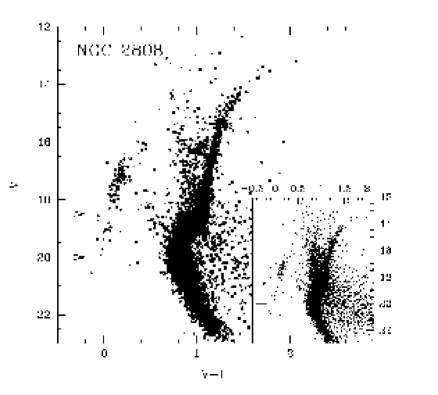
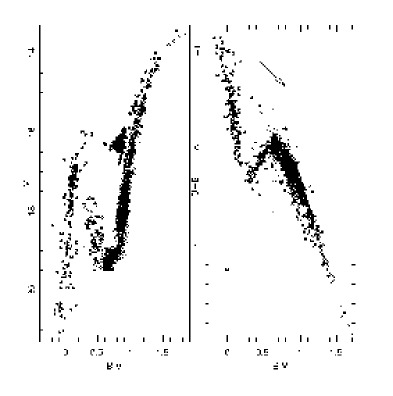
The CMDs derived from the photometry of about 60,000 stars discussed in the previous section are presented in Figs. 36. This is the most complete photometry of the NGC 2808 stellar population published so far. It complements the CMDs presented by S97 and W99 both by extending the radial coverage to the tidal radius (and beyond) and by adding the and photometry. The vs. () CMDs are presented in Fig. 3 (groundbased data), and Fig. 4 ( data). The larger CMD in Fig. 3 shows the stars with arcsec, while the CMD in the inset shows all the 30,000 stars with arcsec and a photometric error 0.05. Note how the CMD of Fig. 4 goes magnitude fainter than in S97, enabling us to cover the entire HB even in the very inner regions ( arcsec). The groundbased and the data have similar limiting magnitudes at . Fig. 5 shows the CMD in the vs. () plane ( data only), while Fig. 6 shows the vs. () diagram (from the combination of the and data). The two diagrams of Fig. 6 refer to the same annuli defined in Fig. 3. The CMDs of Figs. 36 clearly show both the extended HB tails and the gaps along the HB. As indicated by the arrows, the gaps are still present in the outer fields (cf. discussion in Sect. 5). Also the blue straggler (BS) sequence is clearly defined. The BS sequence seems to be more extended in magnitude in the inner field (Fig. 4) than in the outer fields (Fig. 3). In the groundbased data there is a strong contamination by field stars, as expected from the low galactic latitude of NGC 2808 (Table 1). As discussed by W99, there is also some differential reddening in the direction of this cluster: in Figs. 36, and in the following, we did not apply any differential reddening correction.
3.1 Comparison with previous work
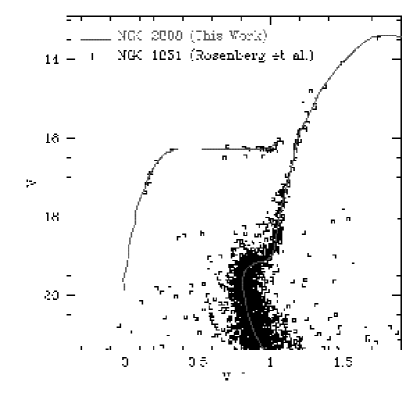
The peculiar HB of NGC 2808 has called the attention of many investigators in the past. The most complete CCD vs. () CMDs have been published by Ferraro et al. Ferraro et al. (1990)(F90), S97, W99. The hand drawn fiducial lines (on the original data) for the CMDs of S97, W99, and Fig. 3, and the fiducials given by F90 are compared in Fig. 7 (upper panel). We must note that the broadening of the sequences due to the differential reddening makes the task of determining the fiducial lines quite difficult. An uncertainty of the order of at least magnitudes must be associated with the fiducial points discussed below. First of all, we note a general agreement with the photometry of W99 from the MS to the RGB tip. A shift by 0.02 magnitudes (most likely due to differential reddening) would make the two fiducial lines overlap, except only for the brightest part of the RGB and the faint part of the HB, where it is quite hard to get accurate fiducials because of the small number of stars. In any case, a small color term error at these extreme colors cannot be excluded. In this regard, we note that while the color coverage of the standards used by W99 was (), our calibration is based on a much larger number of standards with () (cf. Sect. 3.1). As expected from the general agreement with W99, Fig. 7 confirms that the photometries of S97 and F90 are affected by both scale and zero point errors (cf. W99 for more details). As already discussed in the previous section, in view of the problems in calibrating the data of S97, in the present paper we have linked the magnitudes directly to the more robust groundbased system. Fig. 7 (lower panel) compares the fiducial lines of Fig. 6 with the CMD from Rosenberg et al. Rosenberg et al. (2000). There is a general agreement between the two sets of photometry, with a possible small ( magnitudes) zero point difference in color, which is likely due to differential reddening.

4 Reddening, distance, metallicity
As discussed in W99, the reddening of NGC 2808 is very uncertain. Surely, some of the discrepancies among the different values in the literature are due to the effects of the differential reddening. Also on the value of differential reddening there is no general agreement. We have estimated the differential reddening in the region from the cluster center to arcsec by comparing the dispersion of the RGB for and the dispersion due to the photometric errors calculated using the artificial star tests. The resulting differential reddening is 0.02 magnitudes.
In Sect. 4.1, we will adopt a new and original method to get the reddening of NGC 2808, following the analysis of the RGB morphology in the vs. () plane presented in Saviane & Rosenberg (1999) and Saviane et al. Saviane et al. (2000). In the following, we will make use of a CMD obtained from the stars in an annulus centered on the cluster center and covering a radial interval arcsec. The reddening that we will obtain must be considered as the average reddening within this annulus. As discussed below, for a proper use of the method described by Saviane et al. Saviane et al. (2000) (hereafter S00) for the reddening estimate, we will have to assume a metallicity for NGC 2808. To be consistent with S00, we will adopt the metallicities given by Rutledge et al. Rutledge et al. (1997)(RHS97), i.e. [Fe/H]= on the Carretta & Gratton Carretta & Gratton (1997)(CG) scale, as extended by Cohen et al Cohen et al. (1999), and [Fe/H] on the Zinn & West Zinn & West (1984)(ZW) scale.
4.1 Reddening and distance from the RGB stars
In S00 we used our photometric V, I database of GGCs (Rosenberg et al. 2000) to define a grid of fiducial RGBs, which was then used to find a monoparametric description of the red giant branches. The adopted fitting function is , where and are the absolute magnitude and dereddened color and each coefficient is a second-order polynomial in [Fe/H], i.e. , etc. (the coefficients are listed in Tab. 5 of S00). The calculations were repeated for two distance scales and two metallicity scales (CG and ZW). The formula can now be inverted in order to express [Fe/H] in terms of and . Trivial algebra yields:
where:
Solving the quadratic equation, one finds
| (1) |
Where, as usually, . The other root of the equation has no physical meaning. In this way, it is straightforward to calculated the metallicity for any RGB star, provided that the distance modulus and reddening are known. Once the correct combination of reddening and distance modulus are used, in the [Fe/H] vs plane (Fig. 8), one expects a vertical distribution, centered on the mean cluster metallicity, with a dispersion which is related to the actual color dispersion in the original CMD. The left panel of Fig. 8 shows the [Fe/H] vs diagram obtained from Eq. (1), based on an apparent distance modulus and a reddening from the updated on-line catalog of Harris (June 1999 revision). It is evident that the RGB is not vertical. The situation improves using the proposed by W99 (Fig. 8, central panel), but still we need to search for a better combination of parameters by exploring a possible range of reddenings and distance moduli.

|

|

|
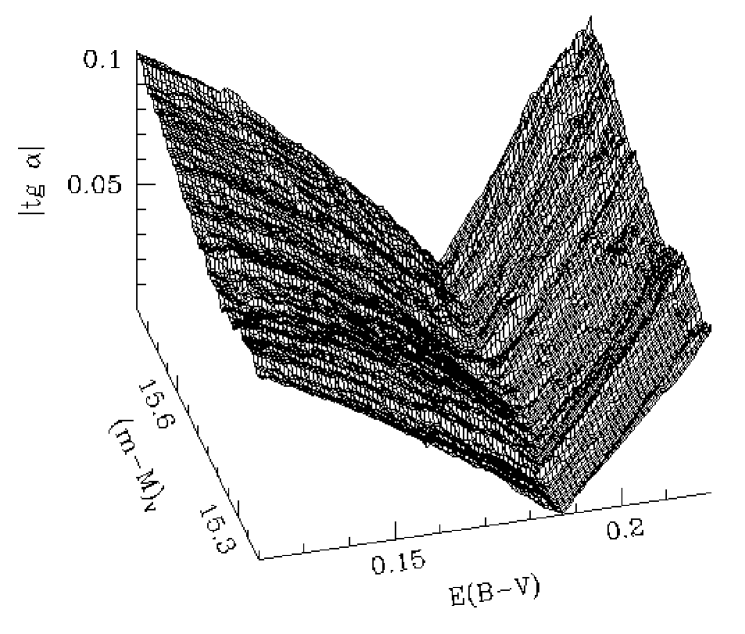
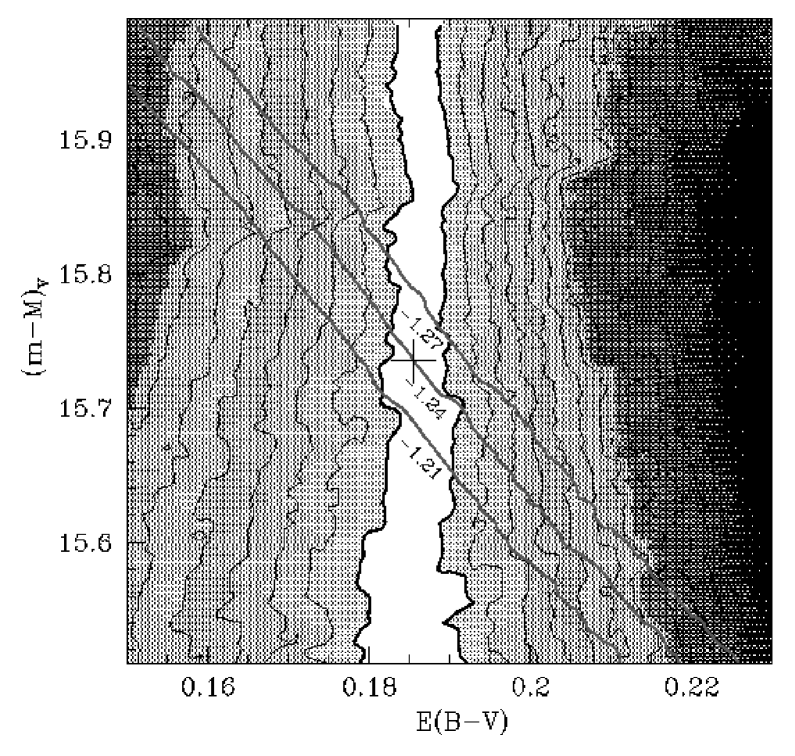
In order to have a quantitative measure of the best reddening and distance modulus, we used the slope of the linear fit of RGB stars, , in the absolute magnitude-metallicity plane. The dispersion in [Fe/H] around the mean value, in the same plane, was also used; this parameter yields a result consistent with that obtained from , though with a lower “resolution”. The values of were computed for a discrete range of and (with steps of 0.001 in color and 0.005 in distance modulus). The values were obtained using the relation Dean et al. (1978). We started our calculations on the CG metallicity scale, and adopting the Carretta et al. Carretta & Gratton (1999) distance scale (S00). On this distance scale, the HB luminosity - metallicity relation is . The value of as a function of the reddening and distance modulus is plotted in Fig. 9 as a 3d surface (left panel), and contour map (right panel). Clearly, the best reddening is well defined by a valley of minimum values of , centered at 0.185. In order to constrain also the distance modulus, we need to assume a metallicity. In Fig. 9 (right panel), the inclined heavy lines connect the points of the reddening-distance grid corresponding to a mean metallicity (as calculated from Eq. (1)) [Fe/H]= (central line) (the two lateral lines). The almost vertical heavy lines show the 1 standard deviation from the minimum value of , and can be used to quantify the uncertainty on the reddening. Fig. 9 shows that there is only a small allowed region for and , in order to have the mean metallicity from Eq. (1) consistent with the adopted [Fe/H] value. In conclusion, a self consistent set of distance, reddening and metallicity values is obtained only adopting , , (internal errors) and assuming the RHS97 metallicity on the CG scale. The error on the apparent distance modulus was obtained as 1/2 the permitted range in Fig. 9 (right panel). The corresponding vs. [Fe/H] diagram is shown in Fig. 8 (right panel). The procedure was repeated for the ZW metallicity scale, obtaining a slightly lower , and (internal errors), still consistent with the previous determination within the errors.
|
|
4.2 Comparison with NGC 1851
An independent check on the reddening and distance obtained above was carried out by comparing the CMDs of NGC 2808 and NGC 1851. For NGC 1851, we used the CMD of Rosenberg et al. Rosenberg et al. (2000), whose photometry is consistent with the present work, as shown in Fig. 7 (lower panel). Moreover, according to RHS97, the two clusters have the same metallicity within 0.08 dex (CG scale), with NGC 1851 more metal rich than NGC 2808, and both clusters have a bimodal HB. NGC 1851 has a low, fairly well determined reddening = 0.02 (Saviane et al. 1998). The NGC 2808 fiducials (solid lines) and the CMD of NGC 1851 (open squares) are overplotted in Fig. 10. The best match is obtained by applying a shift of in magnitude, and in color to the NGC 1851 diagram. The corresponding shift in would be , which implies . This value being consistent with the previous determination. To be consistent with the distance modulus determined in the previous section, we have to adopt the same distance scale, i.e. the scale of Carretta et al. Carretta & Gratton (1999), based on the relation
for the absolute magnitude of the ZAHB. Adopting [Fe/H] for NGC 1851 we have . Walker Walker (1998) finds , while Zoccali et al. Zoccali et al. (1999) give . Adopting a for NGC 1851, we have an apparent distance modulus for this cluster. On the other side, NGC 1851 is 0.1 dex more metal rich than NGC 2808, and therefore it has a 0.02 magnitudes fainter HB. In summary, we have = (ZAHB) = = , where the error accounts for all the error sources.
A similar approach to estimate the reddening of NGC 2808 has been followed by W99, who used as template RGB or HB sequences the CMDs of three well-studied clusters (NGC 6362, NGC 1851, and NGC 6229) having similar metallicities. His best final value for the reddening is , but he also notices that the shape of the RGB would suggest a slightly lower reddening and higher metallicity. We now have been able to show that the RGB morphology does suggest a lower reddening (, depending on the metallicity scale), still compatible with the spectroscopic value of [Fe/H].
4.3 Comparison with theoretical models
The comparison between theoretical predictions and multiband photometric data collected for NGC 2808 allows us to supply independent estimates of both reddening and distance modulus. A similar approach has been used also by S97 who present a detailed comparison between ZAHB models (Dorman et al. 1993) and observations. However, their main conclusions concerning the reddening and the distance modulus were hampered by the problems already mentioned in the zero-point of the photometric calibration and in the transformation of theoretical predictions into the observational plane.
First, we will start with the classical two-color diagram of Fig. 11, to constrain the cluster reddening, since it does not depend on the distance modulus. In particular, we will focus our attention on the HB stars, because their distribution in this plane is strongly affected by reddening (Fig. 11).

Fig. 12 shows the comparison in the plane between the Danish sample and the theoretical prescriptions about the ZAHB locus for Z=0.001 and an initial helium content equal to Y=0.23 (Cassisi et al. 1999). The ZAHB models correspond to a RGB progenitor with mass equal to , whose He core mass at the He ignition and surface He abundance after the first dredge up, are equal to and , respectively. The minimum stellar mass plotted in Fig. 12 is equal to ; with an effective temperature K lower than the one corresponding to the He Main Sequence.
Bolometric magnitudes and effective temperatures were transformed into the observational plane by adopting the bolometric corrections and the color-temperature relations provided by Castelli et al. Castelli et al. (1997a, b). By adopting the extinction curve by Cardelli et al. Cardelli et al. (1989), we obtain a plausible fit (Fig. 12) between theory and observations only by assuming (solid line).
Once the reddening value is secured, we can estimate the distance modulus of NGC 2808 by comparing the theoretical ZAHB and the observed HB stars in the CMD.

Fig. 13 shows that the models fit both the blue and red HB stars if we assume a distance modulus equal to (fitting errors only). Both the reddening value and the distance modulus we derived by comparing theory and observations are, within current uncertainties, in fair agreement with the independent estimates we obtained in the previous sections.
As a consequence, in the following we will adopt a reddening value of (to take into account the differential reddening), and an apparent distance modulus (internal error) (due to the differential reddening).
5 The Horizontal Branch morphology
We have already discussed how the HB peculiarities possibly make NGC 2808 a unique test case for understanding the formation and evolution of the HB stars. In this section, we will make use of our large sample to better define the stellar distribution along the HB and the spatial distribution of HB stars characterized by different effective tempertatures.
All the CMDs of Figs. 36 clearly show the EBT. In general, as a consequence of the photometric errors, the EBT tends to become more and more dispersed toward fainter magnitudes, though some intrinsic dispersion (at a level of magnitudes (after the subtraction of the contribution by the photometric error and the differential reddening)) cannot be excluded. By using our evolutionary models for He-burning structures we have verified that the spread present in Fig. 13, is mainly due to evolutionary effects.
Both the CMD for the inner 100 arcsec (Fig. 4) and those for the outer regions (e.g. Fig. 3) show that the EBT extends to =21.2, confirming the results of W99. The EBT extends by more than one magnitude in when moving from low to high-temperatures. The HB presents two well-defined gaps along the blue tail, and even though a sizable fraction of HB stars lie on both the red and blue side of the instability strip, the region in between is poorly populated, and indeed only two RR Lyrae have been currently identified (Clement & Hazen 1989). Interestingly enough, the three gaps are also present in both in the inner and outer regions, showing that they are not confined to the inner core. This empirical evidence is worth being investigated in more detail, because it could be crucial to finding out the origin of these features.
5.1 The HB -jump
In the previous section, we have already presented a comparison between the observed HB and the models by Cassisi et al. Cassisi et al. (1999) in the and planes for an independent reddening and distance determination. Note that theoretical predictions properly account for the ZAHB distribution of both cool and hot HB stars (see Fig. 12 and Fig. 13).

On the basis of accurate Strömgren photometric data, Grundahl Grundahl et al. (1998) and Grundahl et al. Grundahl et al. (1999) found that all GGCs with a sizable fraction of hot HB stars present a well-defined jump in the band among blue HB stars. In particular, they succeeded in demonstrating that in the plane HB stars characterized by effective temperatures ranging from 11,500 to 20,000 K are brighter and/or hotter than canonical HB models. This effect was explained as an increase in the abundance of elements heavier than carbon and nitrogen caused by radiation levitation. The overall scenario was soundly confirmed by high-resolution spectroscopic measurements (Behr et al. 2000a; Behr et al. 2000b). Owing to the good accuracy of our ground based photometric data and the large sample of HB stars we decided to test whether a similar effect is also present in the canonical plane. Fig. 14 shows quite clearly the appearance of a -jump among HB stars hotter than , thus suggesting that this effect can also be detected in the canonical band. This finding is not surprising, since a detailed check of Fig. 7 in Grundahl et al. Grundahl et al. (1999) shows that the emergent flux in the and in the bands are quite similar for K. If we assume that the jump takes place at the HB stars start to be affected by radiation levitation at effective temperatures of the order of K, in very good agreement with the results by Grundahl et al. (1999). This also confirms the spectroscopic results by Behr et al. (2000a, and reference therein) suggesting that the bulk of the HB stars hotter than 10,000 K present strong heavy element enhancements. Even though color-temperature transformations are still affected by systematic uncertainties in the short wavelength region, this finding brings out the evidence that the effects of radiation levitation and elemental diffusion in blue HB stars can also be investigated in the band.
5.2 Statistical significance of the gaps
As discussed in Catelan et al. Catelan et al. (1998), assessing the statistical significance of the gaps along the EBTs is not a trivial task. Following the discussion in Piotto et al. Piotto et al. (1999), taking advantage of the fact that the EBT runs almost parallel to the -magnitude axes, we have constructed a histogram of the EBT star distribution in -magnitude. Fig. 15 shows this histogram for the 497 stars on the EBT with and a photometric error 0.05. These stars have been extracted from the CMDs of Fig. 4 ( arcsec) and Fig. 3 ( arcsec). Confirming the visual impression from the CMDs, Fig. 15 shows a gap at (hereafter G1) and a second one (G2) at . From a comparison with the models (Fig. 13), G1 is located on the HB in a position corresponding to a , while G2 is at . The corresponding masses are 0.57 and 0.52 respectively. Judging from the error bars (Poisson errors) of the histogram, we can confirm the results of S97 on the significance of these gaps.

We can also follow a different approach (Catelan et al. 1998). In the simplest hypothesis, assuming a uniform distribution in of the stars along the EBT, we can calculate the probability of having a gap at a given position. Using Eq. 2 of Catelan et al. (1998), we find: = for G1 and = for G2. This is the probability of having a gap exactly at the position of G1 and G2 from a uniform distribution. Indeed, we are interested to see what is the probability to have a gap on the EBT, not a gap at a given position on the EBT. Using Eq. (3) in Catelan et al. (1998) we have that the probability of finding a gap at any position on the HB of Fig. 15 is still for G1 and for G2.
In conclusion, if the distribution in of the stars along the EBT is uniform, the probability of finding even only one of the gaps G1 and G2 is negligible. This would imply that these gaps must be real in some physical sense, and not a statistical fluctuation. However, we do not know if the null hypothesis of a uniform distribution is correct. Indeed, looking at the distribution of the stars in Fig. 15, and in the other GGCs with EBTs (Fig. 9 in Piotto et al. 1999, see also Catelan et al. 1998), it seems that the stellar distribution might be not uniform at all. Still, the fact that all the clusters with an EBT show gaps along it, and that some of these gaps seem to be located at very similar positions (either in temperature or mass) on the HBs of different clusters (Piotto et al. 1999), might be suggestive of a genuine physical mechanism for producing gaps. A physical origin is furtherly strenghtened by the empirical results by Behr et al. (2000a) and Behr et al. (2000b), who find a discontinuity both in the rotational velocity and in the abundance ratios of the stars at the level of the gap in the EBT of M13. Though there have been many attempts to explain the observed gaps (Catelan et al. 1998; Caloi 1999; D’Cruz et al. 1996; Rood et al. 1998; Soker 1998), we still lack a coherent and quantitative model which accounts for their origin.
5.3 Radial distribution of the HB stars
Fig. 16 shows the vs. () CMDs of NGC 2808 in six different radial bins. The contamination by field stars becomes rather strong in the outer fields, as expected from the location of the cluster in the Galaxy. According to Trager et al. Trager et al. (1993), the tidal radius of NGC 2808 is . Therefore, we expect all the stars in the bottom right panel of Fig. 16 to be field stars. The most interesting facts shown by Fig. 16 are that:
-
1.
the EBT is present surely beyond arcsec, corresponding to more than nine times the half mass radius , and it extends to also in these external regions;
-
2.
also the gaps on the EBT are present at least out to 400 arcsec from the cluster center, and possibly beyond it;
-
3.
the locations of the gaps in the CMD seem to be the same all over the cluster.
We have also checked the relative number of HB stars as a function of the radius. The HB stars have been divided into 4 groups (cf. Fig. 16): red clump (all the HB stars redder than the RR Lyrae instability strip); EBT1 (the HB stars bluer than the RR Lyrae instability strip, but brighter than the first gap G1); EBT2 (the HB stars within the two gaps); EBT3 (the HB stars fainter than the gap G2). The relative numbers of these stars (corrected for complitness) out to 400 arcsec are shown in Fig. 17. Overall, there is no statistically significant radial gradient. This is the most important observational evidence.
It must be noted that D’Cruz et al. (2000) and Whitney et al. (1998) found an absence of radial gradients in the distribution of the EBT stars in Cen, though in that case the investigation was extended only out to 0.3 tidal radii. We want to furtherly comment on two of the panels of Fig. 17. First of all, the bottom panel shows that the faintest (hottest) HB stars (group EBT3) seems to be less numerous in the outer bin ( arcsec). However, the small number of stars and the uncertainty on the completeness correction make this difference very marginal (at 2 sigma level). Second, the upper panel seems to show a marginal trend of the RGB222We consider RGB stars brighter than HB red clump, assumed . stars (a decreasing of RGB stars with respect to the EBT1 ones, moving outwards, up to arcsec), which is opposite to what has been found in the post core collapse333 Note, however, that NGC 2808 is a normal King model cluster. clusters M30 by Piotto et al. Piotto et al. (1988), as recently confirmed also by Howell & Guhathakurta Howell et al. (2000), and M15 by Stetson Stetson (1994). However, a possible population gradient like in the upper panel of Fig. 17 could explain the much more significant color gradient found by Sohn et al. Sohn et al. (1998) in NGC 2808, which goes in a sense of a redder center. Despite the fact that none of the gradients in Fig. 17 is statistically significant, they might still be real in some physical sense. Indeed, as throughly discussed by Djorgovski & Piotto Djorgovski & Piotto (1993) the color and population gradient issue in GGCs is always hampered by small number statistics and errors in the completeness corrections. What can make them significant is the occurence of similar gradients in a number of clusters. Before drawing any conclusion, we need to extend this investigation to other clusters with EBTs.

It has been suggested, and supported with observational evidences, that the HB blue tails and the EBTs might be of dynamical origin. For example, Fusi Pecci et al. Fusi Pecci et al. (1993) have found a correlation between the HB elongation and cluster central densities. Tidal stripping of the envelopes of the stars evolving along the RGB during close encounters in a high density environment can be a possibility (Djorgovski & Piotto 1993). Orbital angular momentum transfer to a RGB envelope in a close flyby which can favour enhanced mass loss or even deep mixing (Sweigart 1997) is another possibility. The difficulties in dealing with these hydrodynamical phenomena has prevented till now a modeling of the proposed mechanisms. Still, it is somehow surprising to see that EBT stars can be found in NGC 2808 at (middle bottom panel of Fig. 16), where the stellar densities are extremely low. Of course, we cannot completely exclude the possibility that the EBT stars have very elongated orbits, which bring them very close to the cluster center. However, the hypothesis of an high anisotropy for the GC stellar orbits is still to be proved. Another possibility is that the same mechanism responsible for the envelope stripping can cause a kick off from the cluster core of some of the involved stars. In any case, the absence of any clear gradient in the radial distribution of the EBT stars can again be a major obstacle for this mechanism. Alternatively, since most of the close encounters will take place within the dense core of the cluster, one could expect the EBT stars to be more centrally concentrated than the red HB stars. This is not confirmed by Fig. 17, with a possible exception of the extreme EBT3 stars, but only for arcsec, i.e. . Of course, it is possible that dynamical relaxation causes the encounter products to quickly diffuse out, smoothing their radial distribution. However, we find EBT stars well beyond the half mass radius, while already the half mass relaxation time ( yr, Tab. 1) is sensibly longer than the evolutionary time on the HB ( yr). The absence of gradients exclude also the possibility that EBT stars are formed from tidal stripping in close binaries (Bailyn & Pinsonneault 1995), as, also in this case, we would expect to see more EBT stars in the cluster core, where the more massive binaries would concentrate, than in the outer envelope.
In conclusion, we still lack an explanation of the EBT in NGC 2808, and other clusters. The observational facts presented in this paper seem to make rather unlikely a possible dynamical origin of the phenomenon. And it is not clear whether the presence of EBTs and gaps on them are the manifestation of the same physical phenomenon.
6 The Luminosity Function
As clearly shown by Fig. 16, the contamination by field stars obviously becomes stronger and stronger for increasing : the inner CMDs from the data are virtually not affected by this problem, which becomes severe for arcsec. In order to obtain a LF from the groundbased data, we need to statistically subtract the field stars. As our coverage of NGC 2808 extends far beyond the tidal radius, in principle this is not a problem, though we must not forget that the presence of the differential reddening will limit the accuracy of any attempt to statistically subtract field stars. The subtraction of the field objects has been performed on the CMD, and on the vs. () CMD in the region arcsec. For , the small number of cluster stars and the large number of field objects makes the data of no use for the LF.
For the data, the number of subtracted stars is negligible (we subtracted 74 stars out of 35,000 objects).
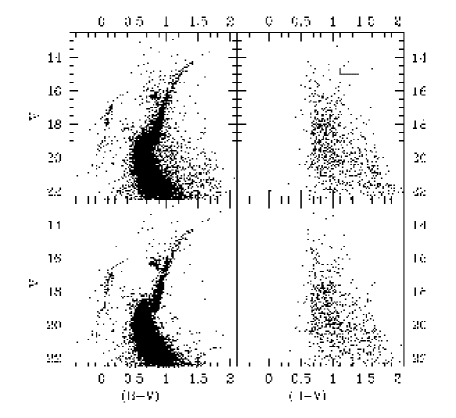
The results of the field subtraction on the data are illustrated in Fig. 18. The original CMD is plotted in the upper-left panel. The upper-right panel shows the template field star CMD, which refers to an area located on the North-West side of the cluster, at , and of the same size as the area covered by the stars in the upper-left panel. In the cluster CMD, for each field star we removed the star closest in magnitude and color. The resulting field-subtracted cluster CMD, and the CMD with the subtracted stars only are shown in the two bottom panels.
The LF has been obtained from the field-subtracted CMD, excluding the contribution of the blue stragglers, HB, and AGB stars. A detailed discussion of the LF in a large sample of globular cluster, including NGC 2808, from the tip of the RGB to a few magnitudes below the TO, and a comparison with the models, has been presented in Zoccali & Piotto (2000). Here we focus our attention on the brightest part of the LF (Fig. 19, left panel). In particular, we note that on both the and LFs there are two features: the well defined RGB bump, at , and at magnitudes brighter a second bump (that we will call heap hereafter), at V14.9. The heap is more clearly visible in the data, where the contamination by field stars is negligible.
The bump is a well known feature, due to the hydrogen burning shell approaching the composition discontinuity left by the deepest penetration of the convective envelope. Bump properties are thoroughly discussed in Zoccali et al. Zoccali et al. (1999) and Zoccali & Piotto Zoccali & Piotto (2000). On the basis of the differential LF it is not possible to assess whether the heap is a real feature or more simply a statistical fluctuation. Indeed, also at magnitudes fainter than the bump the LF presents other secondary peaks.
In order to shed more light on this problem, in Fig. 19 we show also the cumulative logarithmic LF (middle panel), since a local increase in the number of stars causes a change in its slope. The two slopes which fit the integral LF at magnitudes fainter/brighter than further support the evidence that there is a real feature. Note that the heap is also present in the LF in the band, at . We are not aware of any previous detection of this heap. However, an indication of the presence of the heap is also present in the data by W99.
The physical nature of the heap can not be firmly constrained on the basis of the present data alone. This notwithstanding, in the following we supply some hints which can help to disclose the physical mechanisms which might cause it. First of all, we exclude the interpretation that heap is a consequence of the contamination by field stars, since it is located in a region of the CMD which is marginally affected by this problem (cf. small box in the upper-left panel of Fig. 18). Similarly, it cannot be due to contamination by AGB stars, since, at this magnitude, AGB and RGB stars are well separated, and also because the expected ratio between AGB and RGB stars at Z=0.001 is of the order of .
The heap could be explained by assuming that it is the aftermath of a deep-mixing episode which somehow causes a temporary delay in the advancement of the H-shell. Even though this phenomenon has been suggested for explaining peculiar metallicity overabundances in several cluster RGB stars (Gratton et al. 2000) and some intrinsic features of the extreme HB stars (Sweigart 1997; Sweigart & Catelan 1998) the physical mechanisms which trigger its appearance are still questioned and widely debated in the current literature (Grundahl et al. 1999, and references therein). However, taking into account the number of stars in the heap region (in the data, where the contamination by field stars is negligible), if we assume as working hypothesis that the heap is caused by a deep mixing episode, then its occurrence would imply an increase in the evolutionary time during this phase of the order of 25% when compared with the canonical one.
As a consequence, we decided to test whether the heap is a unique feature of NGC 2808 or is present in other GGCs. We selected 47 Tuc, since for this cluster we can use a homogeneous set of data reduced by the same software, and find heap at the same position above the bump (), and it is located, within the uncertainties, in the same region of the 47 Tuc RGB in which Edmonds & Gilliland Edmonds & Gilliland (1996), on the basis of time series data, discovered for the first time K giant variables (KGVs) in a GGC. In fact, the clumping of KGVs they found is located at , which is in remarkable agreement with the heap absolute magnitude, i.e. . The same outcome applies to the color, and indeed the bulk of KGVs in 47 Tuc are located at colors ranging from 1.1 to 1.2 (see Fig. 1 in Edmonds & Gilliland), which are quite similar to the color range covered by the heap. Unfortunately, our data do not allow us to identify any variability, since KGVs are characterized by low luminosity amplitudes, and by short periods Edmonds et al. (1999).

|

|

|
It is also worth noting that the heap stars, as the KGVs, are not centrally concentrated, and indeed the heap appears both in the and in the sample. If the hypothesis of a link between the heap and the KGVs is confirmed by detailed time series multiband photometric data, it could have a fundamental impact on our understanding of the physical nature of these intriguing objects. In fact, the appearance of the heap seems to suggest that KGVs spend a substantial portion of the pulsation cycle when they are cooler. Note that the change in the effective temperature to explain this effect should be approximately 100-150 K at the typical colors of heap stars. Moreover and even more importantly, if the heap is caused by KGVs, the results on NGC 2808 show that the physical mechanisms which trigger the pulsation destabilization in these objects are also present at intermediate metallicities. Finally, we mention that radial velocity variations have been detected and measured in several field, intermediate-mass K giant stars (Hatzes & Cochran Hatzes & Cochran (1999), and references therein). These objects often present mixed-mode behavior with periods ranging from a fraction of day ( Ophiuchi, Hatzes & Cochran Hatzes & Cochran (1994a)) to few days ( Bootis, Hatzes & Cochran Hatzes & Cochran (1994b)) or hundreds days ( Herculis, Hatzes & Cochran Hatzes & Cochran (1999)) and radial velocity amplitudes ranging from few tens of to hundreds of . This behavior was soundly confirmed by Buzasi et al. Buzasi et al. (2000) who detected and measured multimode oscillations in Ursae Majoris with a fundamental period of 6.35 days and an infrared luminosity amplitude of 390 mag.
The lack of a comprehensive pulsation scenario which accounts for the empirical behavior of these objects, and of firm constraints on the occurrence of an instability strip prompts for new theoretical and empirical investigations. In this context, it is noteworthy that in a recent investigation based on both Hipparcos and OGLE data, Koen & Laney Koen & Laney (2000) found evidence that pulsation in very high overtones seems to be the most plausible mechanism to explain the luminosity variation in field M giant stars with periods shorter than 10 days.
Acknowledgements.
We thank the referee, Dr. N. D’Cruz, for the careful reading of the manuscript and for the useful comments and suggestions which surely helped to improve the paper. We thank Dr. A. Walker for providing his data on NGC 2808 in a computer readable form. We acknowledge the financial support of the Ministero della Università e della Ricerca Scientifica e Tecnologica (MURST) under the program “Treatment of large field astronomical images” and by the Agenzia Spaziale Italiana. PBS gratefully acknowledges the generosity of the Università di Padova and the MURST for supporting his visit to the Dipartimento di Astronomia.References
- Bailyn & Pinsonneault (1995) Bailyn C. D., Pinsonneault M. H., 1995, ApJ 439, 705
- Behr et al. (2000a) Behr B. B., Cohen J. G., McCarthy J. K., 2000a, ApJ 531, L37
- Behr et al. (2000b) Behr B. B., Djorgovski S. G., Cohen J. G. et al., 2000b, ApJ 528, 849
- Buzasi et al. (2000) Buzasi D., Catanzarite J., Laher R. et al., 2000, ApJ 532, L133
- Caloi (1999) Caloi V., 1999, A&A 343, 904
- Cardelli et al. (1989) Cardelli J. A., Clayton G. C., Mathis J. S., 1989, ApJ 345, 245
- Carretta & Gratton (1997) Carretta E., Gratton R. G., 1997, A&AS 121, 95
- Carretta & Gratton (1999) Carretta E., Gratton R. G., 1999, ApJ in press - preprint, astro-ph/9902086v2
- Cassisi et al. (1999) Cassisi S., Castellani V., degl’Innocenti S., Salaris M., Weiss A., 1999, A&AS 134, 103
- Castelli et al. (1997a) Castelli F., Gratton R. G., Kurucz R. L., 1997a, A&A 324, 432
- Castelli et al. (1997b) Castelli F., Gratton R. G., Kurucz R. L., 1997b, A&A 318, 841
- Catelan (1997) Catelan M., 1997, ApJ 478, L99
- Catelan et al. (1998) Catelan M., Borissova J., Sweigart A. V., Spassova N., 1998, ApJ 494, 265
- Clement & Hazen (1989) Clement C., Hazen M., 1989, AJ 97, 414
- Cohen et al. (1999) Cohen J. G., Gratton R. G., Behr B. B., Carretta E., 1999, ApJ 523, 739
- D’Cruz et al. (1996) D’Cruz N. L., Dorman B., Rood R. T., O’Connell R. W., 1996, ApJ 466, 359
- D’Cruz et al. (2000) D’Cruz N. L., O’Connell R. W., Rood R. T. et al., 2000, ApJ 530, 352
- Dean et al. (1978) Dean J. F., Warren P. R., Cousins A. W. J., 1978, MNRAS 183, 569
- Djorgovski & Meylan (1993) Djorgovski S., 1993, in Structure and Dynamics of GlobularClusters, ASP Conf. Ser. 182, ed. S. G. Djorgovski & G. Meylan (San Francisco: ASP), p. 373
- Djorgovski & Piotto (1993) Djorgovski S., Piotto G., 1993, in ASP Conf. Ser. 48: The Globular Cluster-Galaxy Connection, p. 84
- Dorman et al. (1993) Dorman B., Rood R. T., O’Connell R. W., 1993, ApJ 419, 596
- Edmonds & Gilliland (1996) Edmonds P. D., Gilliland R. L., 1996, ApJ 464, L157
- Edmonds et al. (1999) Edmonds P. D., Gilliland R. L., Bailyn C. D. et al., 1999, in American Astronomical Society Meeting, Vol. 195, p. 7507
- Ferraro et al. (1990) Ferraro F. R., Clementini G., Fusi Pecci F., Buonanno R., Alcaino G., 1990, A&AS 84, 59 (F90)
- Ferraro et al. (1998) Ferraro F. R., Paltrinieri B., Fusi Pecci F., Rood R. T., Dorman B., 1998, ApJ 500, 311
- Fusi Pecci et al. (1993) Fusi Pecci F., Ferraro F. R., Bellazini M. et al., 1993, AJ 105, 1145
- Gratton et al. (2000) Gratton R. G., Sneden C., Carretta E., Bragaglia A., 2000, A&A 354, 169
- Grundahl et al. (1998) Grundahl F., Vandenberg D. A., Andersen M. I., 1998, ApJ 500, L179
- Grundahl et al. (1999) Grundahl F., Catelan M., Landsman W. B., Stetson P. B., Andersen M. I., 1999, ApJ 524, 242
- Harris (1974) Harris W. E., 1974, ApJ 192, L14
- Harris (1978) Harris W. E., 1978, PASP 90, 45
- Hatzes & Cochran (1994a) Hatzes A. P., Cochran W. D., 1994a, ApJ 432, 763
- Hatzes & Cochran (1994b) Hatzes A. P., Cochran W. D., 1994b, ApJ 422, 366
- Hatzes & Cochran (1999) Hatzes A. P., Cochran W. D., 1999, MNRAS 304, 109
- Howell et al. (2000) Howell J. H., Guhathakurta P., Tan A., 2000, AJ 119, 1259
- Koen & Laney (2000) Koen C., Laney D., 2000, MNRAS 311, 636
- Landolt (1992) Landolt A. U., 1992, AJ 104, 340
- Piotto et al. (1988) Piotto G., King I. R., Djorgovski S., 1988, AJ 96, 1918
- Piotto et al. (1999) Piotto G., Zoccali M., King I. R. et al., 1999, AJ 118, 1727
- Rood et al. (1993) Rood R. T., Crocker D. A., Fusi Pecci F., Ferraro F. R., Clementini G., Buonanno R., 1993, in ASP Conf. Ser. 48: The Globular Cluster-Galaxy Connection, p 218
- Rood et al. (1998) Rood R. T., Dorman B., Ferraro F. R., Paltrinieri B., Fusi Pecci F., 1998, in Ultraviolet Astrophysics Beyond the IUE Final Archive, p. 515
- Rosenberg et al. (2000) Rosenberg A., Piotto G., Saviane I., Aparicio A., 2000, submitted to A&AS
- Rutledge et al. (1997) Rutledge G. A., Hesser J. E., Stetson P. B., 1997, PASP 109, 907 (RHS97)
- Saviane et al. (1998) Saviane I., Piotto G., Fagotto F. et al., 1998, A&A 333, 479
- Saviane & A. (1999) Saviane I., Rosenberg A., 1999, in The Analytic Way to the Red Giant Branch - CMDs; Liège Int. Astroph. Coll. July 5-8, 1999
- Saviane et al. (2000) Saviane I., Rosenberg A., Piotto G., Aparicio A., 2000, submitted to A&A (S00)
- Sohn et al. (1998) Sohn Y. J., Byun Y. I., Yim H. S. et al, 1998, Journal of Astronomy & Space Sciences 15, 1
- Soker (1998) Soker N., 1998, AJ 116, 1308
- Sosin et al. (1997) Sosin C., Dorman B., Djorgovski S. G., et al., 1997, ApJ 480, L35 (S97)
- Stetson (1987) Stetson P. B., 1987, PASP 99, 191
- Stetson (1990) Stetson P. B., 1990, PASP 102, 932
- Stetson (1993) Stetson P. B., 1993, in Stellar photometry - Current techniques and future developments. Proceedings of the IAU Colloquium No. 136 held in Dublin; Ireland; 4-7 August 1992; Cambridge: Cambridge University Press; edited by C.J. Butler & I. Elliott, p.291
- Stetson (1994) Stetson P. B., 1994, PASP 106, 250
- Stetson (2000) Stetson P. B., 2000, submitted to PASP
- Sweigart (1997) Sweigart A. V., 1997, ApJ 474, L23
- Sweigart & Catelan (1998) Sweigart A. V., Catelan, M., 1998, ApJ 501, 63
- Trager et al. (1993) Trager S. C., Djorgovski S., King I. R., 1993, in ASP Conf. Ser. 50: Structure and Dynamics of Globular Clusters, p. 347
- Walker (1998) Walker A. R., 1998, AJ 116, 220
- Walker (1999) Walker A. R., 1999, AJ 118, 432 (W99)
- Walker (2000) Walker A. R., 2000, AJ 119, 1512
- Whitney et al. (1998) Whitney J. H., Rood R. T., O’Connell R. W. et al., 1998, ApJ 495, 284
- Wiggs et al. (1997) Wiggs M. S., Whitmore B., Heyer I., 1997, in The 1997 HST Calibration Workshop with a new generation of instruments /edited by S. Casertano, R. Jedrzejewski, C. D. Keyes, M. Stevens. Baltimore, MD : Space Telescope Science Institute (1997) QB 500.268 C35 1997, p. 398.
- Zinn & West (1984) Zinn R., West M. J., 1984, ApJS 55, 45
- Zoccali et al. (1999) Zoccali M., Cassisi S., Piotto G., Bono G., Salaris M., 1999, ApJ 518, L49
- Zoccali & Piotto (2000) Zoccali M., Piotto G., 2000, submitted to A&A