The HI mass function in Ursa Major
Abstract
A deep blind HI survey of the nearby spiral rich Ursa Major cluster has been performed with the VLA in parallel with a wide-field R-band imaging campaign of most VLA fields with the CFHT. The goal is to measure the slope of the HI mass function (HIMF) down to HI masses of 107M⊙ as well as the slope of the faint-end of the luminosity function (LF) down to M(R)=. The VLA survey sampled 16% of the Ursa Major cluster volume. Both the HIMF and the LF in Ursa Major are nearly flat at their faint-ends. No free-floating HI clouds were detected.
NRAO, P.O. Box O, Socorro, NM 87801, U.S.A.
Institute of Astronomy, Madingley Road, Cambridge CB3 0EZ, U.K.
Institute for Astronomy, 2680 Woodlawn Drive, Honolulu, HI 96822, U.S.A.
Kapteyn Institute, Postbus 800, 9700 AV, Groningen, The Netherlands
1. Motivation

The slope of the HI mass function (HIMF) at the low mass end is a much debated topic. It is related to the distribution of primordial density fluctuations and it helps constraining galaxy formation scenarios. In case a large undiscovered population of HI rich dwarf galaxies does exist, it may contain a non-negligible fraction of the baryon content of the universe and provide fuel for the star formation process in more massive disk galaxies through their capture, infall and accretion. Furthermore, the slope of the HIMF ties in directly with the recently launched hypothesis that the population of High Velocity Clouds (HVCs) as cataloged by Wakker & Van Woerden (1991), apparently associated with the Milky Way, might actually be of an extragalactic nature, being the primordial remnants of the formation of the Local Group (Blitz et al. 1999).
Despite its importance, the slope of the HIMF at the low-mass end has not been measured with any accuracy down to HI masses of 107M⊙. In general, the statistics in the M⊙ mass range are too poor, with typically 1 or 2 galaxies in the lowest HI mass bin. The Arecibo HI Strip Survey (AHISS) of Zwaan et al. (1997), still the deepest survey to date, indicates a slope in the range 1.1 to 1.3 with only 1 galaxy in the last bin. From the AHISS data, combined with an independent deep Arecibo Slice Survey, Schneider et al. (1998) claimed a sharp steepening of the HIMF below 108M⊙ with only 2 galaxies in the last bin. A first HIMF comprising 263 galaxies from the HIPASS project (Kilborn et al. 1999) shows a slope of 1.3 with only 3 galaxies in two bins below an HI mass of 108M⊙. At this meeting in Guanajuato, an updated slope of roughly 1.4 was reported from the HIPASS survey by Staveley-Smith and a slope as steep as 1.7 was suggested by Schneider from the new Arecibo Dual-Beam Survey (ADBS). It should be noted that the volume corrections of all these surveys are hampered by uncertain corrections for large scale structure in the Universe. These corrections should account for the fact that we are located in a local overdensity and that dwarf galaxies are more easily detected nearby than in the distant Universe, introducing a bias toward a steeper slope.
From all this one can conclude that the sensitivity of recent surveys is simply insufficient and deep observations of a well defined, significantly overdense region with field-like characteristics of its galaxy population are needed to obtain the required statistics. It was realized that the sensitivity of the VLA in its Dconfiguration in combination with the overdensity of the nearby spiral rich Ursa Major (UMa) cluster would provide sufficient detections per HI mass-bin down to 107M⊙ to reliably measure the slope of the HI mass function at the low-mass end. Furthermore, all galaxies in the UMa volume would be at the same distance, eliminating the effects of large scale structure along the depth of the survey. The VLA would also be sensitive enough to detect the UMa equivalent of the proposed Local Group population of extragalactic HVCs with typical HI masses of a few times 107M⊙, as initially suggested by Blitz et al. (1999).
2. The Ursa Major cluster
The Ursa Major cluster at a distance of 18 Mpc spans about 15 degrees on the sky and comprises some 79 Mpc3. It is a gravitationally bound overdensity located in the Supergalactic plane. However, it contains no ellipticals, just a dozen lenticulars and has a velocity dispersion of only 150 kms, which corresponds to a crossing time of roughly a Hubble time (Tully et al. 1996). Its morphological mix is similar to lower density field regions. This makes the Ursa Major region an especially suitable environment to study the low-mass end of the HIMF. For instance, if the slope of the HIMF would indeed be as steep as 1.7 as suggested by Schneider in this meeting, there would be about 2900 HI objects in the Ursa Major volume with HI masses above 107M⊙, based on the high-mass end of the HIMF of the 80 known cluster members.
3. The VLA blind HI survey
A VLA blind HI survey of the Ursa Major cluster and CFHT imaging of most of the VLA fields in the R-band with the wide-field camera has been performed. The optical campaign was aimed at measuring the faint end of the Luminosity Function (LF) while it would provide optical morphologies and luminosities of the HI detected dwarfs. In return, the HI detections could provide redshifts for the optically selected cluster candidates.
A cross-pattern of 2232 pointings was observed, with pointing centers separated by a primary beam FWHM as indicated in Figure 1. Both crowded and empty regions were sampled. Given the low velocity dispersion of the cluster, a 3.125 MHz bandwidth was sufficient to cover the entire velocity range with a resolution of 10.3 kms after Hanning smoothing. A 70 minutes integration time per pointing resulted in a rms noise of 0.79 mJybeam which corresponds to a minimum detectable HI mass of 5106M⊙ at 6-sigma at the beam centers at a resolution of 45′′ by 10 kms. The data were flagged and calibrated in AIPS, mosaiced and cleaned in MIRIAD and further analyzed in GIPSY. Within the mosaiced images about 16% of the entire cluster volume was sampled. Currently, the full North-South and half of the East-West strip is processed.
4. Volume corrections
Given the depth of the cluster and the primary beam attenuation of the VLA, galaxies with small HI masses and broad profiles can not be detected throughout the entire survey volume. Therefore, a simple 1/Vmax volume correction was applied where Vmax is the volume in which a dwarf galaxy with a particular HI mass MHI and line width W20 could have been detected. In an analytical approach, one can for each HI mass infer a line width according to an empirical HI mass-line width relation: W20=0.16M where W20 is the line width at 20% of peak flux . W20 relates to the FWHM V of a Gaussian profile according to W20=V. For a Gaussian profile, = W20 where =6 required for a detection and is the noise at velocity resolution R.
Detectability is maximized under optimal smoothing conditions (R=V) and the noise which corresponds to a situation of optimal velocity smoothing is calculated according = in which is the noise in the highest velocity resolution data. Under this formalism, a maximum distance Dmax at which an HI mass MHI can be detected is calculated according to
Of course, Dmax varies across the primary beam due to its attenuation characteristics which makes position dependent. Considering the near and far side of the cluster volume, Vmax can easily be calculated from Dmax and . This analytical approach is used to draw the solid line in Figure 2. Ultimately, 1/Vmax was calculated and applied for each individual galaxy using its measured HI mass and line width.
5. Results
The data cubes were smoothed in velocity to resolutions R of 20, 30, 40, 60 and 80 kms and at each velocity resolution, the noise was determined and a 6-sigma clip was applied to find the HI emission. In total 32 HI detections were made, all of them have an optical counterpart in the CFHT images. All 19 previously known cluster members within the imaged areas were detected, including all the S0 systems. Only 13 new objects were discovered in 16% of the UMa volume.
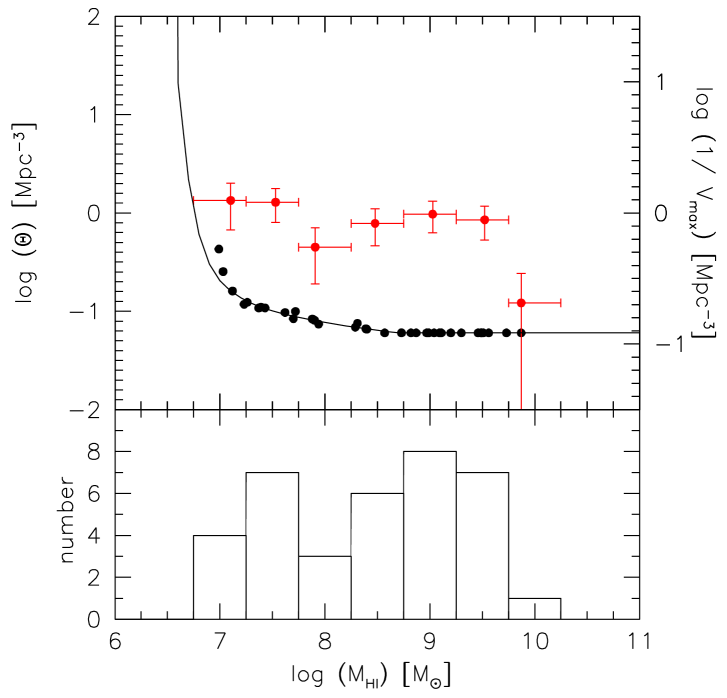
After applying volume corrections for the individual galaxies, the HIMF in Ursa Major as measured by the VLA is plotted in the upper panel of Figure 2. The analytical and idealized relation between MHI and Vmax is plotted as a solid line in the upper panel which shows that galaxies with MHI108.75M⊙ can be detected throughout the entire imaged volume while 1/Vmax becomes very large for galaxies with MHI107M⊙.
The HI mass function in Ursa Major turns out to be nearly flat with 4 galaxies in the lowest HI mass bin. In accordance with the HIMF, the LF from the CFHT data is also nearly flat () down to M(R).
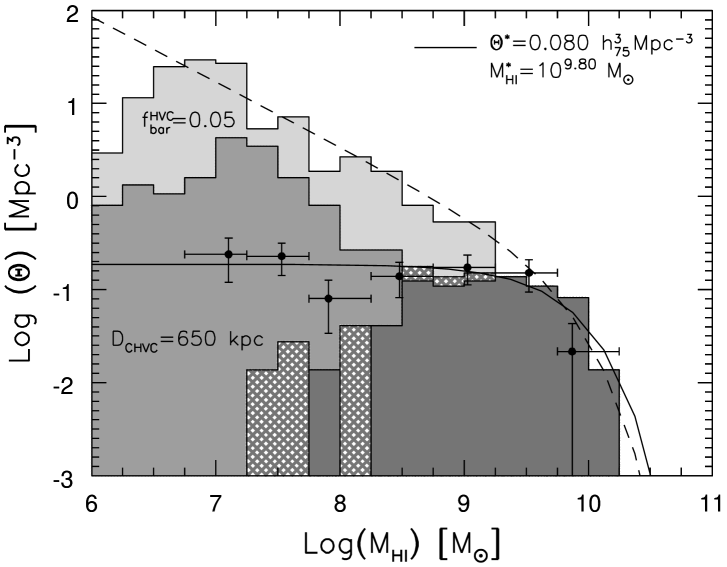
Figure 3 shows the VLA derived HIMF in comparison with the optically selected HIMF and the expections for HVCs in the Ursa Major volume. The dark-gray histogram shows the previously known, optically selected UMa HIMF to which the VLA HIMF was normalized at the high mass end.
The light-gray histogram shows the expected distribution of HI masses of the population of Local Group HVCs, under the assumptions that they are indeed of an extragalactic nature and virialized with a dark matter fraction of 95%, and that Ursa Major would have the same space density of HVCs as the Local Group for which a volume of 15 Mpc3 was adopted. Such a population of extragalactic HVCs would give rise to a slope of 1.7 as indicated by the dashed line which is highly inconsistent with the actually measured data points.
The middle-gray histogram shows the expected distribution of HI masses of the recently identified population of compact HVCs (Braun & Burton 1999) in case they were located in the Local Group at a common distance of 650 kpc, and again, if the space density in UMa would be the same as in the Local Group.
In conclusion, although this is a preliminary analysis of 85% of the data, the HI mass function in the Ursa Major cluster is flat down to HI masses of 107 M⊙ and a slope as steep as 1.7 is certainly ruled out in UMa; it would have predicted 30 times more 107.5M⊙ objects (well above the detection limit) than observed with the VLA. No free-floating HI clouds were detected nor the UMa analogs of the hypothesized Local Group extragalactic HVCs. Their space density in UMa would have to be a factor 100 smaller than in the Local Group.
Acknowledgments.
The Very Large Array is a facility of the National Radio Astronomy Observatory, a facility of the National Science Foundation operated under cooperative agreement by Associated Universities Inc.
References
Blitz, L., Spergel, D.N., Teuben, P.J., Hartmann, D., & Burton, W.B. 1999, ApJ, 514, 818
Braun, R., & Burton, W.B. 1999, A&A,341, 437
Kilborn, V., Webster, R.L. & Staveley-Smith, L. 1999, P.A.S.A., 16, 8
Schneider, S.E., Spitzak, J.G., & Rosenberg, J.L. 1998, ApJ, 507, L9
Tully, R.B., Verheijen, M.A.W., Pierce, M.J., Huang, J.-S., & Wainscoat, R.J. 1996, AJ, 112, 2471
Wakker, B.P & Van Woerden, H. 1991, A&A, 250, 509
Zwaan, M.A., Briggs, F.H., Sprayberry, D., & Sorar, E. 1997, ApJ, 490, 173