R-modes in Neutron Stars with Crusts: Turbulent Saturation, Spin-down, and Crust Melting
Abstract
Rossby waves (r-modes) have been suggested as a means to regulate the spin periods of young or accreting neutron stars, and also to produce observable gravitational wave radiation. R-modes involve primarily transverse, incompressive motions of the star’s fluid core. However, neutron stars gain crusts early in their lives: therefore, r-modes also imply shear in the fluid beneath the crust. We examine the criterion for this shear layer to become turbulent, and derive the rate of dissipation in the turbulent regime. Unlike dissipation from a viscous boundary layer, turbulent energy loss is nonlinear in mode energy and can therefore cause the mode to saturate at amplitudes typically much less than unity. This energy loss also reappears as heat below the crust. We study the possibility of crust melting as well as its potential implications for the spin evolution of low-mass X-ray binaries. Lastly, we identify some universal features of the spin evolution that may have observational consequences.
1. Introduction
The possibility of gravitational radiation from rapidly-rotating neutron stars has recently come under intense scrutiny. This interest has been fueled partly by the need to explain both the limited range of rotation periods in low-mass X-ray binary systems (LMXBs) with various accretion rates (Bildsten 1998; Andersson 1998) and the observed upper limit in spin rate of young neutron stars, and partly by the possibility that the gravitational radiation from LMXBs or newborn neutron stars may be detectable by gravity observatories such as LIGO (Owen et al. 1998; Bildsten 1998; Andersson, Kokkotas, & Stergioulas 1999). For neutron stars with crusts, there are two potential sources of gravitational radiation: a mass quadrupole originating in the solid crust of the star (Bildsten 1998), or a current quadrupole from Rossby waves, which become overstable under the influence of their own gravitational radiation (Andersson 1998; Friedman & Morsink 1998).
The outer layer of a neutron star solidifies if the typical energy of Coloumb interactions between nuclei, , exceeds the thermal energy, , by a critical factor (Farouki & Hamaguchi 1993). Here, and are the mean charge and the mean spacing of nuclei, respectively. The crystallization (also the melting) temperature is therefore
| (1) |
where we have scaled and (mean atomic weight) with values suitable for the bottom of the LMXB crust (Haensel & Zdunik 1990). Young neutron stars (Negele & Vautherin 1973), and LMXBs whose crust have been sufficiently heated, may have higher values of and therefore higher Nucleation of a crystalline crust begins at around , and crystallization accelerates exponentially as the temperature is decreased further (de Blasio 1995). All but the hottest neutron stars are expected to possess a solid crust of thickness . Our investigation continues along the lines of Bildsten & Ushomirsky (2000; hereafter, BU) to explore the implications of such a solid crust for r-modes. We also consider the fate of the crust during r-mode instability.
We shall focus on the fastest growing r-mode with spherical indexes , whose rotating frame frequency is . Here is the spin frequency of the neutron star; we denote its angular counterpart as . In the fluid core, the r-mode is largely horizontal, and the modulus of its displacement vector is (Owen et al. 1998)
| (2) |
where is the co-latitude, the distance from the center and the stellar radius. The amplitude of the velocity perturbation is related to the displacement by . If the neutron star crust is perfectly rigid, the r-mode produces a periodic rubbing at the fluid-solid boundary with velocity . However, Levin & Ushomirsky (2000) have argued that the crust of a neutron star is not perfectly rigid, and it will participate in the lateral motion of the mode. To account for this, we write , with in the limit where the shear force in the crust much exceeds the local Coriolis force.
BU considered energy dissipation in a thin viscous boundary layer at the above core-crust interface. Dissipation due to “molecular” viscosity is more intense in this laminar boundary layer than in the bulk flow caused by the mode. Therefore, the presence of the boundary layer increases the stellar rotation rate above which the mode becomes unstable, relative to the case when the crust is absent (Owen et al. 1998). The mode is pumped by gravitational radiation and damped by viscosity at rates that both scale as . So a laminar boundary layer cannot provide a saturation mechanism for an unstable r-mode.
In contrast, a turbulent boundary layer provides nonlinear dissipation that leads to r-mode saturation. A turbulent boundary layer occurs once the mode amplitude grows above a critical value. It removes kinetic energy from the mode with a rate that is cubic in . As grows, turbulent dissipation rapidly catches up with the amplification of the mode energy due to gravitational back-reaction. We find this mechanism typically saturates the mode amplitude at values much less than unity, i.e., well below what has been assumed in the literature (Levin 1999; Owen et al. 1998)
The kinetic energy of the r-mode is converted into heat in the thin turbulent boundary layer.111The heat input due to the viscous boundary layer is insignificant except when the r-mode is marginally unstable. If conduction and local neutrino emission cannot carry the heat away sufficiently quickly, the local temperature may increase above the melting temperature (eq. [1]) and the crust will begin to melt. In §3, we calculate the thermal profile induced by boundary-layer heating at the core-crust interface.
Finally, in §4, we consider the implications of turbulent saturation and local heating on the thermal and spin evolution of LMXBs as well as new-born neutron stars. We conclude in §5.
Throughout this paper we employ as a fiducial model an polytrope of mass and radius (as in Lindblom, Mendell, & Owen 1999). The bottom of the crust is assumed to have density (Brown 2000).
2. Viscous and turbulent boundary layers
Going outward from the fluid core to the solid crust, the shear modulus of the material changes from zero to a large (but finite) value. This implies a discontinuity in the horizontal velocity of the r-mode across the core-crust boundary. The r-mode periodically rubs the fluid core against the solid crust with this velocity. A viscous boundary layer develops for small velocity jump, and a turbulent boundary layer sets in when the jump increases above some critical value.
The effect of a viscous boundary layer on r-modes was first analyzed by BU. We reiterate some of their results here. Ignoring the Coriolis force, the thickness of this layer is given by the diffusion length during one mode period (Stokes 1851),
| (3) |
where is the molecular viscosity at the base of the crust, for the chosen density (Flowers & Itoh 1979; Cutler & Lindblom 1987), and stands for . The rate of energy dissipation per unit area is equal to the mean relative kinetic energy contained within this layer (half of times ) multiplied by the mode frequency:
| (4) |
This yields a global energy dissipation rate of
| (5) |
where , and refers to the energy in the mode (Owen et al. 1998),
| (6) |
with .222This expression for assumes that the r-mode satisfies equation (2) in the whole star; strictly speaking, an impenetrable crust reduces the mode energy by a factor of . We ignore this correction throughout the paper. BU found that the viscous boundary layer stabilizes r-modes against gravitational back-reaction excitation at low spin frequencies and low stellar temperatures.
When an unstable r-mode acquires sufficiently large amplitude, the laminar boundary layer will make a transition to turbulence. This requires the local Reynolds number to exceed a critical value
| (7) |
where the amplitude of the relative displacement and the critical Reynolds number is determined experimentally to be (Jensen, Sumer, & Fredsoe 1989).333Note that if we define a Reynolds number using the width of the turbulent layer (as is done in a pipe flow), as opposed to using , we find at the transition to turbulence (Landau & Lifshitz 1959).
Combining the Reynolds number criterion (7) with the definition of , we find that the onset of turbulence at the equator requires a mode amplitude greater than a critical value :
| (8) |
which corresponds to a thickness of the boundary layer (see Appendix A). At other latitudes, turbulence sets in at a larger mode amplitude.
Turbulence implies that eddies, rather than viscosity, advect momentum toward the crust. The crust feels a drag force very nearly in phase with with a magnitude (eq. [A6])
| (9) |
where the drag coefficient is measured to be (Jensen et al. 1989) at the onset of turbulence and varies logarithmically with the Reynolds number beyond the critical point, as is discussed in Appendix A. Kinetic energy is removed from the r-mode with a time-averaged rate per unit area of
| (10) |
where time-averaging gives the factor as the drag is in phase with . Integrating over the sphere assuming a constant , we find the total dissipation rate
| (11) |
where is the velocity jump at the equator. In general, we adopt for the value at the equator, where the Reynolds number is the largest.
Turbulent dissipation increases with more rapidly than does the pumping of the mode by gravitational back-reaction, and this leads to saturation. Recall that the mode gains energy due to gravitational wave radiation at the rate (cf. Owen et al. 1998)
| (12) |
Balancing this energy gain with the nonlinear energy drain from turbulence, we find a saturation amplitude
| (13) |
Note that is independent of temperature up to the logarithmic dependence of on . Typically for an unstable r-mode, in which case the r-mode grows rapidly until it reaches a steady state with . The scaling seems to imply that the saturation amplitude will increase enormously (at a given spin frequency) if the crust’s rigidity parameter is reduced from unity to . Newborn, rapidly spinning neutron stars will therefore spin down at a rate that is very sensitive to (and may be saturated by other means if eq. [13] predicts ). In contrast, the spins of LMXBs are confined within a narrow frequency range that varies with (as we will show in §4). The spin frequency at which they first become unstable scales as (equating eqs.[4] with [12]). Taking this change of spin frequency into account, we find that the maximum r-mode amplitude in LMXBs varies as . Low saturation amplitudes are expected in LMXBs even for .
We return now to comment on a few issues relevant to turbulence onset. The first is related to the local stratification. We find the Richardson number
| (14) |
at for a Brunt-Väisälä frequency of (Reisenegger & Goldreich 1992). This indicates that the stable stratification at the core-crust boundary does not prevent the onset of turbulence.
Notice that the Reynolds number (eq. [7]) can also be written as , where the thickness of the turbulent layer is related to as (see Appendix A). The condition implies . Viscosity is unimportant in most of the turbulent region. Moreover, the turn-over time of the energy-bearing (also the largest) eddies in the turbulent region is much shorter than the mode period, . This allows for a well-developed turbulent cascade.
The interaction between shear turbulence and stellar rotation, the possibility of equipartition magnetic fields in the turbulent layer, and the possible superfluid nature of the material, are potentially important questions that lie beyond the scope of this paper.
3. Temperature Profile from Boundary Layer Heating
Turbulence converts the kinetic energy of the r-mode into heat and deposits it in a thin region of width below the crust. If thermal conduction and local neutrino emission cannot carry away the heat efficiently, the temperature in this layer may be driven up to past the melting temperature of the crust (eq. [1]). As our saturation mechanism (§2) depends on the presence of such a solid crust, we wish to establish the temperature profile of the boundary layer. We assume a steady state solution because the conduction time over the regions of interest to us is much shorter than the evolution time.
The conduction of heat away from the boundary layer requires a temperature profile that declines in each direction. This, in turn, implies that the rate of local neutrino cooling decreases with distance away from the boundary layer. We assume that the scale length of the temperature perturbation is much shorter than the density scale height, and therefore much smaller than the stellar radius as well. This assumption, whose validity must be checked a posteriori, allows us to consider only planar heat conduction in a region of constant density.
The following toy model gives insight into the full solution. Let us consider a piecewise linear temperature profile, one that reaches a temperature within the boundary layer (of width ), and falls to zero over lengths and to the inside and outside, respectively. The two lengths differ because the thermal conductivity takes different values in the two directions.
In a state of equilibrium, any energy not radiated as neutrinos within the boundary layer must be carried away by conductive fluxes:
| (15) |
where neutrino emissivity due to modified Urca reactions is with (Friman & Maxwell 1979). The heat flux leaving the boundary layer in each direction is
| (16) |
respectively. The thermal conductivity of the crystalline crust is dominated by electron-phonon scattering and scales with the local temperature inversely, , while that of the liquid core is dominated by electron-proton and electron-neutron scattering with the same temperature dependence, (Flowers & Itoh 1979).
Another consequence of thermal equilibrium is that the heat conducted into the crust or core must be radiated there in neutrinos. With our approximation of a linear temperature profile, this implies in each direction with the conductive lengths defined in equation (16). A more accurate calculation in which no temperature profile is assumed a priori (Appendix B) gives . Combining this with equation (16), we find the conductive lengths to be
| (17) |
As long as , and our assumption of a thin heated region is justified. The heating becomes increasingly local as the boundary layer rises in temperature: when more heat is deposited in the boundary layer, a larger temperature gradient is required to conduct the heat outward leading to a smaller conduction length. The assumption of an isothermal star is thus not justified in the presence of any significant localized heating. In §4.1 and §4.2 we shall compare the implications of the isothermal approximation with those of localized temperature profile for neutron star spin evolution.
Substituting equations (16) and (17) into equation (15), adopting and evaluating at the equator, we find a quadratic equation for , whose solution gives
| (18) |
where and is taken to be . Neutrino losses from the boundary layer itself dominate over the conductive fluxes for , or . For a given mode amplitude, the boundary layer temperature decreases towards the poles.
We find that the flux going to the core is roughly larger than that conducted to the crust. However, if the above equilibrium temperature exceeds , the crust will begin to melt. Once melting begins, we expect that the energy input from the boundary layer will be used almost entirely to melt the crust. The temperature in this layer will be kept very close to by the continual inflow of cool, freshly molten crust, as the boundary layer moves upward following the bottom of the receding crust. The time it takes to completely melt the crust can be estimated to be a few days (the ratio where is roughly the chemical binding energy of the crust).
4. Implications for Neutron Star Spin and Temperature Evolution
We now consider the implications of turbulent saturation for the evolution of young neutron stars and LMXBs in the plane. In this section we assume the crust is present and is not melted, an assumption we examine in §4.2. Once the neutron star is pushed into the instability region, either by cooling or by accretion, its r-mode quickly grows to its saturated value as given by equation (13). Inserting it into equation (C2) we find that the time to spin down to a frequency is fairly independent of the initial spin frequency of the star, and is given by
| (19) |
The time to spin the star down to, say, is roughly . As decreases sharply with decreasing frequency, most of the spin-down time is spent near the lowest frequencies.
The above conclusion on the evolution of the spin frequency may need modification if the crust can be melted by the r-mode heating. This prompts us to study the temperature evolution of the star. This we do by first adopting the isothermal approximation for the whole star. It applies in the limit of infinite thermal conductivity or large-scale heating. We then apply our results from §3 to the realistic case in which the conductivity is finite and r-mode heating is local.
Evolution in the unrealistic isothermal case can be easily integrated using equations in Appendix C. It is useful for comparison with previous work. More importantly, insights gained from the isothermal case can be applied to the realistic case.
4.1. Isothermal Approximation

After the r-mode reaches its saturation amplitude, it provides the neutron star with a source of heat from turbulent dissipation. The neutron star heats up quickly until it reaches a state in which the r-mode heating is balanced by the neutrino losses. With time the temperature will decrease slowly because heating by r-mode decreases with the spin frequency. We set the r-mode heating term equal to the neutrino cooling term in equation (C3) to find the following scaling between the temperature and the spin rate of the star,
| (20) |
where we take and ignore the logarithmic dependence of on temperature by using . This relation gives us the thermal equilibrium spin-down line. It intersects the instability curve at the terminal frequency . All neutron stars entering the instability region with an initial spin frequency will converge onto the equilibrium line and exit at . The ones that enter at find their spin rates hardly affected by r-mode instability. This is because their spin down time (eq. [19]) much exceeds their neutrino cooling time.
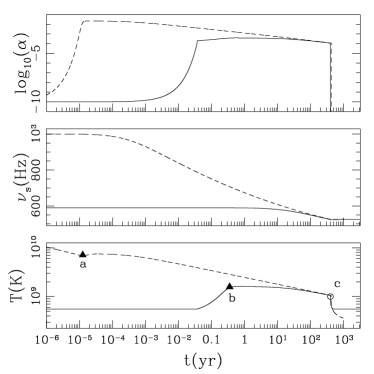
Figures 1 and 2 exhibit the results of our evolutionary calculations with a variety of mass accretion rates in LMXBs and a range of initial spin rates for young neutron stars. The evolution equations we adopted for the integrations are listed in Appendix C. They are similar to those derived in Owen et al. (1998) apart from the additional terms that arise from boundary layer dissipation. We consider only here. We find that, up to logarithmic dependence of on the Reynolds number, the numerical results confirm equations (19) and (20).
Note that the presence of an equilibrium spin-down line is a universal feature independent of the saturation mechanism. If r-modes are saturated to constant values, for instance, we find the equilibrium temperature .
Levin (1999) was the first to point out that LMXBs undergo limit cycles in which the angular momentum accreted over the whole cycle is radiated by gravitational waves when the r-mode is unstable. The r-mode phase lasts a time that depends on the saturation mechanism and is relatively insensitive to the initial spin frequency at which the r-mode is destabilized. Equation (19) yields the spin-down time at the terminal frequency to be . Compared to an accretion spin-up time of at the Eddington accretion rate, we find a maximum duty cycle of during which time the gravitational wave emitted by the r-mode may be potentially detectable, with the duty cycle decreasing at lower accretion rate. This duty cycle is much higher than that found by previous investigators (e.g., Levin 1999) mostly due to our much reduced saturation amplitude.
4.2. Realistic Evolution Accounting for Local Heating

For simplicity, we consider only the evolution of LMXBs in this section. Numerical integration for the evolution tracks in the realistic case is much more difficult than in the isothermal case. Fortunately, they are not necessary. As is evident from Figure 1, given initial conditions, the equilibrium line and the instability curve completely determine the evolution tracks.
The r-mode instability curve in the low temperature range depends only on the boundary layer temperature because damping from the viscous boundary layer dominates over other damping mechanisms. The equilibrium spin-down line is also given in terms of the boundary layer temperature (eq. [18]). So we can simplify the problem in hand by considering only the temperature at the boundary layer.
There are two main differences between the realistic and the isothermal case: a lower terminal frequency and an enhanced heating in the boundary layer.
The new equilibrium spin-down line (eq. [18]) intersects the instability curve at a terminal frequency
| (21) |
that is lower than in the isothermal case. It takes slightly longer to spin the star down to this lower value of .
The r-mode heats the boundary layer to a higher temperature than under the isothermal approximation. This results from the fact that, unlike in the isothermal case, there is now only a shell of thickness which receives heat and cools by neutrinos (§3).
We present the LMXB limit cycles for the two cases and in Figure 3. One observational consequence suggests itself in the figure: all LMXBs are expected to have spin frequencies falling in the narrow range of when , and when , independent of their accretion history. This continues the idea proposed by Bildsten (1998) and Andersson et al. (1999) that r-modes may be instrumental in halting the LMXB spin-up. The resemblance between the above frequency range for and the observed LMXB spin rates (van der Klis 2000) is intriguing. However, it may be difficult to explain the fastest millisecond pulsars (period of ms) using the same value of .
The above results may need modification if the crust melts during the r-mode evolution. Melting the crust is more likely than is suggested by the isothermal approximation. As Figure 3 demonstrates, the crust is most likely to melt if is large and if the accretion rate is low. We define a melting frequency, , at which the equilibrium line intersects the melting line . We find for , for and for . We speculate below on some possible evolutionary consequences when crust melting is taken into account.
4.3. Possible Outcomes Including Crust Melting and Forming

The rotational energy () far exceeds the chemical binding energy of the crust () for spin rates of interest: crust melting is not inhibited by lack of energy. Moreover, as discussed in §3, the temperature at the bottom of the crust may be driven above the melting temperature by turbulent heating; this causes melting. For our fiducial parameters, this occurs for slowly accreting LMXBs if (Fig. 3).
After the crust is melted, some other nonlinear dissipation must cause the r-mode to saturate. It is beyond the scope of this paper to predict the evolution when the crust is molten. However, we can be confident that the star will cool and spin down sufficiently to form a crust again. Once this occurs, the subsequent evolution is again within our jurisdiction, and it depends on the stellar spin frequency () at the moment the crust forms. We discuss five representative evolution scenarios that begin with different values of , labeled A through E in Figure 4.
In case A, the stellar temperature drops below the melting temperature while the star is still spinning so fast () that the boundary layer temperature would exceed if a crust did form. Therefore, the material that could form a crust is kept hot (by some means) with . This implies that the formation of an appreciable crust is delayed until the rotation has slowed to , where is the frequency at which the equilibrium line hits the melting line. After this point the star will spin down with a saturated r-mode (eq. [19]) and cool in a state of thermal equilibrium (eq. [18]); this behavior is represented by the solid line in Figure 4. The star leaves the instability region with a specific (terminal) spin frequency when the mode is no longer unstable.
Case B represents the outcome if the initial spin frequency is low enough to allow crust formation, yet higher than the terminal spin frequency. A crust forms and the star evolves towards the equilibrium spin-down line, with the the cooling of the boundary layer regulated by that of the whole star. The subsequent evolution is identical to case A.
Case C enters with . Its spin-down time is longer than the cooling time and it exits the r-mode instability curve without being significantly spun down. Case D has a similar outcome: r-mode instability is quenched entirely once the crust forms.
Case E hits the instability curve to the right of the melting line. It evolves along the critical stability curve until the melting line, after which the r-mode becomes stable. This is the only scenario in which we can predict the evolution of an r-mode in the absence of a crust.
From these considerations we conclude that the final rotation rates of young neutron stars, and of those LMXBs capable of melting their crusts, depend on their spin evolution while the crust is absent. In the case that and , the final spin frequencies should lie in the range of to , where the upper limit is the terminal frequency . The chosen value of should be considered uncertain, but recent calculations (Levin & Ushomirsky 2000) point to . Also, a minimum value of can be derived from equation (21) by assuming that is larger than the frequency of the fastest known young neutron star (; Marshall et al. 1998). Moreover, young neutron stars, or LMXBs that have been heated above the temperature necessary for nuclear burning, are more likely to be in a state of chemical equilibrium at the base of their crusts; this implies higher values of , thus higher melting temperatures. However, the above discussion demonstrates that this would only raise the lower bound for the possible range of final rotation rates without changing the upper bound ().
5. Conclusions
R-modes in the fluid core of a neutron star generate velocity shear below the solid crust. The primary conclusion of this paper is that this velocity shear can drive turbulence which in turns limits the amplitude that an overstable r-mode can obtain. This saturation amplitude is easily calculable. It rises steeply with mode frequency and depends on the temperature at the turbulent boundary layer only logarithmically. For most spin frequencies of interest, we find this amplitude falls well below unity.
We also find that heating due to turbulent dissipation in the boundary layer leads to a localized temperature enhancement relative to the surrounding material, and the heat is removed by neutrinos from both the boundary layer itself and from the nearby regions to which the heat is conducted. It is erroneous to assume that the whole star remains isothermal in the presence of a localized heat source. The boundary layer temperature may exceed the melting temperature of the crust.
When studying the spin and temperature evolution of neutron stars undergoing r-mode instability, we find the following remarkable behaviors: because of the strong dependence of neutrino cooling on the temperature, the temperature of the boundary layer rapidly reaches an equilibrium value that depends on the mode amplitude and spin frequency, and hence, for a saturated mode, only on the stellar spin. This defines an equilibrium spin-down line along which all neutron stars evolve. We define the spin frequency at which this line intersects the instability line as , the terminal frequency. This frequency is a significant feature of the spin evolution. We expect all neutron stars with crusts to exit the r-mode instability range with , as long as their initial spin frequencies are higher than . Neutron stars born with will never experience significant spin-down. If the crust can be melted and reformed, the terminal frequency defines the upper limit to the final spin rates of these neutron stars. We also establish a spin-down law for which the time required to spin the star down to is roughly independent of the initial spin rate. These features are expected to persist for other saturation mechanisms.
This work has relied on several assumptions and approximations which should be noted. We have ignored any dissipation that may occur within the solid crust itself, the possibility that the crust may be melted by mechanical strain or heat from nuclear reactions, and additionally any nonlinear dissipation caused by coupling between modes in the bulk of the fluid core (Schenk et al. 2000). We have ignored the possibility that gravitational radiation may be dominated by a permanent mass quadrupole within the crust. We have not considered the effects of superfluidity in the material below the crust. The detailed value of the boundary layer temperature depends on the exact value of the thermal conductivity as well as on the parameter that describes the crust motion; these we consider relatively uncertain. Moreover, melting of the crust is sensitive to the composition at its base, and this may differ between young and accreting neutron stars. Finally, our discussions in §4.3 do not include the possibility that chemical composition in the crust may change when melting occurs.
References
- Andersson (1998) Andersson, N. 1998, ApJ, 502, 708
- Andersson, Kokkotas, & Stergioulas (1999) Andersson, N., Kokkotas, K. D., & Stergioulas, N. 1999, ApJ, 516, 307
- Bildsten (1998) Bildsten, L. 1998, ApJ, 501, L89
- Bildsten & Ushomirsky (2000) Bildsten, L. & Ushomirsky, G. 2000, ApJ, 529, L33
- Brown (2000) Brown, E. F. 2000, ApJ, 531, 988
- Cutler & Lindblom (1987) Cutler, C. & Lindblom, L. 1987, ApJ, 314, 234
- de Blasio (1995) de Blasio, F. V. 1995, ApJ, 452, 359
- Farouki & Hamaguchi (1993) Farouki, R. T. & Hamaguchi, S. 1993, Phys. Rev. E, 47, 4330
- Flowers & Itoh (1979) Flowers, E. & Itoh, N. 1979, ApJ, 230, 847
- Friedman & Morsink (1998) Friedman, J. L. & Morsink, S. M. 1998, ApJ, 502, 714
- Friman & Maxwell (1979) Friman, B. L. & Maxwell, O. V. 1979, ApJ, 232, 541
- Haensel & Zdunik (1990) Haensel, P. & Zdunik, J. L. 1990, A&A, 229, 117
- Jensen, Sumer, & Fredsoe (1989) Jensen, B. L., Sumer, B. M., & Fredsoe, J. 1989, J. Fluid Mech., 206, 265
- Landau & Lifshitz (1959) Landau, L. D. & Lifshitz, E. M. 1959, Fluid Mechanics (Pergamon)
- Levin (1999) Levin, Y. 1999, ApJ, 517, 328
- Levin & Ushomirsky (2000) Levin, Y. & Ushomirsky, G. 2000, astro-ph/0006028
- Lindblom, Mendell, & Owen (1999) Lindblom, L., Mendell, G., & Owen, B. 1999, Phys. Rev. D, 60, 064006
- Marshall, Gotthelf, Zhang, Middleditch, & Wang (1998) Marshall, F. E., Gotthelf, E. V., Zhang, W., Middleditch, J., & Wang, Q. D. 1998, ApJ, 499, L179
- Negele & Vautherin (1973) Negele, J. & Vautherin, D. 1973, Nucl. Phys. A285, 332
- Owen, Lindblom, Cutler, Schutz, Vecchio, & Andersson (1998) Owen, B., Lindblom, L., Cutler, C., Schutz, B., Vecchio, A., & Andersson, N. 1998, Phys. Rev. D, 59, 84020
- Reisenegger & Goldreich (1992) Reisenegger, A. & Goldreich, P. 1992, ApJ, 395, 240
- Schenk, Flanagan, Wasserman, Teukolsky, & Arras (2000) Schenk, K., Flanagan, E., Wasserman, I., Teukolsky, S., & Arras, P. 2000, in prep.
- Stokes (1851) Stokes, G. G. 1851, Trans Combr. Phil. Soc., 9, 35
- van der Klis (2000) van der Klis, M. 2000, ARA&A, submitted
Appendix A Turbulent Boundary Layer
In this appendix, we give a short description of the turbulent boundary layer caused by shear flows. We provide scalings for the thickness of the layer, the velocity profile inside the layer and the drag force acting on the wall. These scalings are confirmed by numerical experiments and we use them in the main text to derive the energy dissipation rate due to shear turbulence.
Let be the oscillatory rubbing velocity between the neutron star’s fluid core and its solid crust. The horizontal displacement is . When the boundary layer becomes turbulent, we can describe it with results from a similar situation: the turbulent boundary layer generated by a steady flow along a semi-infinite plane. Our discussion therefore follows closely that of Landau & Lifshitz (1959, §42-44). In this case, can be understood as the distance away from the edge of the plane, and as the velocity of the shear flow. Although the steady solution is expected to reproduce the correct scalings for the boundary layer structure, it is time-independent and therefore cannot predict the phase shift between the shear velocity and the drag force. We obtain this phase shift from the experimental data of Jensen et al. (1989).
The thickness of the turbulent boundary layer () grows linearly with the distance away from the edge of the plane (). We write
| (A1) |
where is a small dimensionless number that describes the expansion of the turbulent layer relative to the horizontal displacement away from the edge. If we define to be the root mean squared fluctuating velocity in the turbulent layer, we find
Within the boundary layer, the time-averaged velocity at distance away from the plane obeys a logarithmic profile,
| (A2) |
where and are experimentally determined constants. At , we should recover the flow velocity, so . Combining this expression with equation (A1), we find the following solution for ,
| (A3) |
where we define an experimentally controlled Reynolds number for the flow by
| (A4) |
A rough scaling for can be found in the limit of very large Reynolds number where the solution to equation (A3) is
| (A5) |
The fact that is a slowly varying function of the Reynolds number helps simplifying the calculation for energy dissipation rate.
The drag force per unit area on the surface due to the fluctuating velocity field is
| (A6) |
which identifies the drag coefficient in the turbulent regime to be , also a slowly decreasing function of the Reynolds number. Jensen et al. (1989) show that in the fully turbulent regime, the drag force is nearly in phase with the shear velocity.
The scalings in the laminar regime (Landau & Lifshitz 1959) and in the turbulent regime compare very well with the experimental determinations of by Jensen et al. (1989) over a large range of Reynolds number. Furthermore, if we estimate the critical Reynolds number for the onset of turbulence by equaling the two expressions, we find , in good agreement with the experiment. At , and . Beyond the onset of turbulence, decreases logarithmically with the Reynolds number.
Appendix B Equilibrium Temperature Profile Around a Localized Source of Heat
We assume thermal equilibrium has been reached. On either side of a localized heat source, the heat conduction and energy conservation equations read,
| (B1) |
where is the thermal conductivity and scales inversely with in the neutron star interior, while is the neutrino emissivity with for modified Urca reactions. We define two constants and .
Under the planar approximation, we manipulate the above equations to find
| (B2) |
where is the radius. Integrating both sides, we find
| (B3) |
where and are two arbitrary points within the integration range. Here, we take point to be at the boundary layer, which is the source of heat, and point to be at many conduction lengths away from the boundary layer so that the flux and temperature at point may be regarded as negligible. The flux and temperature at the boundary are then related by
| (B4) |
If we define a conduction length , we find , a result we adopt in §3.
Appendix C Evolution Equations
We have modified the phenomenological model of Owen et al. (1998) to calculate the effect of the r-mode on the spin and temperature of the neutron star in the isothermal approximation. The evolution equations for mode amplitude , spin frequency , and stellar temperature are
| (C1) | |||||
| (C2) | |||||
| (C3) |
where , , is the mass accretion rate onto the surface of the neutron star (equals in the young neutron star case), is twice the specific heat at a temperature of , and is the neutrino cooling rate at . The terms involving describe the torque and heating by accretion (Levin 1999), and is the fraction of accreted energy that goes into heating the star, we take it to be unity. The mode energy with . The initial LMXB temperature is determined self-consistently using equation (C3) setting and . It varies by a factor of a few over three orders of magnitude in accretion rates. The various time-scales in the above equations are listed below.
Following Lindblom et al. (1999), we write the energy input rate due to gravitational wave back-reaction to be
| (C4) |
with and . The negative sign indicates driving. Similarly, the bulk viscosity and molecular shear viscosity rates are
| (C5) |
with and . We will continue to use these estimates in the presence of a crust even though the r-mode occupies a smaller volume.
BU and this article have pointed to the importance of the boundary layers at the core-crust interface. We model the dissipation rate in this layer as a function that is continuous when the layer changes from laminar (viscous) to turbulent,
| (C6) |
with when and otherwise. The viscous and the turbulent damping rates are, respectively,
| (C7) |
where the fiducial time-scales and . We equate with to obtain the swith-over amplitude . In our calculations, we evaluate using the Reynolds number at the equator.
The total rate of viscous damping for the r-mode as well as the rate of heating due to the r-mode (ignoring bulk viscosity heating) are given by
| (C8) |