An Overview of Optical Galaxy Searches and their Completeness
Abstract
Dust and stars in the Milky Way create a “Zone of Avoidance” (ZOA) in the distribution of optically visible galaxies of about 25% of the sky. To reduce this gap, optical searches for partially obscured galaxies have been performed. The status of these deep searches, in particular their completeness as a function of foreground extinction are discussed. Using existing sky surveys, over 50 000 previously unknown galaxies have been identified. The surveys cover practically the whole ZOA. It is shown that these surveys are complete for galaxies with extinction-corrected diameters arcmin to extinction levels of . Incorporating these new data in a whole-sky map of galaxies complete to finds the ZOA reduced by a factor of about 2 to 2.5, respectively from extinction levels of to (see Fig. 4).
Depto. de Astronomía, Universidad de Guanajuato, Apdo. Postal 144, Guanajuato GTO 36000, Mexico
1. Historic Perspective of the Zone of Avoidance
A first reference to the Zone of Avoidance (ZOA), or the “Zone of few Nebulae” was made in 1878 by Proctor, based on the distribution of nebulae in the “General Catalogue of Nebulae” by Sir John Herschel (1864). This zone becomes considerably more prominent in the distribution of nebulae presented by Charlier (1922) using data from the “New General Catalogue” by Dreyer (1888, 1895). These data also reveal first indications of large-scale structure: the nebulae display a very clumpy distribution. Currently well-known galaxy clusters such as Virgo, Fornax, Perseus, Pisces and Coma are easily recognizable even though Dreyer’s catalog contains both Galactic and extragalactic objects. It was not known then that the majority of the nebulae actually are external stellar systems similar to the Milky Way. Even more obvious in this distribution, though, is the absence of galaxies around the Galactic Equator. As extinction was poorly known at that time, no connection was made between the Milky Way and the “Zone of few Nebulae”.
A first definition of the ZOA was proposed by Shapley (1961) as the region delimited by “the isopleth of five galaxies per square degree from the Lick and Harvard surveys” (compared to a mean of 54 gal./sq.deg. found in unobscured regions by Shane & Wirtanen 1967). This “Zone of Avoidance” used to be “avoided” by astronomers interested in the extragalactic sky because of the lack of data in that area of the sky and the inherent difficulties in analyzing the few obscured galaxies known there.
Merging data from more recent galaxy catalogs, i.e. the Uppsala General Catalog UGC (Nilson 1973) for the north (), the ESO Uppsala Catalog (Lauberts 1982) for the south (), and the Morphological Catalog of Galaxies MCG (Vorontsov-Velyaminov & Archipova 1963-74) for the strip inbetween (), a whole-sky galaxy catalog can be defined. To homogenize the data determined by different groups from different survey material, the following adjustments have to be applied to the diameters: and (Lahav 1987). According to Hudson & Lynden-Bell (1991) this “whole-sky” catalog then is complete for galaxies larger than .
The distribution of these galaxies is displayed in Galactic coordinates in Fig. 1 in an equal-area Aitoff projection centered on the Galactic Bulge (). The galaxies are diameter-coded, so that structures relevant for the dynamics in the local Universe stand out accordingly. Figure 1 clearly displays the irregularity in the distribution of galaxies in the nearby Universe such as the Local Supercluster visible as a great circle (the Supergalactic Plane) centered on the Virgo cluster at , the Perseus-Pisces chain bending into the ZOA at and , the general overdensity in the Cosmic Microwave Background dipole direction (; Kogut et al. 1993) and the general galaxy overdensity in the Great Attractor region (GA) centered on (Kolatt, Dekel, & Lahav 1995) with the Hydra (), Antlia (), Centaurus () and Pavo () clusters.
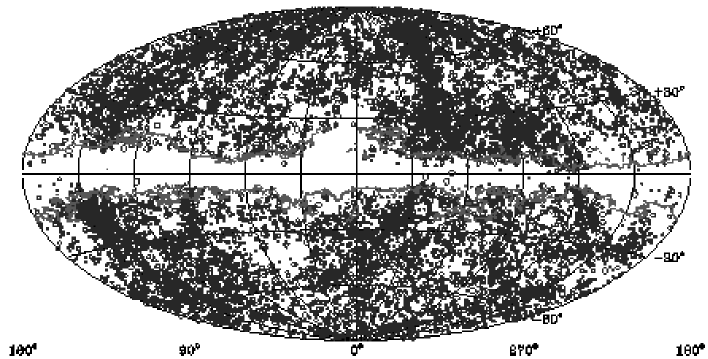
Most conspicuous in this distribution is, however, the very broad, nearly empty band of about 20∘ width. As optical galaxy catalogs are limited to the largest galaxies they become increasingly incomplete close to the Galactic Equator where the dust thickens. This diminishes the light emission of the galaxies and reduces their visible extent. Such obscured galaxies are not included in the above mentioned classic diameter- or magnitude-limited catalogs because they appear small and faint – even though they might be intrinsically large and bright. A further complication is the growing number of foreground stars close to the Galactic Plane which fully or partially block the view of galaxy images.
Comparing this “band of few galaxies” with the currently available 100m dust extinction maps of the DIRBE experiment (Schlegel, Finkbeiner, & Davis 1998), we can see that the ZOA – the area where the galaxy counts become severely incomplete – is described almost perfectly by the absorption contour in the blue of (where ; Cardelli, Clayton, & Mathis 1989). This contour matches the by Shapley (1961) defined ZOA closely.
This wide gap, however, restricts a proper analysis of the dynamics in our local Universe which requires whole-sky coverage, in particular the determination of the peculiar velocity of the Local Group with respect to the Cosmic Microwave Background and velocity flow fields such as in the Great Attractor (GA) region (see Kraan-Korteweg & Lahav 2000, for a detailed review). The main uncertainty in, for instance, the determination of the apex of the LG motion, as well as the distance at which convergence is attained is dependent on the width of the ZOA. In the following, the achieved reduction of the ZOA from systematic deep optical galaxy searches is presented.
2. Status of Optical Galaxy Searches
Using existing sky surveys such as the first and second generation Palomar Observatory Sky Surveys POSS I and POSS II in the north, and the ESO/SRC (United Kingdom Science Research Council) Southern Sky Atlas, various groups have performed systematic deep searches for “partially obscured” galaxies. They catalogued galaxies down to fainter magnitudes and smaller dimensions () than previous catalogs (e.g. ; Lauberts 1982). Here, examination by eye remains the best technique. A separation of galaxy and star images can as yet not be done on a viable basis below by automated measuring machines and sophisticated extraction algorithms, nor with the application of Artificial Neural Networks (ANN). The latter was tested by Naim (1995) who used ANN to identify galaxies with diameters above 25′′ at low Galactic latitudes (). Galaxies could be identified using this algorithm, and although an acceptable hit rate for galaxies of 80 – 96% could be attained when ANN was trained on high latitude fields, the false alarms were of equal order. Using low latitude fields as training examples, the false alarms could be reduced to nearly zero but then the hit rate was low ( 30 - 40%). Although the first attempts of using ANN in the ZOA are encouraging they clearly need further development. Thus, although surveys by eye clearly are both very trying and time consuming – and maybe not as objective – they currently still provide the best technique to identify partially obscured galaxies in crowded star fields.
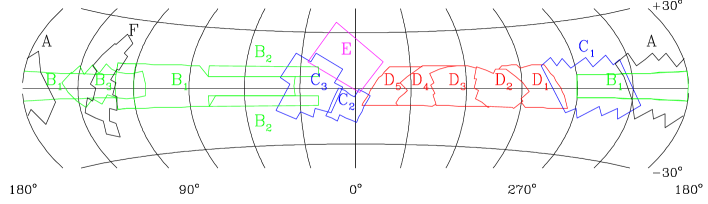
Meanwhile, nearly the whole ZOA has been surveyed (see Fig. 2). Over
50 000 previously unknown galaxies could be discovered in this
way. The uncovered galaxies are not biased with respect to any
particular morphological type. A comparison of the survey regions with the
ZOA (Fig. 1) demonstrates that the systematic deep optical galaxy
searches cover practically the whole ZOA. Details and further
references about the surveys
and results on the uncovered galaxy distributions can be found for:
A: the Perseus-Pisces Supercluster region in Pantoja et al.,
these proceedings,
B1-3: the northern Milky Way (Weinberger et al., these
proceedings),
C1: the Puppis region (Saito et al. 1990, 1991),
C2-3: the Sagittarius and Aquila region (Roman & Saito,
these proceedings),
D1: the Puppis/Hydra region (Salem & Kraan-Korteweg, in prep.),
D2: the Hydra/Antlia region (Kraan-Korteweg 2000),
D3-4: the Crux and Great Attractor region (Woudt et al., these proceedings),
D5: the Scorpius region (Fairall & Kraan-Korteweg, these proceedings),
E: the Ophiuchus region (Wakamatsu et al., these proceedings),
F: the northern GP/SGP crossing (Hau et al. 1995).
3. Completeness of Optical Galaxy Searches
Most of these searches have quite similar characteristics. The distributions reveal that galaxies can easily be traced through obscuration layers of 3 magnitudes (see Fig. 2 in Fairall & Kraan-Korteweg, these proceedings), thereby narrowing the ZOA considerably. A few galaxies are still recognizable up to extinction levels of and a handful of very small galaxy candidates have been found at even higher extinction levels. Overall, the mean number density follows the dust distribution remarkably well at low Galactic latitudes. The contour level of , for instance, is nearly indistinguishable from the galaxy density contour at 0.5 galaxies per square degree (Kraan-Korteweg 1992; Woudt 1998).
The galaxies detected in these searches are quite small () on average. So the question arises whether these new galaxies are relevant at all to our understanding of the dynamics in the local Unverse. Analyzing the galaxy density as a function of galaxy size, magnitude and/or morphology in combination with the foreground extinction has led to the identification of various distinct structures and their approximate distances. However, a detailed understanding of the completeness as a function of the foreground extinction in such searches is essential for the disentanglement of large-scale structure and absorption. Therefore, Kraan-Korteweg (2000) and Woudt (1998) studied the apparent diameter distribution as a function of the extinction (Schlegel et al. 1998) as well as the location of the flattening in the slope of the cumulative diameter curves for various extinction intervals for the galaxies in their ZOA galaxy catalogs (D2-4 in Fig. 2). Inspecting for instance the top panels of Fig. 3, it can be seen that the deep optical survey is complete to an apparent diameter of () for extinction levels less than , i.e. .

How about the intrinsic diameters, i.e. the diameters galaxies would have if they were unobscured? A spiral galaxy seen through an extinction of will, for example, be reduced to of its unobscured size. Only of a (spiral) galaxy’s original dimension is seen when it is observed through . In 1990, Cameron investigated these obscuration effects by artificially absorbing the intensity profiles of unobscured galaxies. He found a diameter reduction due to the extinction of for ellipticals/lenticulars, and of for spirals.
When applying these corrections to the observed (reduced) diameters, it becomes clear that e.g. an obscured spiral or an elliptical galaxy at the apparent completeness limit of seen through an extinction layer of e.g. at has an intrinsic diameter of , respectively . At extinction levels higher than , an elliptical galaxy with would appear smaller than the completeness limit and might have gone unnoticed. Optical galaxy catalogs should therefore be complete to for galaxies of all morphological types down to extinction levels of with the possible exception of extremely low-surface brightness galaxies. Only intrinsically very large and bright galaxies – particularly galaxies with high surface brightness – will be recovered in deeper extinction layers. This completeness limit could be confirmed by independently analyzing the diameter vs. extinction and the cumulative diagrams of extinction-corrected diameters (see bottom panels of Fig. 3).
It can thus be presumed that all the similarly performed optical galaxy searches in the ZOA are complete for galaxies with extinction-corrected diameters to extinction levels of . As the completeness limit of the optical searches lies well below the completeness limit of the ESO, UGC and MGC catalogs one can then supplement these catalogs with the galaxies from optical ZOA galaxy searches that have and .
This has been done in Fig. 4 which shows an improved whole-sky galaxy distribution with a reduced ZOA. In this Aitoff projection, all the UGC, ESO, MGC galaxies that have extinction-corrected diameters are plotted (remember that galaxies adjacent to the optical galaxy search regions are also affected by absorption though to a lesser extent: ), next to all the galaxies from the various optical surveys with and for which positions and diameters were available. The regions for which these data are not yet available are outlined in Fig. 4. As some searches were performed on older generation POSS I plates, which are less deep compared to the second generation POSS II and ESO/SERC plates, an additional correction was applied to those diameters, i.e. the same correction as for the UGC galaxies which also are based on POSS I survey material ().
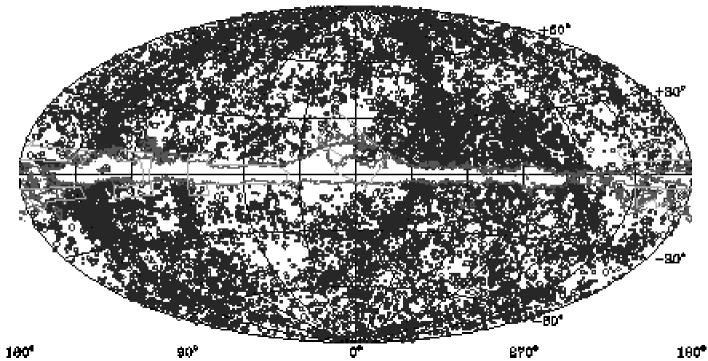
A comparison of Fig. 1 with Fig. 4 demonstrates convincingly how the deep optical galaxy searches realize a considerable reduction of the ZOA: we can now trace the large-scale structures in the nearby Universe to extinction levels of . Inspection of Fig. 4 reveals that the galaxy density enhancement in the GA region is even more pronounced (see for instance Woudt et al., these proceedings, for details on the uncovered rich cluster A3627 in the GA region) and a connection of the Perseus-Pisces chain across the Milky Way at is more likely. Hence, these supplemented whole-sky maps certainly should improve our understanding of the velocity flow fields and the total gravitational attraction on the Local Group.
4. Conclusion
In the last decade, enormous progress has been made in unveiling galaxies behind the Milky Way. At optical wavebands, the entire ZOA has been systematically surveyed. These surveys are complete for galaxies larger than (corrected for absorption) down to extinction levels of . Combining these data with previous “whole-sky” maps reduces the “optical ZOA” by a factor of about 2 - 2.5, which allows an improved understanding of the velocity flow fields and the total gravitational attraction on the Local Group. Various previously unknown structures in the nearby Universe could be mapped in this way.
A difficult task is still awaiting us, i.e. to obtain a detailed understanding of the selection effects in the various searches in which different groups identified galaxies from partly different plate material. Quantifying the selection effects is crucial for any optimal reconstruction method and important for quantitative cosmography. Moreover, we need a better understanding of the effects of obscuration on the observed properties of galaxies, i.e. the Cameron corrections, in addition to an accurate high-resolution, well-calibrated map of the Galactic extinction.
The remaining optical ZOA might yet hide further dynamically important galaxy densities. Here, systematic surveys at other wavebands such as H I, near and far infrared, and X-ray become more efficient. The success and status of these approaches are discussed in various chapters in these proceedings and reviewed in Kraan-Korteweg & Lahav 2000.
References
Cameron, L.M. 1990, A&A, 233, 16
Cardelli, J.A., Clayton, G.C., & Mathis, J.S. 1989, ApJ, 345, 245
Charlier, C.V.L. 1922, Arkiv för Mat. Astron. Fys., 16, 1
Dreyer, J.L.E. 1888, Mem.R.A.S., XLIX, Part 1, ”A New General Catalogue of Nebulae and Clusters of Stars, being the catalogue of the late Sir John F.W. Herschel, revised, corrected and enlarged”
Dreyer, J.L.E. 1895, Mem.R.A.S., LI, ”Index Catalogue of Nebulae found in the Years 1888 to 1894, with Notes and Corrections”
Hau, G.K.T., Ferguson, H.C., Lahav, O., & Lynden-Bell, D. 1995, MNRAS, 277, 125
Herschel, J. 1864, Philosophical Transactions
Hudson, M.J., & Lynden-Bell, D. 1991, MNRAS, 252, 219
Kogut, A., Lineweaver, C., Smoot, G.F., et al. 1993, ApJ, 419, 1
Kolatt, T., Dekel, A., & Lahav, O. 1995, MNRAS, 275, 797
Kraan-Korteweg, R.C. 1992, in 2nd DAEC Meeting, The Distribution of Matter in the Universe, eds. G. Mamon & D. Gerbal (Paris: Obs. de Paris Press), 202
Kraan-Korteweg, R.C. 2000, A&AS, 141, 123
Kraan-Korteweg, R.C., & Lahav, O. 2000, A&ARv, in press (astro-ph/0005501)
Lahav, O. 1987, MNRAS, 225, 213
Lauberts, A. 1982, The ESO/Uppsala Survey of the ESO (B) Atlas (Garching: ESO)
Naim, A. 1995, Ph.D. thesis, Univ. of Cambridge
Nilson, P. 1973, Uppsala General Catalog of Galaxies, (Uppsala: University of Uppsala)
Proctor, R. 1878, The Universe of Stars, (London: Longmans, Green & Co.), 41
Saito, M., Ohtani, A., Asomuna, A., Kashikawa, N., Maki, T., Nishida, S., & Watanabe, T. 1990, PASJ, 42, 603
Saito, M., Ohtani, A., Baba, A., Hotta, N., Kameno, S., Kurosu, S., Nakada, K., & Takata, T. 1991, PASJ, 43, 449
Schlegel, D.J., Finkbeiner, D.P., & Davis, M. 1998, ApJ, 500, 525
Shane, C.D., & Wirtanen, C.A. 1967, Publ. Lick Obs., XXII, Pt. I
Shapley, H. 1961, in Galaxies, (Cambridge: Harvard Univ. Press), 159
Vorontsov-Velyaminov, B., & Archipova, V. 1963-74, Morphological Catalog of Galaxies, Parts 2 – 5, (Moscow: Moscow University)
Woudt, P.A. 1998, Ph.D. thesis, Univ. of Cape Town