The density of extremely red objects around high- radio-loud AGN††thanks: Based on observations made at the European Southern Observatory (La Silla, Chile).
Abstract
We present the results of a -band imaging survey of 40 arcmin2 in fields around 14 radio-loud AGN (6 radio galaxies and 8 quasars) with . The survey, 80% complete to and complemented by -band imaging, aimed at investigating whether extremely red objects (EROs) are present in excess around high- AGN, and to study the environment of radio galaxies and radio-loud quasars. At the differential galaxy counts in our fields suggest a systematic excess over the general field counts. At , we find an excess of galaxies with compared to the general field. Consistently, we also find that the colour distribution of all the galaxies in the AGN fields are significantly redder than the colour distribution of the field galaxies. On the other hand, the distribution of the colours is undistinguishable from that of galaxies taken from literature fields around radio-loud quasars at . We discuss the main implications of our findings and we compare the possible scenarios which could explain our results.
keywords:
galaxies: active; galaxies: formation; galaxies: evolution; galaxies: photometry; galaxies: statistics1 Introduction
One of the main open questions of galaxy evolution is how and when the present-day massive ellipticals formed. On one hand, hierarchical models predict that such galaxies formed at moderate redshifts through merging and accretion characterized by modest star formation rates (e.g. White & Frenk 1991). On the other hand, the so called monolithic scenario predicts that the present-day ellipticals formed at very high redshifts through a single, intense and rapid burst of star formation followed by a passive and pure luminosity evolution (PLE) of the stellar population (e.g. Eggen et al. 1962; Larson 1975).
From the observational point of view, the above problems can be investigated by searching for “old”, passively evolved spheroidal galaxies at high-. Such galaxies would have the distinctive signature of very red colours due to the absence of star formation and to the strong K-correction effect.
A population of extremely red objects (hereafter EROs) was indeed discovered with the combination of optical and near-IR imaging (e.g. Elston et al. 1988; McCarthy et al. 1992; Hu & Ridgway 1994). EROs are found in empty sky fields (e.g. Cohen et al. 1999; Thompson et al. 1999; Yan et al. 2000), in the vicinity of high- AGN (e.g. McCarthy et al. 1992; Hu & Ridgway 1994) and as counterparts of faint X-ray (e.g. Newsam et al. 1997; Lehmann et al. 1999) and weak radio sources (e.g. Spinrad et al. 1997). Their nature is still poorly known because their faintness hampers spectroscopic observations and because their colours are ambiguous. In fact, such colours can be due not only to an old stellar population, but also to strong dust reddening in a star-forming or active galaxy.
A clear example of this ambiguity is provided by HR10 (): its spectral energy distribution (SED) is consistent with that of an old elliptical at (Hu & Ridgway 1994), but optical, near-IR and submm observations proved that HR10 is a dusty starburst galaxy at (Graham & Dey 1996; Cimatti et al. 1998; Dey et al. 1999). Recent results showed that HR10 is not the only ERO detected in the submm, and that 10% of the faint submm population down to 850m fluxes of a few mJy could be EROs (Smail et al. 1999).
On the other hand, further observations suggested that also old (ages of Gyr) passively evolving galaxies populate the ERO class. The best examples are provided by LBDS 53W091 (; ; Dunlop et al. 1996; Spinrad et al. 1997), ERO CL 0939+4713B (; ; Soifer et al. 1999), and by most of the EROs at around the QSO 1213-0017 (Liu et al. 2000). Also near-IR spectroscopy confirmed that both dusty and old galaxies contribute to the ERO population (Cimatti et al. 1999).
Understanding the nature and deriving the abundance of EROs is important to shed light on the controversial issue of the deficit of high- elliptical galaxies: according to some results, the number of galaxies with the red colours expected for high- passively evolved spheroidals is lower compared to the predictions of passive luminosity evolution (e.g. Kauffmann, Charlot & White 1996; Zepf 1997; Franceschini et al. 1998; Barger et al. 1999). However, other works did not confirm the existence of such a deficit up to (e.g. Totani & Yoshii 1997; Benitez et al. 1999; Broadhurst & Bowens 1999; Schade et al. 1999).
As a first step to understand the nature of EROs, we started an imaging survey program aimed at selecting complete samples of such galaxies both in “empty” fields and around high- radio-loud AGN. In this paper, we present the results of our survey around radio-loud AGN at . The main motivations of such a survey are to investigate whether EROs are more numerous around high- AGN (as suspected in previous works; e.g. McCarthy et al. 1992; Dey et al. 1995), to select old passively evolving galaxies at by their optical/near-IR colours, to study the environment of high- radio-loud AGN (e.g. Hall, Green & Cohen 1998; Hall & Green 1998 and references therein), and to search for galaxy cluster candidates at . We recall that the most distant spectroscopically confirmed cluster known to date has (Stanford et al. 1997; Rosati et al. 1999). Other works selected cluster candidates around quasars at and suggested a significant heterogeneity of the cluster galaxies, including both passively evolving old ellipticals as well as younger and dusty systems (e.g. Hall & Green 1998; Liu et al. 2000). Throughout this paper we assume kms-1 Mpc-1, and unless otherwise stated.
2 Definition of the sample
The survey presented here is based on - and -band imaging. We observed totally 14 fields: 6 around radio galaxies (RGs) taken from the MRC sample selected at 408 MHz (McCarthy et al. 1997, Kapahi et al. 1998), 8 around radio-loud quasars (RLQs) taken from the PKS sample selected at 2.7 GHz (Wright & Ostrupcek 1990). We note that MRC1017-220 is a broad line radio galaxy (Kapahi et al. 1998). All the targeted AGN have , with the exception of the quasars PKS 1351-018 () and PKS 1556-245 (). The radio powers at rest-frame 5 GHz range from WHz-1 for RGs to WHz-1 for RLQs. Table 1 lists the relevant information about the sample. The fields were selected according to the redshifts of the AGN, to their Galactic latitude () and to their good observability during the telescope runs.
We have used the predictions of the Bruzual & Charlot (1999) evolutionary synthesis models to define a colour selection criterion capable to select a complete sample of EROs at high-. In particular, we used instantaneous burst models (also called simple stellar population models, SSP) with different redshifts of formation () to describe old spheroidal galaxies. In addition, we also considered models with exponential time-scale for the star formation rate, , with Gyr for respectively. Such models correspond to cases with low residual star formation at (i.e. M⊙yr-1 for a galaxy with mass M M⊙), and they are capable to reproduce the colours and the spectra of local ellipticals, as well as the faint galaxy optical colour and redshift distributions (Pozzetti, Bruzual & Zamorani 1996). A Salpeter IMF ( M⊙) and solar metallicity have been adopted. Models with Scalo IMF or with supersolar metallicities reach even redder colours at high-. Optical to near-IR colours derived from the adopted evolutionary models are shown in Fig. 1 for two cosmologies ( kms-1 Mpc-1, ).
The colour selection threshold adopted in our survey is . This allows us to select old galaxies at formed at in both cosmologies. It is relevant to note that for 0.3 Gyr and , colours are never reached. In other words, colours select old galaxies which had a short episode of star formation in early cosmological epochs. For instance, assuming no dust extinction, a galaxy at 1.5 with should have , an age 2 Gyr () or 3 Gyr () and M⊙yr-1.

| Object | Type | z | P5GHz | Seeing() | t() | Area() | Area() | ||||
|---|---|---|---|---|---|---|---|---|---|---|---|
| WHz-1 | mag | arcsec | sec | arcmin2 | arcmin2 | ||||||
| MRC1017-220 | RG | 1.768 | 0.49 | -0.95 | 0.23 | 1.1 | 4680 | 2.49 | 3.08 | 19.0 | 3 |
| MRC1040-285 | RG | 1.630 | 0.17 | -0.67 | 0.14 | 1.2 | 5228 | 2.88 | 2.88 | 19.1 | 2 |
| MRC1048-272 | RG | 1.558 | 0.44 | -0.73 | 0.27 | 1.3 | 3780 | 2.95 | 3.31 | 18.9 | 3 |
| MRC1131-269 | RG | 1.711 | 0.18 | -0.71 | 0.24 | 1.0 | 4200 | 2.82 | 2.82 | 18.9 | 1 |
| PKS1143-245 | RLQ | 1.950 | 1.30 | -0.18 | 0.22 | 1.0 | 3920 | 2.65 | 2.84 | 18.9 | 0 |
| PKS1148-001 | RLQ | 1.976 | 2.90 | -0.48 | 0.03 | 1.0 | 4200 | 2.73 | 3.00 | 18.9 | 0 |
| PKS1148-171 | RLQ | 1.751 | 0.50 | -0.30 | 0.04 | 1.2 | 4320 | 2.88 | 3.49 | 18.9 | 0(1)∗ |
| MRC1217-276 | RG | 1.899 | 0.16 | -1.20 | 0.31 | 1.2 | 5180 | 2.75 | 3.32 | 18.9 | 0 |
| MRC1259-200 | RG | 1.580 | 0.39 | -1.05 | 0.24 | 1.0 | 4320 | 3.66 | 3.66 | 18.9 | 0 |
| PKS1351-018 | RLQ | 3.707 | 1.90 | +0.04 | 0.11 | 1.1 | 4320 | 2.35 | 2.79 | 18.9 | 2 |
| PKS1354-152 | RLQ | 1.890 | 1.80 | -0.50 | 0.24 | 1.0 | 4200 | 3.33 | 3.33 | 19.0 | 0 |
| PKS1403-085 | RLQ | 1.763 | 0.63 | -0.33 | 0.06 | 1.0 | 4200 | 2.83 | 2.83 | 19.0 | 0 |
| PKS1504-164 | RLQ | 1.790 | 0.40 | -0.68 | 0.42 | 1.0 | 3744 | 2.76 | 2.76 | 18.9 | 0(2)∗∗ |
| PKS1556-245 | RLQ | 2.813 | 1.50 | -0.40 | 0.51 | 1.0 | 4200 | 2.90 | 3.25 | 19.0 | 0 |
Columns: (2) RG: radio galaxy; (3) RLQ: radio-loud quasar; (4) P5GHz: radio power at rest-frame 5 GHz; (5) : radio spectral index between 2.7 GHz and 5.0 GHz () according to the NASA/IPAC Extragalactic Database (NED); (6) : Galactic extinction in -band; (7) t(): total integration time in -band; (8) Area(): common area between the - and the -band images; (9) Area(): area covered by the -band image; (10) : -band magnitude corresponding to the 100% completeness level; (11) : number of objects with and . ∗: the field of PKS 1148-171 contains one object with and ( lower limit). ∗∗: the field of PKS 1504-164 contains two objects with and and ( lower limits).
3 Observations, data reduction and photometry
Near-infrared imaging was done on 1997 April 1-3 with the ESO/MPI 2.2m telescope with the IRAC2B camera (Moorwood et al. 1992) equipped with a 256256 HgCdTe array (0.506′′/pixel). We used the filter in order to reduce the thermal noise. The sky conditions were photometric and the seeing was around 1.0′′. The observations were done taking a number of background-limited images (typically 10-14) with the telescope moved between each image. In each telescope position, the exposures were typically 120 seconds long (e.g. 12 images each with an exposure time of 10 seconds). The data reduction was performed using the IRAF reduction package and using the method outlined by Villani & di Serego Alighieri (1999). Photometric calibration was obtained observing standard stars from the Carter & Meadows (1995) sample. The typical night-to-night scatter in the zero-points was around 0.03 magnitudes. The conversion from to magnitudes in the SAAO-Carter system was done following Lidman & Storm (1995) and Lidman (1997, private communication).
Optical imaging was done in service mode from February 1997 to April 1997 with the ESO NTT 3.5m telescope equipped with the SUSI camera (10241024 CCD, 0.130′′/pixel). The conditions were photometric and the seeing ranged from 0.6′′ to 1.2′′. The observations were done taking 5-6 images (each with a duration of 600 seconds) with the telescope moved 10 arcsec between each exposure. The total integration time in each field was 3000 seconds, with the exceptions of MRC1040-285 and PKS1351-018 where it was 3600 seconds. The photometric calibration was obtained using the Landolt (1992) standard stars. The typical night- to-night scatter of the zero-points was around 0.05 mag. The correction for the atmospheric extinction was done using the -band coefficients () derived by the Swiss Telescope at La Silla during the nights of our NTT observations (see Burki et al. 1995), and converting them to -band extinction adopting according to the average atmospheric extinction curve of La Silla. The data were reduced using IRAF. A “super” flat-field image was obtained by taking the median of 60 images of the observed AGN fields and rejecting the discrepant pixels. After subtracting the bias and dividing for the flat-field image, the individual frames of each field were coadded in order to obtain the final images.
Photometry was done using the SExtractor image analysis package (Bertin & Arnouts 1996). The detection threshold was set to of the background intensity in a contiguous area of 1 seeing FWHM. We first identified and extracted the objects in the -band images, and then we cross-correlated them with the -band images. The depth of the -band images is rather homogeneous, providing a for objects with (with a 3′′ diameter photometric aperture). The magnitudes were measured in 3′′ diameter apertures and converted to 6′′ magnitudes by applying the aperture corrections estimated from field stars. Such corrections are typically in the range of 0.08-0.15 and 0.04-0.10 magnitudes in - and - bands respectively. Photometric errors were estimated according to the poissonian noise from the objects and from the background. Finally, the magnitudes were corrected for Galactic extinction using the values derived from the extinction maps of Burnstein & Heiles (1982) and adopting and (see Table 1).
The completeness in each field was estimated by constructing a background image for each field and adding random simulated objects with Moffat profiles consistent with the observed seeing. The simulated objects were then detected with SExtractor as a function of magnitude. The completeness is rather homogeneous among all the fields. The global completeness of the whole - selected sample is 100% for and it decreases to about 80% for . The common sky area covered by - and -band imaging is 40.0 arcmin2. At , only 3 objects are undetected in -band (see Figure 3).
4 -band galaxy counts
The main uncertainty in galaxy counts comes from the star–galaxy separation. Because of the poor pixel sampling in the IRAC2B images, the morphological classifier used by SExtractor is more reliable at moderately bright magnitudes. Such classifier, called “stellarity index” (), is by definition equal to 1.0 for stars and to 0.0 for galaxies. We found that provided a reliable classification of stellar objects at 17.5. We then decided to statistically subtract the star counts using the method outlined by Saracco et al. (1997): taking advantage of the good seeing and better sampling of the SUSI images, we extracted a subsample of objects that were reliably classified as stellar in the -band. In order to assess the fraction of objects that are misclassified in the near-IR images, we computed the ratio , where and are the number of objects that SExtractor classifies as stars (i.e. with ) respectively in the IRAC2B and in the SUSI images. The ratio was computed as a function of the -band magnitude over a range 15.019.0. As expected, for 15.017.0, indicating that SExtractor correctly classifies the stellar objects at moderately bright -band magnitudes. However, the classification efficiency drops to for 17.019.0, showing that at fainter -band magnitudes SExtractor underestimates the number of stars in IRAC2B images.

The galaxy counts were then corrected adopting the values computed for each -band magnitude bin. We excluded from the counts the objects lying at from the edges of the images in order to avoid photometric uncertainties due to edge effects. This implied a reduction of the useful total area of the 14 fields from 46.4 arcmin2 to 43.4 arcmin2.
Table 2 and Figure 2 show the galaxy counts in -band as derived from the observed fields compared with the literature averaged counts of Hall & Green (1998) and the counts of the wide-field (181 arcmin2) survey of Minezaki et al. (1998). For , our counts are consistent with the average literature counts. For the counts seem to have a systematic excess of a factor of 1.2-1.5 respect to average literature counts. For the counts are incomplete in most of the fields (see Tab 2). In order to provide an estimate of the field-to-field variations of the counts, we do not show their poissonian uncertainties, but the their rms derived from the different fields.
We also tried an alternative approach deriving the -band counts by selecting objects with -band “stellarity index” from the total area in common between the - and the -band images (40 arcmin2). Within the poissonian uncertainties, we obtained results consistent with the previous method, thus independently confirming the existence of an excess of counts for (see Figure 2).
| Completeness | |||
|---|---|---|---|
| 16.3 | 100% | 1092 | 300 |
| 16.8 | 100% | 1523 | 355 |
| 17.3 | 100% | 4250 | 596 |
| 17.8 | 100% | 7603 | 793 |
| 18.3 | 100% | 9587 | 890 |
| 18.8 | 100% | 16918 | 1183 |
| 19.3 | 70% | 14907 | 1112 |
: number density of galaxies deg-2 mag-1; : poissonian uncertainty on .
5 The morphologies of EROs
Figure 3 shows the colour magnitude diagram for all the objects (stars+galaxies) extracted from the 40 arcmin2 of our RG and RLQ fields in common between the - and the -band imaging. At and at , 8 and 11 objects with are selected respectively. The faintest EROs have and they are detected at significance level in the -band. In addition, we found three objects which are clearly detected in the -band at , but which are invisible in the -band. Their lower limits on the colours are in the range of (see Tab. 1 and Fig. 3).

As discussed by Thompson et al. (1999) and Cuby et al. (1999), low mass stars and brown dwarfs can contribute to the population of very red objects. A visual inspection of the detected objects with suggested a clear non-stellar morphology for most of them. However, in order to establish more quantitatively if our sample is contaminated by stars, we analyzed the morphology of the objects by means of their “stellarity” indices in - and in -band, and .
The stellarities in -band are in the range of , and clustered around =0.35, indicating that the morphologies are rather ambiguous in the optical. This is not surprising because the objects with are so faint in the optical () that the morphological classifier becomes less reliable at such low flux levels. Thus, the morphological analysis can be better done in the -band. In the sample, one object is unresolved (), one is ambiguous (), and six are clearly non-stellar (). In the sample, one object is unresolved, three are ambiguous (), and seven are clearly non-stellar (). We noticed that the FWHM of the ambiguous objects is times larger than the seeing, suggesting that such objects may be compact galaxies rather than stars. Among the three objects undetected in , one is clearly non-stellar () and the other two are compact (both have ).
In order to have more clues, we also used other two morphological parameters provided by SExtractor: the elongation and the ellipticity, which should be respectively equal to 1.0 and 0.0 for perfect stellar objects. In our -band images, we found that, for reliable stellar objects () their average values are respectively and , whereas the objects with have values in the range of 1.21-2.39 and 0.14-0.58 respectively. The only exception is the object with which, consistently with its stellarity index, has an elongation of 1.15 and an ellipticity of 0.13. The analysis of the elongation and the ellipticity favours the detected objects with being mostly non-stellar objects.
6 The surface density of EROs
6.1 Our AGN fields
The total surface densities of EROs with averaged over the 14 observed fields derived for the and the samples are respectively 0.200.07 and 0.280.08 objects arcmin-2. However, we notice that there are strong variations of the density of objects with from field to field, reaching values as high as 1 arcmin-2 in some of the observed fields (see Tab. 1). The errors indicated in this section are 1 poissonian uncertainties.
The average densities decrease respectively to 0.180.07 and to 0.250.08 objects arcmin-2 if we exclude the unresolved object. Thus, the average density of galaxies with is in the range of 0.15-0.18(0.06-0.07) objects arcmin-2 for the sample, depending on the exclusion or the inclusion of the object with ambiguous morphology. For the sample, the galaxy density is 0.18-0.25 (0.07-0.08) arcmin-2, but it could increase to 0.330.09 arcmin-2 in case the 3 objects undetected in -band were galaxies with . If we exclude from our sample the densest fields of MRC 1017-220 and MRC 1040-285, the density of objects with and decreases to arcmin-2.
6.2 Hall & Green (1998) RLQ fields
The average surface density of EROs derived in our fields has been compared to that of the Hall & Green (1998) sample (30 fields around RLQs at covering a total area of 213.7 arcmin2). First of all, the -band magnitudes of Hall & Green (1998) have been transformed to using their relation , and their -band magnitudes have been scaled to our photometric system using the conversions of Carter (1993) adopting , consistently with the extreme colors of EROs (e.g. Hu & Ridgway 1994). However, we note that the results do not change if we adopt a bluer color such as . From the Hall & Green (1998) sample, we estimate that the densities of galaxies with are 0.210.03 arcmin-2 and 0.290.04 arcmin-2 at and respectively. Such densities agree very well with those estimated in our AGN fields.
6.3 Field surveys
Our derived surface densities have been also compared to the results of surveys of the general field (i.e. not around high- AGN) based on - and -band photometry. In this respect, the main reference survey is that of of Thompson et al. (1999) because it has the widest field coverage available to date (154 arcmin2), and it is therefore the least affected by the field-to-field variations present in other surveys with areas about an order of magnitude smaller. Since Thompson et al. (1999) made use of non-standard filters ( and ), we derived colour and magnitude thresholds consistent with our photometric system adopting the relations (Thompson, private communication; see also Wainscoat & Cowie 1991) and , and (valid for , Huang & Thompson, private communication). We adopted because the observed colors of most EROs are in the range of (Thompson, private communication; see also Hu & Ridgway 1994; Spinrad et al. 1997; Stanford et al. 1997; Soifer et al. 1999; Stiavelli et al. 1999; Yan et al. 2000).
Excluding the 2 EROs in the Thompson et al. sample which are spectroscopically confirmed stars, we found that the densities of EROs are 0.050.02 arcmin-2 (8 objects) and 0.110.03 arcmin-2 (17 objects) at and respectively. We mention here that Daddi et al. (2000), who performed a survey for EROs covering a field of 701 arcmin2 and 447 arcmin2 to and respectively, found surface densities of EROs with fully consistent with those of Thompson et al. (1999).
We also derived the density of galaxies with from the combination of other three field surveys: McLeod et al. (1995) (14.7 arcmin2), Cohen et al. (1999) (14.6 arcmin2), and from the two control fields of Hall & Green (1998) (18.8 arcmin2). The -band magnitudes of the literature samples have been scaled to our photometric system using the transformations of Carter (1993) and assuming an average colour of , but the results do not change if we assume . The -band magnitudes of Hall & Green (1998) have been transformed to as described in section 6.2. Only three galaxies with and are present in the joint sample of such surveys over a total area of 48.1 arcmin2. The derived surface density is 0.060.04 arcmin-2 which is consistent with that of Thompson et al. (1999).
The above comparisons imply that there is a overdensity of galaxies with in fields around radio-loud AGN at compared to the general field. At and the average density in our AGN fields is respectively a factor of 4 and 2.5 higher than the density in the general field derived by Thompson et al. (1999). In particular, if we take the field densities of Thompson et al. (1999), we expect 2 and 4.4 EROs with respectively and in our 40 arcmin2 survey. The Poisson probability of our observing 8 and 11 EROs with and is 0.086% and 0.37%, implying an overdensity at 99.9% and 99.6% confidence levels respectively. However, it is also important to notice that strong field-to-field variations are present in our survey, and that in some of the fields the density of EROs is about 10 times higher than in the general field (see Tab.1). Our results suggest that the strong field-to-field variations are due to presence of high- clusters in some of the observed fields. It is relevant to mention here that other observations found evidence of ERO overdensities around high- AGN (e.g. McCarthy et al. 1992; Dey et al. 1995; Hall & Green 1998; Clements 2000; Liu et al. 2000).
7 Color distributions
7.1 Comparison with field galaxies
In order to investigate the colour properties of all the galaxies detected in the 14 AGN fields, we compared their colours with those of 245 field galaxies selected from the samples of McLeod et al. (1995), Cohen et al. (1999), and Hall & Green (1998). First of all, in order to check the validity of our field sample, we compared the average colours of our literature sample with those of the Thompson et al. (1999) sample. For and , we found average colours ( and respectively) which are consistent with those derived by Thompson et al. (1999) in their survey ( and respectively).
Figure 4 shows the colour distributions of the galaxies selected from the literature field sample and from our AGN fields. Since both distributions contain lower limits on the colours, we used the ASURV Rev 1.2 statistical software package (see LaValley, Isobe & Feigelson 1992).

As already suggested by Figure 4, we found that the galaxies with selected in AGN fields are redder than those selected from the general field. In particular, all the statistical tests available in ASURV show consistently that the two distributions are different at 99.99% () significance level. Such result does not change significantly if we split our total sample into the RG and the RLQ sub-samples: the RG sample is redder than the literature field sample at 99.99% significance, whereas the RLQ sample is redder at % significance level.
If we exclude from this analysis the four fields with the highest densities of EROs (i.e. MRC1017-220, MRC1040-285, MRC1048-272 and PKS1351-018), the result does not change significantly: the galaxies in the AGN fields continue to be redder than the field galaxies at 99.95% confidence level (about 3.5). This suggests that red colour excess is not due to particularly overdense fields, but to the general population of galaxies in all the AGN fields. Such results strengthens the result on the overdensity of EROs with discussed in the previous section.
Finally, we found that the mean colours estimated with the Kaplan-Meier estimator for the literature, (RG+RLQ), RG, and RLQ samples are respectively: 3.717, 4.108, 4.289, and 3.921.
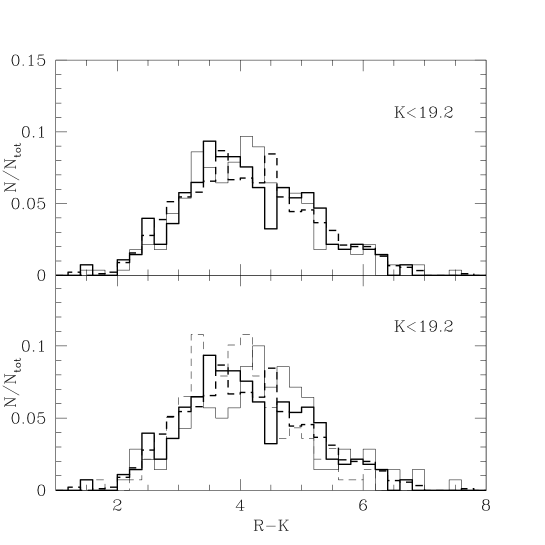
7.2 Comparison with literature AGN fields
It is also important to compare the colour distributions of the galaxies in our AGN field sample with other samples of AGN fields taken from the literature. To this purpose, we used the data collected by Hall & Green (1998) observing 30 fields containing radio-loud quasars: 10 at redshifts , and 20 at . The 5 GHz radio powers of such quasars span the range log P WHz-1. From the Hall & Green (1998) sample we selected 278 and 899 galaxies with respectively in the quasar redshift ranges and . Figure 5 already shows that the colour distributions of the galaxies in our fields and in the Hall & Green (1998) quasar fields look very similar. This is confirmed by the statistical tests which show that the colours of the galaxies in our (RG+RLQ), RG and RLQ fields are not significantly different from those of the Hall & Green (1998) fields, irrespective of the redshift range. The results of sections 7.1 and 7.2 do not significantly change if the two RLQs with are excluded (PKS1351-018 and PKS1556-245).
7.2.1 RGs vs. RLQs
The results discussed in section 7.1 show that our RG and RLQ sub-samples have different average colours (=4.289 vs. =3.921 respectively). Such a difference is also confirmed by the comparison of their colour distributions, for which the statistical tests indicate that the two distributions are different at 99.9% confidence level. However, because of the limited statistics of our survey (only 6 RG fields vs. 8 RLQ fields), we have compared the colour distributions of the RG fields with the colour distribution of large Hall & Green (1998) quasar sample (30 fields at ). The statistical tests indicated that the two distributions are not signficantly different (i.e. they are different at level). The result does not significantly change if we add our RLQ sample to the Hall & Green (1998) sample, and if subsamples in different redshift bins are considered (e.g. and ). Again, the results do not change if we exclude PKS1351-018 and PKS1556-245 from the statistical analysis. Our conclusion is that the colour difference that we found between our RG and RLQ sub-samples is probably due to the limited statistics of our survey rather than to a real diversity.
7.3 Searching for radial trends
Despite the rather shallow -band depth of our sample and the limited sky area covered by each -band image, we investigated the possible existence of correlations of the radially-averaged colour and the number density of galaxies with the radial projected distance from the AGN. This is useful to test if there is a tendency of the reddest galaxies to lie closer to the AGN, and to investigate whether the AGN tend to be located in denser environments, as found by Hall & Green (1998). Figure 6 shows the radial dependences of the average and number density of galaxies with in 5 arcsec wide bins. The results are strongly influenced by the limited statistics, and no significant trends are visible. However, we notice that the average seems to be higher going closer to the AGN. Should such trend be confirmed by deeper imaging, this would mean that the reddest galaxies are preferentially located close to the AGN. We also note that in the bins closer to the AGN the galaxy number density seems to be systematically higher than the density of galaxies in the general field. Finally, we mention that our sample is not deep enough to allow us an evaluation of the cluster richnesses using estimators such as the Hill & Lilly (1991) statistic.

8 Main implications
The main finding of our survey is the discovery of an excess of red galaxies in fields around radio galaxies and radio-loud quasars at . Our results are in good agreement with the ones of the Hall & Green survey around RLQs at . Being our survey rather shallow () and based only on two-band photometry, deep multi-colour photometry and spectroscopy are needed to unveil the redshifts and the nature of the excess red galaxies. With the present results, we can simply envisage two main possible scenarios to explain our finding.
(A) The excess galaxies are at the same resdhift of the AGN () in the field, and they represent the “tip of the iceberg” of the clusters or the groups where the AGN live. This possibility is generally supported by previous works which showed that RLQs and RGs are sometimes found in rich environments over a wide range of reshifts: (e.g. Yee & Green 1987; Elligson, Yee & Green 1991; Hill & Lilly 1991; Deltorn et al. 1997), (Aragon-Salamanca et al. 1996; Le Fevre et al. 1996; Pascarelle et al. 1996; Dickinson 1997; Yamada et al. 1998; Hall & Green 1998; Pentericci et al. 1998). On the other hand, it is relevant to recall here that radio-quiet QSOs at most redshifts are found in lower density environments (e.g. Elligson et al. 1991; Teplitz et al. 1999 and references therein).
A first possibility is that the observed EROs are star-forming galaxies strongly reddened by dust extinction (e.g. Cimatti et al. 1998; Dey et al. 1999; Smail et al. 1999). In such a case, an excess of dusty star-forming galaxies may suggest that high- radio-loud AGN live in environments characterized by an intense star-formation activity. In this respect, it is relevant to mention that Ivison et al. (2000) recently found an excess of submm sources with possible ERO counterparts around the radio galaxy 4C 41.17, suggesting an excess of dust enshrouded star formation in a proto-cluster environment. Such result, if confirmed and generalized to other cases, would be relevant to strengthen a scenario where high- radio-loud AGN live in rich environments where strong star formation is taking place.
Alternatively, the observed EROs could be passively evolving spheroidals with negligible or no ongoing star formation activity, indicating that some of the observed AGN may live in clusters or groups where, similarly to lower- clusters, old and luminous spheroidals represent a substantial fraction of the galaxies.
Follow-up deep imaging and spectroscopy of the most overdense fields (e.g. MRC 1017-220 and MRC 1040-285) is under way in order to verify the existence of clusters at . Preliminarly, near-infrared spectroscopy of two of the reddest galaxies in the field of MRC 1017-220 () suggested that their redshifts are and that their SEDs are consistent with that of 2-3 Gyr-old elliptical galaxies with no dust extinction (Cimatti et al. 1999), strengthening the hypothesis that the red galaxies are probably at the same redshift of the AGN.
Assuming that the excess galaxies are ellipticals at the reshifts of the AGN, we estimated their rest-frame -band absolute magnitudes in case of formation redshift . For the cases at and adopting , we obtain that are in the range of -25.5-26.5 and -26-27.5 for (, Gyr) and (, Gyr) respectively. If compared with of the local luminosity function of elliptical galaxies (, Marzke et al. 1998), such luminosities suggest that the observed EROs have rest-frame and for (, Gyr) and (, Gyr) respectively.
In the case of PKS 1351-017, if the EROs in its field were at , their would be in the range of -26.5-27.5 and -28-29.5 for (, Gyr) and (, Gyr) respectively, implying very high luminosities ( for , Gyr), and probably too high () in the case of (, Gyr). However, we notice that if the local evolves and increases at high-, as suggested by some recent works (e.g. Glazebrook et al. 1995; Schade et al. 1999), the luminosity of the EROs in excess over the local would be reduced.
In this regard, it is important to emphasize that the presence of moderately bright galaxies with extreme red colours such as strongly suggests the existence a population of passively evolving “old” galaxies at whose colours can be explained only if their formation redshifts are . Should this result be confirmed by the redshift measurements of the most extreme EROs, this would provide very stringent clues on the earliest epoch of massive galaxy formation (see for instance Spinrad et al. 1997).
(B) The second scenario is that the excess red galaxies are at and physically unrelated to the AGN.
First of all, the observed EROs could be dust reddened starburst galaxies. For instance, HR10 provides a clear case of a foreground star-forming galaxy at located in the field of a quasar at (Hu & Ridgway 1994). In this respect, the two EROs that we detected in the field of PKS 1351-017 may be foreground objects unrelated to the quasar.
If , extreme colours such as can be reached only if the galaxies formed at for instantaneous burst models or for models with or 0.3 Gyr (see Fig. 1). In such a case, the detected EROs would represent moderately old and very luminous passively evolving galaxies at , and they would provide important clues on the existence of “aged” galaxies at high-. Although the existence of such galaxies is in principle possible, the fraction of galaxies with and expected in galaxy formation models is extremely small, ranging from 1% in PLE scenarios (e.g. Pozzetti et al. 1996) to 0% in hierarchical models (e.g. Kauffmann & Charlot 1998). This means that in our fields we expect at most 4 galaxies with and . We notice here that at , no galaxies with have been spectrospically identified yet in the redshift surveys of Cowie et al. (1996) and Cohen et al. (1999).
The other possibility is that the red galaxies are part of foreground clusters or structures at . Although this case is realistic, it does not easily explain why radio-loud AGN are preferentially seen through foreground structures (in order to explain the excess of EROs around radio-loud AGN). In this case, it is tempting to speculate whether the mass of such foreground structure and the geometry of the system can produce gravitational lensing effects on the background AGN. A similar scenario was already suggested by Hammer & Le Fevre (1990).
At a speculative level, we can envisage a scenario where the light coming from the AGN is gravitationally amplified by foreground massive structures, producing a selection effect where the AGN that would not be selected in flux-limited surveys are actually selected thanks to the amplification of the flux due to the gravitational lensing. In this respect, we notice that the 408 MHz fluxes of some of the AGN found in the richest environments (e.g. MRC 1017-220, MRC 1040-285) are in the range of 1030-1090 mJy, i.e. only 8-15% higher than the selection threshold of the MRC radio survey (0.95 Jy at 408 MHz) (see McCarthy et al. 1997 and references therein). This means that, assuming that the intrisic non-lensed flux of the sources is just below 0.95 Jy, a small gravitational amplification of the flux by a factor of 10-15% would push these AGN above the selection threshold of the survey. The ability of clusters of galaxies to gravitationally lens extended sources is clearly demonstrated by the luminous arcs which are background galaxies (i.e. extended sources) distorted and amplified by the cluster potential (e.g. Smail et al. 1995). Although in our case the geometry is different, i.e. the distance of the lens is not much smaller than that of the source, we are only considering small magnification factors which could involve even only one radio lobe, whose size is smaller or similar to that of galaxies in the optical.
To summarize, the present data do not allow us to explore in more details the validity of the possible scenarios. However, according to the above discussion, we can conclude that, based on their colours and -band magnitudes, the excess red galaxies around the AGN are likely to be at , hence favoring the scenario where radio-loud AGN at live in rich environments, or the case where the red galaxies are at . The former case is relevant to understand the genesis of the AGN phenomenon, the relationships between radio-quiet and radio-loud AGN and for the use of radio-loud AGN as tracers of cluster and massive structures of galaxies at high-. Follow-up optical and near-IR spectroscopy and submillimetre photometry of the selected EROs is under way in order to unveil their nature and their role in the framework of galaxy formation and evolution.
Acknowledgments
We are grateful to J. Cohen and P. Hall for providing the colours and the magnitudes of their galaxy samples, to D. Thompson for useful information on the CADIS photometric system and on the colors of the CADIS EROs, to C. Lidman for the information on the IRAC2b photometric calibration, to D. Silva for his assistance in the use of the SUSI data taken in service observing, and to G. Bruzual and S. Charlot for providing their spectral synthesis models. We acknowledge the anonymous referee for the useful comments. This research has made use of the NASA/IPAC Extragalactic Database (NED) which is operated by the Jet Propulsion Laboratory, California Institute of Technology, under contract with the National Aeronautics and Space Administration. L.P. acknowledges the support of a research grant from Consorzio Nazionale Astronomia e Astrofisica (CNAA) during the development of this project.
References
- [1] Aragon-Salamanca A., Ellis R.S., O’Brien K.S. 1996, MNRAS, 281, 945
- [2] Barger A.J., Cowie L.L., Trentham N., Fulton E., Hu E.M., Songaila A., Hall D. 1999, AJ, 117, 102
- [3] Benitez N., Broadhurst T.J., Bouwens R.J., Silk J., Rosati P. 1999, ApJ, 515, L65
- [4] Bertin E., Arnouts S. 1996, A&A, 117, 393
- [5] Broadhurst T.J., Bouwens R.J. 1999, ApJ, in press (astro-ph/9903009)
- [6] Bruzual G., Charlot S. 1999, private communication
- [7] Burnstein D., Heiles C. 1982, AJ, 87, 1167
- [8] Burki G., Rufener F., Burnet M., Richard C., Blecha A., Bratschi P. 1995, A&AS, 112, 383.
- [9] Carter B.S. 1993, in Precision Photometry, eds. D. Kilkenny , E. Lastovica, J.W. Menzies, SAAO, Cape Town, p. 100
- [10] Carter B.S., Meadows V.S. 1995, MNRAS, 276, 734
- [11] Cimatti A., Andreani P., Röttgering H., Tilanus R. 1998, Nature, 392, 895
- [12] Cimatti A., Daddi E., di Serego Alighieri S., Pozzetti L., Mannucci F., Renzini R., Zamorani G., Andreani P., Röttgering H.J.A. 1999, A&A, 352, L45
- [13] Clements D.L. 2000, MNRAS, in press (astro-ph/0002101)
- [14] Cohen J.G., Blandford R., Hogg D.W., Pahre M.A., Shopbell P.L., ApJ, 512, 30
- [15] Cowie L.L., Songaila A., Hu E.M., Cohen J.G. 1996, AJ, 112, 839
- [16] Cuby J.-G., Saracco P., Moorwood A.F.M., D’Odorico S., Lidman C., Comeron, Spyromilio J. 1999, A&A, in press (astro-ph/9907028)
- [17] Daddi E., Cimatti A., Pozzetti L., Hoekstra H., Röttgering H.J.A., Renzini A., Zamorani G., Mannucci F. 2000, A&A submitted (astro-ph/0005581)
- [18] Deltorn J.M., Le Fevre O., Crampton D., Dickinson M. 1997, ApJ, 483, L21
- [19] Dey A., Spinrad H., Dickinson M. 1995, ApJ, 440, 515
- [20] Dey A., Graham J.R., Ivison R.J., Smail I., Wright G.S. 1999, ApJ, 519, 610
- [21] Dickinson M. 1997, in HST and the High Redshift Universe, ed. N. Tanvir, A. Aragon-Salamanca, and J.V. Wall, (Singapore: World Scientific, p. 207
- [22] Dunlop J.S., Peacock J.A., Spinrad H., Dey A., Jimenez R., Stern D., Windhorst R.A. 1996, Nature, 381, 581
- [23] Eggen O.J., Lynden-Bell D., Sandage A.R. 1962, 136, 748
- [24] Ellingson E., Yee H.K.C., Green R.F. 1991, ApJ, 371, 49
- [25] Elston R., Rieke G.H., Rieke M. 1988, ApJ, 331, L77
- [26] Franceschini A., Silva L., Fasano G., Granato L., Bressan A., Arnouts S., Danese L. 1998, ApJ, 506, 600
- [27] Glazebrook K., Peacock J.A., Miller L., Collins C.A. 1995, MNRAS, 275, 169
- [28] Graham, J.R., Dey, A. 1996, ApJ, 471, 720
- [29] Hall P.B., Green R.F., Cohen M. 1998, ApJS, 119, 1
- [30] Hall P.B., Green R.F. 1998, ApJ, 507, 558
- [31] Hill G., Lilly S. 1991, ApJ, 367, 1
- [32] Hu E.M., Ridgway S.E. 1994, AJ, 107, 1303
- [33] Ivison R.J., Dunlop J.S., Smail I., Dey A., Liu M.C., Graham J.R. 2000, ApJ, in press (astro-ph/0005234)
- [34] Kapahi V.K., Athreya R.M., van Breugel W., McCarthy P.J., Subrahmanya C.R. 1998, ApJS, 118, 275
- [35] Kauffmann G., Charlot S., White S.D.M 1996, MNRAS, 283, 117
- [36] Kauffmann G., Charlot S. 1998, MNRAS, 297, L23
- [37] Landolt A.U. 1992, AJ, 104, 340
- [38] LaValley M., Isobe T., Feigelson E.D. 1992, in Astronomical Data Analysis Software and Systems I, A.S.P. Conference Series, Vol. 25, D.M. Worrall, C. Biemesderfer & J. Barnes eds., p. 245.
- [39] Le Fevre O., Deltorn J.M., Dickinson M. 1996, ApJ, 471, L11
- [40] Lehmann I., Hasinger G., Schmidt M., Gunn J.E., Schneider D.P., Giacconi R., McCaughrean M., Trümper J., Zamorani G. 1999, A&A, in press (astro-ph/9911484)
- [41] Hammer F., Le Fevre O. 1990, ApJ, 357, 38
- [42] Larson R.B. 1975, MNRAS, 173, 671
- [43] Lidman C., Storm J. 1995, in IRAC-2b Report on Test Observations IV, ESO.
- [44] Liu M.C., Dey A., Graham J.R., Bundy K.A., Steidel C.C., Adelberger K., Dickinson M.E. 2000, AJ, in press (astro-ph/0002443)
- [45] Marzke R.O., Da Costa L.N., Pellegrini P.S., Willmer C.N.A., geller M.J. 1998, ApJ, 503, 517
- [46] McCarthy P.J., Persson S.E., West S.C. 1992, ApJ, 386, 52
- [47] McCarthy P.J., Kapahi V.K., van Breugel W., Persson S.E., Athreya R., Subrahmanya C.R. 1996, ApJS, 107, 19
- [48] McLeod B.A., Bernstein G.M., Rieke M.J., Tollestrup E.V., Fazio G.G. 1995, ApJS, 96, 117
- [49] Minezaki T., Yukiyasu K, Yoshii Y., Peterson B.A. 1998, ApJ, 494, 111
- [50] Moorwood A., Finger G., Biereichel P., Delabre B., van Dijsseldonik A., Huster G., Lizon J.-L., Meyer M., Gemperlein H., Moneti A. 1992, The Messenger, 69, 61
- [51] Newsam A.M., McHardy L.M., Jones L.R., Mason K.O. 1997, MNRAS, 292, 378
- [52] Pascarelle S.M., Windhorst R.A., Driver S.P., Ostrander E.J., Keel W.C. 1996, ApJ, 456, L21
- [53] Pentericci L., Röttgering H.J.A., Miley G.K., Carilli C.L, Mccarthy P.J. 1997, A&A, 326, 580
- [54] Pozzetti L., Bruzual A.G., Zamorani G. 1996, MNRAS, 281, 953
- [55] Rosati P., Stanford S.A., Eisenhardt P.R., Elston R., Spinrad H., Stern D., Dey A. 1999, AJ, in press (astro-ph/9903381)
- [56] Saracco P., Iovino A., Garilli B., Maccagni D., Chincarini G. 1997, AJ, 114, 887
- [57] Schade D., Lilly S.J., Crampton D., Ellis R.S., Le Fèvre O., Hammer F., Brinchmann J., Abraham R., Colless M., Glazebrook K., Tresse L., Broadhurst T. 1999, ApJ, in press (astro-ph/9906171)
- [58] Soifer B.T., Matthews K., Neugebauer G., Armus L., Cohen J.G., Persson S.E. 1999, AJ, in press (astro-ph/9906464)
- [59] Smail I., Couch W.J., Ellis R.S., Sharples R.M. 1995, ApJ, 440, 501
- [60] Smail I., Ivison R.J., Kneib J.-P., Cowie L.L., Blain A.W., Barger A.J., Owen F.N., Morrison G. 1999, MNRAS, 308, 1061
- [61] Spinrad H., Dey A., Stern D., Dunlop J., Peacock J., Jimenez R., Windhorst R. 1997, ApJ, 484, 581
- [62] Stanford S.A., Elston R., Eisenhardt P.R., Spinrad H., Stern D., Dey A. 1997, AJ, 114, 2232
- [63] Stiavelli M., Treu T., Carollo M., Rosati P., Viezzer R., Casertano S., Dickinson M., Ferguson H., Fruchter A., Madau P., Martin C., Teplitz H. 1999, A&A, 343, L25.
- [64] Teplitz H.I., McLean I.S., Malkan M.A. 1999, ApJ, 520, 469
- [65] Thompson D., Beckwith S.V.W., Fockenbrock R., Fried J., Hippelein H., Huang J.-S., von Kuhlmann, Ch. Leinert, Meisenheimer K., Phleps S., Röser H.-J., Thommes E., Wolf C. 1999, ApJ, in press
- [66] Totani T., Yoshii J. 1997, ApJ, 501, L177
- [67] Villani D., di Serego Alighieri S. 1999, A&AS, 135, 299
- [68] Wainscoat R.J., Cowie L.L. 1992, AJ, 103, 332
- [69] White S.D.M., Frenk C.S. 1991, ApJ, 379, 52
- [70] Wright A.E., Ostrupcek R. (eds.) 1990, PKSCAT90 database, ANTF, Parkes, NSW, Australia.
- [71] Yamada T.; Tanaka I., Aragon-Salamanca A., Kodama T., Ohta K., Arimoto N. 1997, ApJ, 487, L125
- [72] Yan L., McCarthy P.J., Weymann R.J., Malkan M.A., Teplitz H.I., Storrie-Lombardi L.J., Smith M., Dressler A. 2000, ApJ in press (astro-ph/0004170)
- [73] Yee H.K.C., Green R.F. 1987, ApJ, 319, 28
- [74] Zepf S.E. 1997, Nature, 390, 377