Low and High Ionization Absorption Properties of Mgii Absorption–Selected Galaxies at Intermediate Redshifts. II. Taxonomy, Kinematics, and Galaxies11affiliation: Based in part on observations obtained at the W. M. Keck Observatory, which is operated as a scientific partnership among Caltech, the University of California, and NASA. The Observatory was made possible by the generous financial support of the W. M. Keck Foundation. 22affiliation: Based in part on observations obtained with the NASA/ESA Hubble Space Telescope, which is operated by the STScI for the Association of Universities for Research in Astronomy, Inc., under NASA contract NAS5–26555.
Abstract
We examine a sample of 45 Mgii absorption–selected systems over the redshift range 0.4 to 1.4 in order to better understand the range of physical conditions present in the interstellar and halo gas associated with intermediate redshift galaxies. Mgii and Feii absorption profiles were observed at a resolution of km s-1 with HIRES/Keck. Ly and Civ data were measured in FOS spectra obtained from the Hubble Space Telescope archive (resolution km s-1). We perform a multivariate analysis of , , and (rest–frame equivalent widths) and the Mgii kinematic spread. There is a large range of high–to–low ionization properties and kinematics in intermediate redshift absorbers, that we find can be organized into five categories: “Classic”, “Civ–deficient”, “Single/Weak”, “Double”, and “DLA/Hi–Rich”. These categories arise, in part, because there is a strong connection between low–ionization kinematics and the location of an absorber on the – plane. Using photoionization modeling, we infer that in most absorbers a significant fraction of the Civ arises in a phase separate from that giving rise to the Mgii. We show that many of the Civ profiles are resolved in the FOS spectra due to velocity structure in the Civ gas. For 16 systems, the galaxy , , , and impact parameters are measured. We compare the available absorption–line properties (taken from Churchill et al. 1999, Paper I) to the galaxy properties but find no significant (greater than ) correlations, although several suggestive trends are apparent. We compare the locations of our intermediate redshift absorbers on the – plane with those of lower and higher redshift data taken from the literature and find evidence for evolution that is connected with the Mgii kinematics seen in HIRES/Keck profiles of Mgii at . We discuss the potential of using the above categorizations of absorbers to understand the evolution in the underlying physical processes giving rise to the gas and governing its ionization phases and kinematics. We also discuss how the observed absorbing gas evolution has interesting parallels with scenarios of galaxy evolution in which mergers and the accretion of “proto–galactic clumps” govern the gas physics and provide reservoirs for elevated star formation rates at high redshift. At intermediate and lower redshifts, the galaxy gaseous components and star formation rates may become interdependent and self–regulatory such that, at , the kinematics and balance of high and low ionization gas may be related to the presence of star forming regions in the host galaxy.
Subject headings:
quasars— absorption lines; galaxies— evolution; galaxies— halos1. Introduction
It is well known that individual galaxies fall into a fairly clear–cut morphological classification scheme, as first proposed by Hubble (1936). Over the decades, Hubble’s scheme has been expanded upon and exploited for quantifying galactic evolution, galactic stellar populations and star formation efficiencies, the relative gas–phase component to stellar component in galaxies, and the effects of environment on galaxy formation. Similarly, one of the central motivations for studying intervening quasar absorption lines, especially those selected by the presence of metal lines, is that they also provide insights into galactic evolution, not of the stars and stellar dynamics, but of the chemical, ionization, and kinematic conditions of interstellar and halo gas.
Historically, absorption line systems have been classified in a taxonomic system by their gas cross sections. Categorized by increasing Hi column densities are the Ly forest clouds, with cm-2, the sub–Lyman limit systems, having cm-2, the Lyman limit break systems, with cm-2, and the damped Ly systems, having cm-2. Metal–line systems are either selected by the presence of strong Mgii absorption or strong Civ absorption.
What has not been explored, however, is the taxonomy of absorption line systems when the Hi, Mgii, and Civ absorption strengths and the gas kinematics are equally considered. Ultimately, categorizing the relationships between several different absorption properties may provide clues central to understanding the different physical natures of the various types of systems.
Furthermore, while our empirical knowledge of the absorption strengths, kinematics, and physical extent of galaxies selected by Mgii absorption has steadily progressed over the last decade (e.g. Bergeron & Boissé (1991); Lanzetta & Bowen (1990), 1992; Bergeron et al. (1992); Le Brun et al. (1993); Steidel et al. (1994); Churchill et al. (1996); Guillemin & Bergeron (1997)), little is directly known about Hi absorption and higher ionization absorption (esp. Siiv, Civ, Nv, and Ovi) in these galaxies.
Arguably, the Mgii–selected systems are ideally suited for a taxonomic study of absorption systems because:
(1) those with Å are known to be directly associated with galaxies (Bergeron & Boissé (1991); Steidel, Dickinson, & Persson 1994; Churchill et al. (1996)) and/or sub–galactic metal–enriched environments (Yanny (1992); Yanny & York (1992)). HST imaging has revealed that these galaxies have a wide variety of line–of–sight orientations and “normal” morphologies (see Steidel et al. (1997); Steidel (1998)). Since magnesium is an –group element yielded by Type II supernovae, it is expected that the association with galaxies will hold to the highest redshifts.
(2) they arise in structures having a five decade range of Hi column densities, including sub–Lyman limit systems (Churchill et al. 1999a ; Churchill et al. 2000, hereafter Paper I), Lyman limit systems (e.g. Steidel & Sargent (1992); Paper I), and damped Ly systems (e.g. Le Brun et al. (1997); Rao & Turnshek (1998); Boissé et al. (1998)) which means that a large range of galactic environments will be sampled.
(3) for their statistical properties and for their kinematic properties have been thoroughly documented (e.g. Lanzetta, Turnshek, & Wolfe (1987); Sargent, Boksenberg, & Steidel (1988); Steidel & Sargent (1992); Petitjean & Bergeron (1990); Steidel & Sargent (1992); Churchill (1997); Churchill et al. 1999a ) which means that the low redshift database is already in place and can be used for evolution studies when higher redshift data are obtained.
(4) they are seen to give rise to a range of Civ and other high ionization absorption in UV space–based spectra (Bergeron et al. (1994); Paper I), which means that the more general ionization conditions can be studied in detail (e.g. Churchill & Charlton (1999)).
In this paper, we study the combined available data on a sample of 45 Mgii absorption–selected systems at redshifts –. We focus on the Mgii and Feii absorption strengths and kinematics, the Ly and Civ absorption strengths (Paper I), and the ground–based derived galaxy luminosities, colors, and impact parameters. We perform a multivariate analysis (Babu & Feigelson (1996); Johnson & Wichern (1992)) on the absorption line data in order to objectively quantify systematic differences between and/or groupings of the high ionization and neutral hydrogen absorption properties of Mgii selected systems.
The paper is organized as follows: In § 2, we describe the data, the sample selection, and the data analysis. In § 3, we investigate the variation in the high and low ionization properties of intermediate redshift Mgii absorbers using multivariate analysis. We introduce a taxonomy that serves as an objective guide for classifying the variations in Mgii absorber properties. In § 4, we investigate the overall ionization and kinematic conditions. In § 5 we investigate the relationship between the absorption properties and host galaxy properties and in § 6 offer a speculative discussion on the relationships between the absorber classes and their possible evolution. In § 7 we summarize the main points of this work.
2. The Data: Sample Selection and Analysis
We targeted quasar absorption line systems at intermediate redshifts that have been discovered by the presence of a Mgii doublet (e.g. Lanzetta, Turnshek, & Wolfe (1987); Sargent, Boksenberg, & Steidel (1988); Steidel & Sargent (1992)). We also include in our study the “weak” systems [those with Å], which are more numerous in their redshift path density (Churchill et al. 1999a ). A detailed account of the sample selection is given in Paper I, but we briefly outline the sample properties here.
The Mgii absorbers were selected from a high resolution ( km s-1) survey (Churchill (1997)) using the HIRES spectrograph (Vogt et al. (1994)) on the Keck I telescope. For 45 of these systems, additional wavelength coverage in the ultraviolet was available in the HST/FOS archive and the database compiled by the HST QSO Absorption Line Key Project (Bahcall et al. (1993); Bahcall et al. (1996); Jannuzi et al. (1998)).
The resulting database of Mgii absorbing systems and their rest–frame equivalent widths are listed in Table Low and High Ionization Absorption Properties of Mgii Absorption–Selected Galaxies at Intermediate Redshifts. II. Taxonomy, Kinematics, and Galaxies11affiliation: Based in part on observations obtained at the W. M. Keck Observatory, which is operated as a scientific partnership among Caltech, the University of California, and NASA. The Observatory was made possible by the generous financial support of the W. M. Keck Foundation. 22affiliation: Based in part on observations obtained with the NASA/ESA Hubble Space Telescope, which is operated by the STScI for the Association of Universities for Research in Astronomy, Inc., under NASA contract NAS5–26555.. The first three columns are the quasar name, the absorber redshift, and the Mgii rest–frame equivalent width, . The fourth and fifth columns list the Mgii kinematic spread, (see Equation 1), and the kinematic composition, i.e. the number of Voigt Profile components (see § 2.2). Columns six, seven, and eight list the Feii, Civ, and Ly rest–frame equivalent widths. Column nine gives the various subsamples used for our analyses. Column ten lists the taxonomic “class” of each system (explained in § 3.2).
Full details of the data analysis are given in Paper I, including the continuum fitting, the line finding, the equivalent width measurements, the establishment of a redshift zero point for the FOS spectra, the procedure for line identifications, and the techniques employed to measure Lyman limit breaks, when present.
As shown in Figure 2 of Paper I, the Mgii equivalent width distribution is consistent with that of an unbiased sample of absorbers for Å (Churchill et al. 1999a ). There are five systems with Å, which may appear as a bias toward strong systems. When this may be a concern for our analysis, we discuss this possibility.
With regard to detection sensitivity, the sample is 72% complete to a rest–frame detection threshold of Å and 93% complete to a Å threshold (Figure 3 of Paper I). In column nine of Table Low and High Ionization Absorption Properties of Mgii Absorption–Selected Galaxies at Intermediate Redshifts. II. Taxonomy, Kinematics, and Galaxies11affiliation: Based in part on observations obtained at the W. M. Keck Observatory, which is operated as a scientific partnership among Caltech, the University of California, and NASA. The Observatory was made possible by the generous financial support of the W. M. Keck Foundation. 22affiliation: Based in part on observations obtained with the NASA/ESA Hubble Space Telescope, which is operated by the STScI for the Association of Universities for Research in Astronomy, Inc., under NASA contract NAS5–26555., we have designated those systems having rest–frame detection thresholds greater than Å as Sample A. For these absorbers, unresolved Mgii absorption features with Å cannot be detected. The other subsample designations, “CA” and IC”, are explained in §§ 3 and 4, respectively.
2.1. Galaxy Sample
For roughly 60 Mgii absorbers having Å, Steidel et al. (1994) identified associated galaxies. Only 16 of the 45 Mgii systems presented here, of which 21 have Å, have confirmed galaxy counterparts (not all fields studied here have been imaged).
The galaxy properties were obtained from broad–band , , and –band images of the QSO fields and their redshifts were spectroscopically verified to be coincident (within km s-1) with those of the Mgii absorbers. PSF subtraction of the quasar was performed for all fields, enabling small impact parameter galaxies to be identified. Further details of the imaging and spectroscopic observations are described in Steidel et al. (1994).
The galaxy properties are presented in Table Low and High Ionization Absorption Properties of Mgii Absorption–Selected Galaxies at Intermediate Redshifts. II. Taxonomy, Kinematics, and Galaxies11affiliation: Based in part on observations obtained at the W. M. Keck Observatory, which is operated as a scientific partnership among Caltech, the University of California, and NASA. The Observatory was made possible by the generous financial support of the W. M. Keck Foundation. 22affiliation: Based in part on observations obtained with the NASA/ESA Hubble Space Telescope, which is operated by the STScI for the Association of Universities for Research in Astronomy, Inc., under NASA contract NAS5–26555.; the columns from left to right are the quasar field, the galaxy redshift, the absolute magnitude, , the absolute magnitude, , the de–reddened color, the galaxy–quasar impact parameter in kpc ( km s-1 Mpc-1, ), and a reference if previously published. In a few cases, morphology information is available from published HST images (Le Brun et al. (1997); Steidel et al. (1997); Steidel (1998)).
It is always possible that a galaxy is misidentified, that another galaxy or more than one galaxy is giving rise to the absorption. Possible selection effects due to misidentifications and incompleteness of galaxy redshifts in the individual quasar fields are discussed by Steidel et al. (1994) and examined in detail by Charlton & Churchill (1996).
2.2. Data Analysis: Kinematics
To measure the kinematic “spread” of the low ionization gas directly from the flux values, we use the second velocity moment of optical depth across the Mgii profile, defined as,
| (1) |
where is the apparent optical depth measured directly from the flux values (Savage & Sembach (1991)) at velocity , , , and . The sums are performed only over velocity intervals in which absorption features have been detected at the level, thus eliminating terms consistent with noise (see Paper I for details on feature detection). The quantity measured by is similar to the standard deviation measured from a normal distribution. The uncertainty in is obtained from simple error propagation (Churchill (1997); also see Sembach & Savage (1992)). The velocity zero point of each system is set at the median wavelength of the apparent optical depth distribution of the Mgii profile.
The value of depends upon the velocity squared, and thus its value is sensitive to the presence of very weak Mgii absorption at large velocity. Therefore, is sensitive to the equivalent width detection threshold of the HIRES spectra. We are 93% complete to a rest–frame equivalent width detection threshold of Å for the full sample of 45 systems (see Figure 3 from Paper I). To enforce uniform evaluation of the kinematic spread for the full sample, we omitted features with Å from the computation of . Six systems required this censorship step; they are footnoted in Table Low and High Ionization Absorption Properties of Mgii Absorption–Selected Galaxies at Intermediate Redshifts. II. Taxonomy, Kinematics, and Galaxies11affiliation: Based in part on observations obtained at the W. M. Keck Observatory, which is operated as a scientific partnership among Caltech, the University of California, and NASA. The Observatory was made possible by the generous financial support of the W. M. Keck Foundation. 22affiliation: Based in part on observations obtained with the NASA/ESA Hubble Space Telescope, which is operated by the STScI for the Association of Universities for Research in Astronomy, Inc., under NASA contract NAS5–26555.. The maximum change in from its uncensored value was a % difference, except for one of the absorbers (PKS at ), which was changed by a % difference.
To measure the kinematic “composition” of the low ionization gas, we use Voigt profile fitting. We use our own program, MINFIT (Churchill (1997)), which performs a minimization using the NETLIB–slatec routine dnls1 (More (1978)). In fully saturated profiles, the number of clouds is often underestimated by a factor of a few (Churchill (1997)). A corollary is that the cloud column densities, parameters, and velocities are correlative with the number of clouds. We return to this issue in § 4.2.
3. Characterizing Mgii Absorber Properties
We have constructed a subsample of 30 systems, Sample CA (CA = Cluster Analysis), in order to examine variations and possible trends between the absorption properties listed in Table Low and High Ionization Absorption Properties of Mgii Absorption–Selected Galaxies at Intermediate Redshifts. II. Taxonomy, Kinematics, and Galaxies11affiliation: Based in part on observations obtained at the W. M. Keck Observatory, which is operated as a scientific partnership among Caltech, the University of California, and NASA. The Observatory was made possible by the generous financial support of the W. M. Keck Foundation. 22affiliation: Based in part on observations obtained with the NASA/ESA Hubble Space Telescope, which is operated by the STScI for the Association of Universities for Research in Astronomy, Inc., under NASA contract NAS5–26555.. All Sample CA members have measured , , and and have measurements of or limits on Feii and Civ. Systems with upper limits on were included in the sample because these limits are already capable of demonstrating a paucity of Feii absorption (only seven Sample CA systems have Feii limits). Small systems with upper limits on Civ were excluded from the sample because the limits were not always stringent. However, multiple cloud systems with limits on and larger are included. The members of Sample CA are given in column nine of Table Low and High Ionization Absorption Properties of Mgii Absorption–Selected Galaxies at Intermediate Redshifts. II. Taxonomy, Kinematics, and Galaxies11affiliation: Based in part on observations obtained at the W. M. Keck Observatory, which is operated as a scientific partnership among Caltech, the University of California, and NASA. The Observatory was made possible by the generous financial support of the W. M. Keck Foundation. 22affiliation: Based in part on observations obtained with the NASA/ESA Hubble Space Telescope, which is operated by the STScI for the Association of Universities for Research in Astronomy, Inc., under NASA contract NAS5–26555..
In Figure 1, we present three dimensional plots of (a) vs. vs. , (b) vs. vs. , and (c) vs. vs. for Sample CA. Note that distribution of equivalent widths are not random; there is a clear trend for to increase with , for example. On the other hand, it is clear that there are significant spreads, or variations in the absorption strengths. In the case of , we see a very large range of values (Figure 1) that trace , and to a lesser extent . exhibits a significant spread for a given – locus (Figure 1). Moreover, note the groupings of , , and (Figure 1).
From an empirical point of view, the qualitative appearance of groupings in Figure 1 would suggest that Mgii–selected systems can be further categorized (quantitatively) by their absorption properties. However, our sample is small, having only 30 data points, and it is not clear whether the apparent groupings would statistically be present in other “realizations” of the data111Monte Carlo realizations of our sample could shed light on this issue if, and only if, we had a priori knowledge of the distribution functions for all the properties being studied.. This concern is best addressed by using a multivariate analysis in which all available absorption properties are incorporated simultaneously (multidimensional version of Figure 1 with one dimension for each property).
When the Ly, Feii, and Civ and Mgii kinematics are simultanously considered, do we find various “classes” of Mgii absorbers? In other words, can we quantitatively describe both the variations and the trends by considering all the absorption line data presented in Table Low and High Ionization Absorption Properties of Mgii Absorption–Selected Galaxies at Intermediate Redshifts. II. Taxonomy, Kinematics, and Galaxies11affiliation: Based in part on observations obtained at the W. M. Keck Observatory, which is operated as a scientific partnership among Caltech, the University of California, and NASA. The Observatory was made possible by the generous financial support of the W. M. Keck Foundation. 22affiliation: Based in part on observations obtained with the NASA/ESA Hubble Space Telescope, which is operated by the STScI for the Association of Universities for Research in Astronomy, Inc., under NASA contract NAS5–26555.? To address these questions, we applied “Tree Clustering” and “–means Clustering” analysis to sample CA.
3.1. A Multivariate Analysis
Multivariate clustering analysis algorithms are designed to organize data of many variables into catagories so that natural groupings of the data can be examined in a completely unbiased manner (i.e. no model is imposed upon the data). Full details of these techniques can be found elsewhere (e.g. Johnson & Wichern 1992; Babu & Feigelson 1996); below, we provide limited background material. We used the STATISTICA software package (www.statsoft.com).
3.1.1 Tree Cluster Analysis
In tree cluster analysis, the data occupy a multi–dimensional space, one dimension for each measured absorption property. Clustering algorithms compute the “distances” between each pair of points (absorbers) and then amalgamate them into clusters. We note that tree cluster analysis is not subject to significance testing because the result itself is the most significant solution under the assumption of no a priori hypothesis regarding the data.
The amalgamation process begins with each absorber in a unique class by itself and then proceeds by relaxing the criterion of uniqueness in subsequent steps. With each step, the algorithm amalgamates larger and larger clusters of increasingly disimilar properties, until in the final step all absorbers are joined together in a single class. Graphically, clusters appear as distinct “branches” in a hierarchical tree, with similarities linked at nodes. We used Euclidean distances [i.e. ] and Ward’s method (Ward 1963) for the amalgamation algorithm. Ward’s method minimizes the sum of squares of the distances between clusters. The combination of Euclidean distances and Ward’s amalgamation rule uses an analysis of variances approach for which standardization of the data is optimal. With this standardization, each variable is baselined and scaled to have a zero mean and unity standard deviation. standardization ensures that the distance between any pair of points in multidimensional space is not biased by a large dynamic range in one or more of the variables (dimensions).
3.1.2 –means Clustering
In –means clustering analysis, we begin with the assumption of a set number of clusters and the algorithm finds the most significant, or distinct, clusters possible. Starting with random clusters, the algorithm moves points (absorbers) between clusters until both the variability within clusters is minimized and the variability between clusters is maximized. We find that is the highest number of clusters allowed such that all clusters are considered significant, based upon MANOVA tests (Johnson & Wichern (1992); also see Mukherjee et al. (1998)). For five clusters, the MANOVA probabilities, , for accepting a result as valid, (i.e. representative of a unique population) are highly significant. We obtained for each cluster.
3.2. Results
In Figure 2, we present a dendrogram, the tree diagram showing the results of our cluster analysis. Along the bottom horizontal axis are the individual Mgii systems identified by quasar and absorber redshift. The vertical axis is the linkage distance, , the distance between clusters. The larger the value of between two branches, the less related are the objects on each branch.
At there is a natural grouping into three clusters. These three clusters are predominantly distinguished by very strong Ly [right branch, labeled “DLA/Hi–rich”], weaker Civ [center branch, labeled “Civ–weak”], and intermediate to stronger Civ [left branch, labeled “Civ–strong”] absorption.
Further insight into the physical differences in the absorbers can be obtained if we adopt a “less significant” linkage distance. At there is a secondary grouping into six clusters. The Civ–strong and Civ–weak clusters have each been separated by variations in Mgii strengths and kinematics and the DLA/Hi–Rich cluster has been separated by a spread in the Ly strengths. However, we treat the DLA/Hi–Rich systems as a single cluster because the MANOVA significance test from a –means clustering analysis indicates that the further splitting of the DLA/Hi–Rich cluster is not justified. On Figure 2, we have labeled each of these five clusters as “Classic”, “Double”, “Single/Weak”, “Civ deficient”, and “DLA/Hi–Rich”.
It is in a diagram of the –cluster means, Figure 3, that the properties distinguishing each cluster become apparent. Across the horizontal axis of Figure 3 are the absorption properties; from left to right they are the Mgii, Ly, Civ, and Feii absorption “strengths”, and the “strength” of the kinematic spread. Recall that the data have been standardized. Thus, for each given absorption property, the mean value for all systems is zero and the vertical axis is in units of standard deviations. Each cluster is represented by a different data point type: Classic (solid circle); Double (solid square); Single/Weak (open circle); Civ deficient (solid triangle); and DLA/Hi–Rich (solid pentagon). These classes are also connected by unique line types (i.e. dash–dot, solid, etc.); it is important to not only compare a given property across clusters, but to compare how all properties are segregated by cluster. We now briefly discuss some distinguishing features of each absorber class.
3.2.1 Classic Systems
This class appears to have what might be thought of as “typical”, or non–extreme properties. As seen in Figure 3, this class is characterized by having Mgii, Ly, Feii, and Civ equivalent widths, and a kinematic spread within of the respective means for the overall sample.
We call these systems “Classic” because they can be thought to represent the most common type of Mgii absorber observable in earlier generation, low resolution surveys (e.g. Steidel & Sargent (1992); Lanzetta, Turnshek, & Wolfe (1987)). To the sensitivities of these surveys, it was found that virtually all Mgii absorption–selected systems also had Civ absorption.
3.2.2 Civ “Deficient” Systems
The Civ–deficient systems have Mgii, Ly, and Feii properties identical to the Classics and constitute a similar fraction of the overall Mgii absorber population. Their distinguishing properties are significantly lower Civ absorption strengths.
3.2.3 Double Systems
The Doubles are set apart from the Classics by having at least twice the Mgii and Civ absorption strengths and Mgii kinematics. Since the mean Mgii strength for Doubles is in the same regime as of the DLA/Hi–Rich systems, it is the Civ strengths and extreme Mgii kinematics that set this class apart from the others. Doubles also have Ly and Feii absorption strengths that are systematically greater than those of the Classics.
3.2.4 Single/Weak Systems
The Single/Weak class is defined foremost by very small Mgii strengths and kinematics. In fact, with the exception of two systems, all are single, narrow clouds (often unresolved in the HIRES spectra).
The Single/Weak systems are underrepresented in Sample CA, mostly because seven of the systems in our database have no measured Ly. If these seven systems were included with their Civ limits artificially treated as detections, the mean Civ for this class would drop to (this being an upper limit) in the –means cluster diagram (Figure 3). Thus, there is a spread in the distribution of Civ strengths associated with Single/Weak systems. The true mean Feii is also probably lower than that shown on Figure 3 because the limits on Feii in the HIRES spectra scatter about the measured mean. Thus, higher sensitivity spectra would reduce the mean Feii for this class and could reveal a spread in Feii strengths. Only for the Single/Weak class, for which many of the properties were below our detection thresholds, are the above issues pertinent.
3.2.5 DLA/Hi–Rich Systems
The DLA/Hi–Rich class has very strong Mgii, and extremely strong Ly and Feii, relative to the overall Mgii absorber population. They have Civ strengths below that of the Classics and Mgii kinematics typical of the Classics and Civ–deficient absorbers. Their Mgi and Feii strengths are five to ten times greater than those of the typical Classic absorber. Unlike the elevated Ly strengths, which are due to broad damping wings, the Mgi and Feii strengths are driven by the line–of–sight kinematic spreads of the gas for multiple, saturated components. For the intermediate ionization species, Siii, Alii, Cii and Siiii, the strengths are somewhat greater than those of the Classics, on average. The higher ionization species, Siiv, Nv and Ovi (to the extent the latter two have been measured), have strengths consistent with those of the Classics absorbers.
3.3. Robustness of the Clustering Analysis
Two concerns regarding the clustering analysis are: (1) possible biasing due to an slight, but apparent, overabundance of absorbers with Å, and (2) the exclusion of the “weak” systems for which only upper limits on the Civ equivalent widths were measured.
The systems with Å are all members of the DLA/Hi–Rich class. Of these, four are bonified DLAs with cm-2, whereas two have column densities below this classical threshold (i.e. they are Hi–Rich systems). In an unbiased survey for DLAs, using Mgii absorption as a selection method, Rao & Turnshek (1999) found that 14% of the Mgii systems with Å are DLAs. In our sample, 22 systems have Å; thus, 18% of our sample is comprised of DLAs. This is not inconsistent with the unbiased results of Rao & Turnshek.
The presence of a DLA/Hi–Rich class in our sample is not due to the slight bias (overabundance) of the larger ; it is mostly defined by large Hi and Feii equivalent widths. In fact, one DLA has Å ( toward Q ), and was classified as DLA/Hi–Rich in spite of the fact that this Mgii equivalent width is well below Å. In other words, even if the Mgii equivalent widths of the DLA/Hi–Rich systems were quite small, the class would be unchanged in the cluster analysis due to the very strong Hi and Feii strengths. This is clearly shown in Figure 3.
To investigate whether membership in a given class (especially the Single/Weak class) may be sensitive to the inclusion of systems for which only an upper limit is available for , we ran the cluster analysis including the four additional systems with information on Ly (without regard to whether Civ was measured or an upper limit)A. In this analysis, the Civ upper limits were treated as measured values. The class memberships were unchanged for the original 30 systems. The added systems were classified as Single/Weak based upon their small and narrow kinematics. This was expected, given the already large spread in for the Single/Weak class.
We thus conclude that the clustering results are robust; they are not affected by biases nor are they sensitive to changes in the sample.
3.4. Absorption Strengths
In Figure 4, we present the rest–frame equivalent widths (taken from Table Low and High Ionization Absorption Properties of Mgii Absorption–Selected Galaxies at Intermediate Redshifts. II. Taxonomy, Kinematics, and Galaxies11affiliation: Based in part on observations obtained at the W. M. Keck Observatory, which is operated as a scientific partnership among Caltech, the University of California, and NASA. The Observatory was made possible by the generous financial support of the W. M. Keck Foundation. 22affiliation: Based in part on observations obtained with the NASA/ESA Hubble Space Telescope, which is operated by the STScI for the Association of Universities for Research in Astronomy, Inc., under NASA contract NAS5–26555. and from Tables 3 and 4 of Paper I) vs. . We have also included vs. . The panels are ordered by increasing ionization potential from the upper left to the lower right and the data point types are the same as in Figure 3.
For the non–DLA/Hi–Rich systems, note that the absorption strengths of the low ionization species Mgi, Feii, Siii, Alii, and Cii increase with increasing , indicating these species arise in the phase giving rise to the Mgii absorption. Overall, the higher ionization species Siiv and Civ exhibit more scatter, as quantified by the dispersion per observed range.
We caution that the classification scheme introduced above should not be taken to suggest that Mgii absorbers group into discretized classes. Discretization is a byproduct of clustering analysis. In fact, the distribution functions of the equivalent widths plotted in Figure 4 are characterized by single modes and decreasing tails222The exceptions are , , and , which are bimodal due to the DLA/Hi–Rich class. However, it is not clear if this bimodality is due to small numbers and/or is due to the relatively large number of DLAs in our sample. As such, any single absorption property, viewed in this univariate fashion, is distributed continuously. However, from the perspective of a multivariate analysis, it is clear that the overall properties of Mgii absorbers group in well defined regions of a “multi–dimensional space”.
4. Inferring Ionization Conditions and Kinematics
To examine the kinematic and ionization conditions, we define a new subsample, IC (IC = Ionization Conditions). Sample IC includes only those systems with (1) an Mgii equivalent width detection threshold less than or equal to Å, and (2) no unresolved saturation in at least four adjacent pixels (1.33 resolution elements) in the Mgii profile. These selection criteria enforce a high level of accuracy in the number of Voigt profile components, , and their column densities, velocities, and parameters. Simulations of blended, multiple component Mgii profiles with these characteristics show that the distribution of Voigt profile parameters output from Voigt profile fitting is consistent (99% confidence) with those used to generate the profiles (Churchill (1997)). Data with lower signal–to–noise ratios result in a slight paucity of Voigt profile components, and therefore (to compensate) the resulting components have column densities and parameters that are too large. Profiles with severely saturated cores (e.g. DLA/Hi–Rich absorbers) systematically have fewer Voigt profile components by a factor of three and have unconstrained column densities and parameters. The equivalent width threshold criterion directly translates to a signal–to–noise ratio criterion of per resolution element in the continuum. Sample IC membership is given in column nine of Table Low and High Ionization Absorption Properties of Mgii Absorption–Selected Galaxies at Intermediate Redshifts. II. Taxonomy, Kinematics, and Galaxies11affiliation: Based in part on observations obtained at the W. M. Keck Observatory, which is operated as a scientific partnership among Caltech, the University of California, and NASA. The Observatory was made possible by the generous financial support of the W. M. Keck Foundation. 22affiliation: Based in part on observations obtained with the NASA/ESA Hubble Space Telescope, which is operated by the STScI for the Association of Universities for Research in Astronomy, Inc., under NASA contract NAS5–26555..
4.1. Ionization Conditions
4.1.1 Single/Weak Systems
Normally, it is difficult to interpret the ionization conditions based upon equivalent widths because simple curve of growth arguments are muddled by the possibility of unresolved saturation in multiple component absorption. However, these arguments can hold for the Single/Weak clouds.
As shown by Churchill et al. (1999a), under the assumption of photoionization, Single/Weak clouds with Å, cannot give rise to Å (see their Figure 12). The upper limit on is significantly more restrictive when Feii is detected in the Mgii cloud (i.e. the cloud is constrained to have low ionization conditions). Based upon this analysis, we find that roughly half of the observed Single/Weak absorbers likely have multiple ionization phases, with Civ and some portion of the Ly absorption arising in spatially distinct, higher ionization material. These findings are confirmed in a thorough study using CLOUDY (Ferland (1996)) photoionization models tuned to the measured Mgii column densities and constrained by the full complement of ionization species and transitions covered in FOS spectra (Rigby et al. (1999))
4.1.2 Multicloud Systems
We now use photoionization modeling to investigate whether multiphase ionization can also be inferred for the multicloud Classic, Civ–deficient, and Double systems. We consider whether the measured Civ and/or Siiv absorption can or cannot all arise in the Mgii clouds, even under extreme assumptions about their ionization conditions. The following is based upon the methods employed by Churchill & Charlton (1999) in their study of the systems toward PG .
We assumed that the Mgii clouds in a given system are in photoionization equilibrium and used CLOUDY (Ferland (1996)) to model their ionization conditions. A Haardt & Madau (1996) extragalactic spectrum at was used for the ionizing radiation. Based upon experiments with various single and extended starburst galaxy spectral energy distributions (Bruzual & Charlot (1993)) with assumed high photon escape fractions, we determined that CLOUDY models involving Mgii, Feii, Siiv, and Civ are not highly sensitive to the chosen spectrum for (Churchill & Charlton (1999)); thus our general conclusions are not sensitive to the assumed spectral energy distribution.
We obtained a predicted Civ and Siiv equivalent width for each system by tuning a CLOUDY model to the observed Mgii and Feii column densities in each of its clouds. We then measured the absorption strengths in synthesized HIRES spectra using the velocities and parameters thermally scaled from those measured for the Mgii clouds [see Churchill & Charlton (1999) for details.]
Since our goal is to infer if multiphase ionization structure is possibly present in a given system, we have forced the models to yield the maximum amount of Civ and Siiv that can arise in the Mgii clouds. If a cloud has detected Feii, then, for a given abundance pattern under the assumption of negligible dust depletion, the Feii and Mgii column densities uniquely determine the ionization parameter (the logarithm of the ratio of the number density of hydrogen ionizing photons to the number density of hydrogen), nearly independent of metallicity. The ionization parameter uniquely dictates the Civ and Siiv column densities in the clouds. Typical ionization parameters in the clouds with Feii are to . We use a solar abundance pattern, since this yields a higher ionization parameter for a given ratio of Mgii to Feii column densities, and thus yields a maximized Civ and Siiv strength. If there is no detected Feii for a cloud (either a limit or no coverage), then the ionization parameter is pushed to as high a value as possible without the cloud size exceeding 10 kpc. Typically, this occurs at an ionization parameter of . A solar metallicity was assumed for all clouds, again in order to maximize the predicted Civ and Siiv strengths (for a high metallicity cloud, the hydrogen column density required to give rise to the observed Mgii is smaller, and the ionization parameter can be pushed to a higher value). We did not apply any other constraints from the data (e.g. Siii, Cii, etc.) than those described above.
In Figure 7, we present the predicted maximum equivalent widths vs. the observed equivalent widths for Civ (left panel) and Siiv (right panel). The mean error in the measured values is depicted by the open–box data point in the upper left of each panel. Diagonal lines demarcate those systems that are inferred to have multiphase ionization (lower right) from those that could be single phase. The maximum predicted Civ strength that can arise in photoionized Mgii clouds is more than short of the observed for a number of systems. Even two of the Civ–deficient systems are below the line. This implies that even though these particular systems have below average Civ absorption strengths, the Civ may still arise in a distinct, higher ionization phase and not in the Mgii clouds. For Siiv, it appears that fewer systems would require multiphase structure in this ionization species; Siiv likely resides in the Mgii clouds in a larger fraction of Mgii selected absorbers than does the Civ.
4.2. Mgii and Civ Kinematics
4.2.1 Number of Clouds
In Figure 6, we show these same absorption strengths vs. the number of clouds, or subcomponents, , obtained from Voigt profile decomposition. The data point types are the same as for Figure 4.
There is a strong correlation of with , the number of Voigt profile components (also see Petitjean & Bergeron (1990)). A linear least–squares fit, which we have drawn as a dotted line in Figure 6, yielded a slope of Å cloud-1. Note that this relationship is likely resolution dependent. Also note that the fit is strongly influenced by the two Double systems with large .
We find that there is not as “linear” a dependence for nor for with Mgii kinematics. There is, however, a tight correlation of with the number of Mgii clouds. We obtained a linear least–squares fit (drawn as a dotted line) with slope Å cloud-1. The linear relationship for vs. suggests that majority of neutral hydrogen equivalent width arises in the Mgii clouds themselves.
4.2.2 Mgii Kinematics
In Figure 5, the absorption strengths of Mgii, Feii, Ly, and Civ are plotted vs. the Mgii kinematic spread, . The data point types are the same as for Figure 4.
In Figure 5, the scatter in arises because the Mgii equivalent width is dominated by the largest clouds, which are usually clustered in subgroups with velocity spreads less than km s-1 [see Figure 12 of Charlton & Churchill (1998)]. The kinematic spread, on the other hand, is sensitive to the presence of small clouds with large velocities (). The “limit” along the upper left of the data, shown as a dotted line, is due to saturation in the profile line cores; there is a maximum equivalent width for a given velocity spread when the profile is black bottomed. The “limit” along the lower right is due to detection sensitivity; for the signal–to–noise ratios of the sample, there is a minimum detectable for a given velocity spread. Higher quality data would be required to determine if there is an actual paucity of systems with large kinematic spreads and extremely weak Mgii absorption.
The strong correlation between and has previously been discussed by Churchill et al. (1999b). The correlation is driven by the three Double systems ( toward Q , toward PKS , and toward PG ) and the two kinematically extreme Classic systems ( toward PG and toward PKS ), which all have km s-1. We have drawn in the maximum–likelihood linear fit to the data, which has slope mÅ . More data on Double systems at intermediate redshifts, selected by Å, would be useful for determining how tight the relationship between and Mgii kinematics remains for the largest kinematic spreads.
Three of the five Classic systems above the correlation line are from the lowest signal–to–noise spectra; there could be missed, small equivalent width components resulting in a small . Even so, there is a significant scatter in at a given for km s-1. The Single/Weak systems have Å and km s-1, whereas the Civ–deficient systems have Å and km s-1.
4.2.3 Civ Kinematics
In Figure 8 we display the suite of Civ doublets feasured in FOS spectra (we exclude ground based data; see Paper I) that are not blended with other transitions. The velocity window for the Civ doublets is 2000 km s-1. Above each doublet member are ticks giving the velocities of the Mgii Voigt profile components. The Mgii profiles are also shown with the Voigt profile models superimposed on the data, which are ordered by increasing kinematic spread, . The velocity window for the Mgii data is 600 km s-1.
To demonstrate which profiles are resolved, and to quantify the degree to which they are resolved, we fit the individual Civ members with single Gaussians while holding the width constant at the value of the instrumental spread function, km s-1. We have superimposed these unresolved fits on the Civ profiles. We note that several of the spectra were obtained prior to the refurbishing mission in which COSTAR was installed. For “large” aperture aquisition modes (″ slit), the instrumental spread function of the pre–COSTAR instrument has extended wings. PKS is the only object acquired in this mode; thus, the unresolved fit to the system should be viewed with some discretion. Several of the unresolved fits are consistent with the Civ data, suggesting that the adopted instrumental spread function accurately represents the pre–COSTAR and post–COSTAR instrument for the smaller apertures modes.
We computed the quantity,
| (2) |
where is the measured Civ equivalent width adopted for Table Low and High Ionization Absorption Properties of Mgii Absorption–Selected Galaxies at Intermediate Redshifts. II. Taxonomy, Kinematics, and Galaxies11affiliation: Based in part on observations obtained at the W. M. Keck Observatory, which is operated as a scientific partnership among Caltech, the University of California, and NASA. The Observatory was made possible by the generous financial support of the W. M. Keck Foundation. 22affiliation: Based in part on observations obtained with the NASA/ESA Hubble Space Telescope, which is operated by the STScI for the Association of Universities for Research in Astronomy, Inc., under NASA contract NAS5–26555., and is the Civ equivalent width from the unresolved fits. Thus, measures the fraction of the integrated flux due to resolved velocity structure in the Civ doublet. We have noted the value and its uncertainty for each Civ profile in Figure 8. There is a correlation between and . We have thus demonstrated that the tight vs. correlation is due to resolved velocity structure in the Civ absorbing gas.
Velocity structure is not unexpected. Observed at higher resolution, Civ profiles from Milky Way halo gas exhibit velocity structure over a km s-1 spread, though the components are typically blended together (Sembach et al. 1999b ). For higher redshift galaxies, the Civ profiles also show distinct velocity structure (Petitjean & Bergeron (1994)) with velocity spreads up to 200 km s-1. In Figure 9, we present an example of a kinematically complex Civ doublet ( km s-1 resolution) and two Feii transitions (Mgii was not covered) for the damped Ly absorber at toward Q333Interestingly, this DLA has Å, twice that of the DLA/Hi–Rich systems in our lower redshift sample. It has Å (Steidel & Sargent 1992). The ticks above the Civ profiles were obtained by a crude Voigt profile fit to the strongest components to parameterize the kinematics; we used this fit to synthesize the Civ doublet as it would be observed with FOS resolution and pixel sampling (infinite signal–to–noise ratio). This is shown in the separate, bottom panel of Figure 9, with the Civ and component ticks above the continuum (not the Mgii ticks as in Figure 8). An unresolved fit is superimposed on the synthetic FOS doublet for which we measured . This value is comparable to for the system toward Q and the double system toward PG .
In cases where the Mgii profiles are highly asymmetric, it appears that the Civ profiles exhibit similar asymmetry in the same sense. That is, the flux discrepancies between the unresolved fits and the Civ profiles are aligned in velocity with the kinematic outliers seen in Mgii. Since we have demonstrated that, in most cases, the Civ does not arise in the same phase as the Mgii clouds (see § 4.1.2), we infer that the Civ often arises in a physically distinct structure from the Mgii, but is aligned kinematically with the Mgii.
5. Absorption–Galaxy Properties
We tested for correlations between the galaxy properties and all the absorption line data presented in Paper I, including all possible combinations of equivalent width ratios. We performed Kendall and Spearman non–parametric rank correlation tests using the program ASURV (LaValley, Isobe, & Feigelson (1992)). The ASURV algorithm provides for measurements that are either upper or lower limits.
Out of 114 tests performed, seven resulted in correlations above the level444For 114 correlations tests, only one test should result in a or greater significance level at random.; these are: , Mgii doublet ratio, and vs. impact parameter; and vs. ; and and vs. . When DLA/Hi–Rich systems were removed from the sample, the significance levels dropped slightly below . No test resulted in a correlation at a or greater significance level.
5.1. Global Ionization and Density Structure?
In Figure 10 we present plots of the absorption properties used in our multivariate analysis, , , , , and , vs. host galaxy properties.
is anti–correlated with impact parameter (decreases with galactocentric distance) with a significance and is correlated with (increases with decreasing luminosity), also with a significance. Both these trends arise because DLAs, which give rise to the largest , are often observed at low impact parameters and often have low luminosities ().
The vs. luminosity relationship can provide a test for halo models in which a virialized hot phase ( K) pressure confines the low ionization phase (e.g. Mo & Miralda–Escudé (1996)). These models predict an anticorrelation between and galaxy mass (i.e. luminosity); Civ is predicted to be enhanced in smaller, lower mass galaxies, which have low gas pressures in their halos. As seen in Figure 10, there is a visual, yet not statistically significant, trend for the most massive galaxies to have smaller in our small sample. This is driven by the high luminosity [and very red; see vs. ] Civ–deficient systems.
In Figure 11, we have plotted the equivalent width ratios of Siiv to Civ, Ly to Civ, Ly to Mgii, Feii to Civ, and the Civ and Mgii doublet ratios vs. impact parameter. We have selected combinations only of the gas properties used in our multivariate analysis, with the exception of the ratio . This ratio is anticorrelated with impact parameter at the level when all galaxies are included and at the level when DLA/Hi–Rich systems are excluded. If this trend were to hold for a larger sample, it would be consistent with the scenario in which halo gas is photoionized by the extragalactic UV background flux resulting in a increasing ionization level with increasing galactocentric distance (see Savage, Sembach, & Lu (1997)).
The Mgii doublet ratio is correlated with impact parameter at the significance level. This reflects the fact that the gas tends to become optically thin at larger galactocentric distances, where is systematically smaller. Again, the DLAs dominate the trend.
The ratio is not correlated with impact parameter when all galaxies in the sample are included. However, when the DLA/Hi–Rich systems are excluded a level correlation is observed. This is governed by the general decrease in Mgii equivalent widths with impact parameter, since Ly shows no trend with impact parameter (when DLA/Hi–Rich systems are excluded). This particular trend is difficult to interpret because of the very different curve of growth behavior for Mgii and Ly. It is not possible to address the possibility of a metallicity or ionization gradient. The location of the Lyman limit break was covered for only six of the galaxies and was detected for all six, sampling impact parameters from to kpc.
5.2. Ionization Conditions and Colors
In Figure 12, we have plotted the Civ to Mgii, Ly to Civ, and Ly to Mgii equivalent width ratios vs. host galaxy color. Both and are correlated with at a significance level. This trend in our small sample is governed by both the DLA/Hi–Rich systems and the Civ–deficient systems being associated with redder galaxies.
5.3. Correlation Test: Overall Results
The degree of scatter in the absorption properties presented here are similar to that found by Churchill et al. (1996) for the Mgii absorption properties only. None of the presented absorption properties correlated with the galaxy properties at a high significance level. This is not to say that definite trends, or even statistically significant correlations, do not exist. The large scatter in the properties signifies large local variations from line of sight to line of sight through the galaxies; however, even with our small sample, we have uncovered some suggestive global trends.
We also find that the inclusion or exclusion of DLA/Hi–Rich systems in any given test significantly alters the statistics. The host galaxies of DLAs are seen to have a wide range of luminosities, morphologies, colors, and surface brightnesses (e.g. Le Brun et al. (1997); Rao & Turnshek (1998)), and do not represent a homogenous population, despite the fairly homogeneous absorption properties by which they are selected.
6. Discussion
We reemphasize that a taxonomic scheme based upon a multivariate clustering analysis will, by its very nature, result in a discretization of what may actually be a continuum of properties. Nonetheless, if we adopt the clustering analysis results at face value (see § 3.2) and segregate the wide variety of Mgii absorber properties into individual “classes”, we may be able to find order in an otherwise complex array of gas properties and kinematics. The hope is to gain further insights into defining distinctive or “characteristic” properties of Mgii absorbers and to understanding the galactic processes that give rise to the observed range of these “characteristics”.
What follows is primarily a speculative discussion, given the fact that there is still very little data upon which inferrences can be based.
6.1. Classic vs. Civ–deficient Systems
The existence of Civ–deficient systems with Å, which have kinematics similar to the Classics, indicates that the connection between Civ absorption and Mgii kinematics does not operate the same in all galaxies (or at all locations in galaxies).
There are only three Civ–deficient systems with measured galaxy properties ( toward PKS , toward Q , and toward PG ). The host galaxies of these three systems are reddish (, , and ) and are among the more luminous (, , and ). Also, they are probed at large impact parameters (, , and kpc), respectively (see Figure 10). The redder colors and large luminosities would suggest massive, early–type galaxies. Based upon HST images of the and absorbers (Steidel (1998)), we roughly (visually) classify them to be an edge–on S0 galaxy (probed on its minor axis) and a face–on SBa galaxy, respectively.
Despite small numbers, these relatively high masses, early–type morphologies, and large impact parameters may be a clue to the observed spread in for a given Mgii absorption profile type. Semianalytical models of pressure confined gaseous halos predict smaller Civ strengths in more massive galaxies (e.g. Mo & Miralda–Escudé (1996)), and such a trend is not inconsistent with our data. The weak Civ cannot simply be due to the line of sight through the galaxy, because some Classics at large impact parameters have very strong Civ strengths. Also, based upon cross–sectional arguments from the number of Civ absorbers per unit redshift (Steidel (1993)) and upon the expected lower pressures and gas densities at larger galactocentric distances (Mo & Miralda–Escudé (1996)), it is expected that Civ absorption would be strong at large impact parameters.
Perhaps strong Civ is expected in regions of relatively pronounced star formation, which would be consistent with Civ–deficient absorbers being associated with earlier–type galaxies. Alternatively, in Civ–deficient absorbers, the Civ could be ionized away due to collisional processes, such as with the intragroup medium scenario proposed by Mulchaey et al. (1996). If so, strong Ovi absorption would be predicted; unfortunately, we cannot address Ovi absorption for the Civ–deficient systems [only one is “measured” to have an unrestrictive upper limit on ]. A further possibility is that galaxies with extended X–ray emission, usually early–type galaxies (e.g. Mathews & Brighenti (1998)), may preferentially be Civ– and Ovi–deficient because of the extremely hot environment. If so, the Mgii absorbing gas would necessarily arise in Hi gas, which is of external origin for ellipticals from galaxy mergings (Knapp, Turner, & Cunniffe (1985); van Gorkom (1992)) and is sometimes found to be in disk–like structures extending 5 to 10 times the optical radii in “dust–lane” elliptical galaxies (e.g. Morganti, Oosterloo, & Tsvetanov (1998)) Thus, one might hypothesize that Mgii absorption associated with elliptical galaxies arises preferentially in post–merger ellipticals.
6.2. Classic vs. Double Systems
There are at least two obvious explanations for the Double systems; they might be two Classic systems clustered in line–of–sight velocity (bound or unbound), or a primary galaxy and a satellite (e.g. possible an interacting LMC–like object).
The three Double systems in our sample have the largest , which are consistent with that of two typical Classic systems. Alternatively, they could arise in a primary galaxy either undergoing a minor merger or residing in a group with several minor galaxies. Using the Local Group as a model and applying the simple cross–sectional dependence for with galaxy luminosity (Steidel (1995); also see McLin, Giroux, & Stocke (1998)), we estimated the probability of intercepting a “double” absorber for a random line of sight passing through the Milky Way (line–of–sight kinematics were not considered). We found a % chance of intercepting both the LMC and the Milky Way, and a % chance of intercepting both the SMC and the Milky Way. All other galaxies in the Local Group have negligible probabilities of being intercepted for a line of sight passing within 50 kpc of the Milky Way.
An alternative scenario is that Double systems are otherwise typical Classic systems, but for the interception of kinematic outlier clouds, either due to infalling or ejected “high velocity” gas. This picture would naturally invoke elevated star formation to explain the large in Doubles and, possibly, the correlation between and Mgii kinematics. Infalling material can enhance star formation (Hummel et al. (1990); Lutz (1992); Hernquist & Mihos (1995); Hibbard & van Gorkom (1996)), which can provide the energetics to support a multiphase halo (Dahlem (1998)) with strong Civ absorption [i.e., as with the Galaxy (Savage et al. 1997)]. Consistent with this scenario would be that the bluest galaxies would preferentially be associated with Double systems. Only one Double system has measured galaxy properties ( toward Q ), and we note that its color ( is among the bluest in the sample, consistent with a star forming object. An HST image (Steidel (1998)) reveals the galaxy to be compact with a spherical, featureless morphology (no evidence for merging).
6.3. Classic vs. DLA/Hi–Rich
Though the Classic Mgii systems are well understood to select normal, bright galaxies (Steidel et al. (1994)), the DLA/ systems are seen to select [based upon cm-2] an eclectic population of low luminosity, low surface brightness, and dwarf galaxies (Le Brun et al. (1997); Rao & Turnshek (1998), 1999). This might suggest that not all classes of Mgii absorber have a systematic connection with galaxy type or galaxy properties.
What is interesting, however, is that the Mgii kinematic spreads for DLA/Hi–Rich systems are tightly clustered around km s-1, have no weak, kinematic outlier clouds, and have intermediate to weak Civ absorption strengths. This is in contrast to those at redshifts –, where strongly absorbing, higher velocity outlying clouds and often “double” profiles are characteristic of low ionization DLA profiles (Lu et al. (1996)).
Whatever physical process or environment gives rise to kinematic outlying Mgii clouds and strong Civ, it is apparently not acting in intermediate redshift DLA/Hi–Rich systems. Alternatively, these trends could be due to selection effects of sightlines through Hi–rich environments, which implies a line–of–sight dependency for absorber class.
6.4. Absorber Class Evolution?
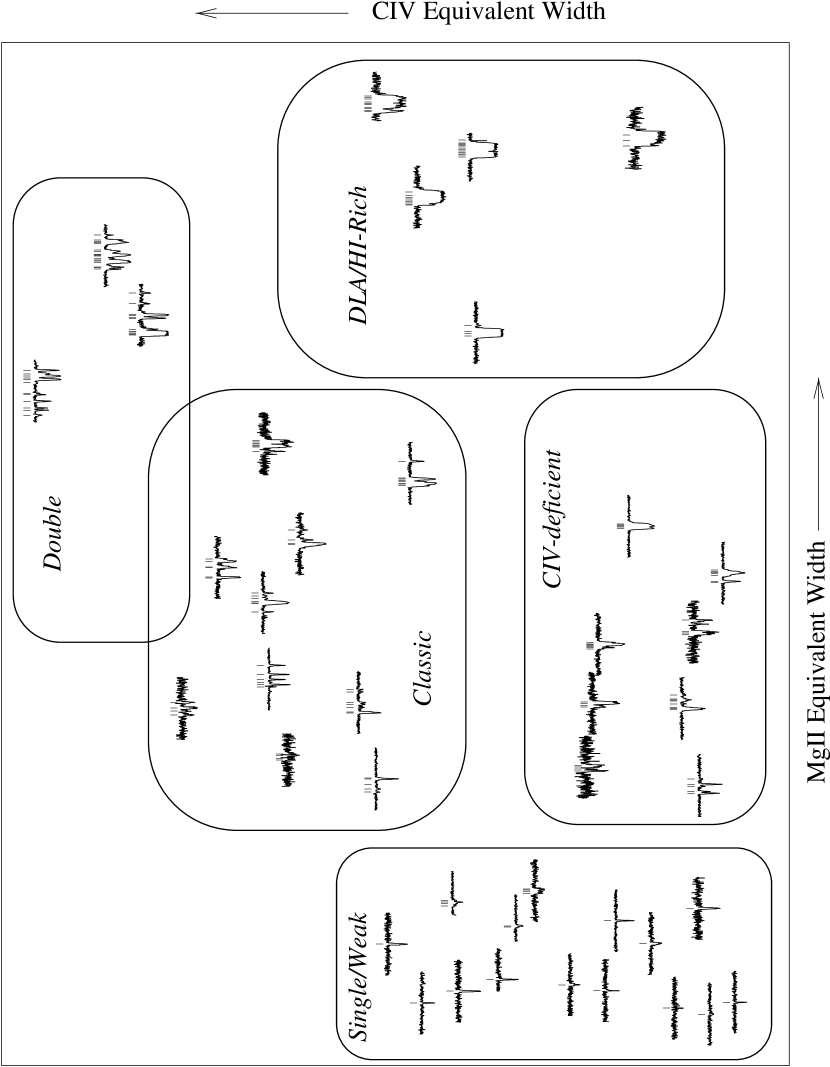
We have shown that there is a signicant correlation between and the Mgii kinematic spread. But, exactly how do the Mgii kinematics vary with for a given ? In Figure 13, we have plotted the Mgii profiles from our HIRES/Keck spectra in the approximate locations they occupy in the – plane. Based upon this schematic, we have an impression of how the kinematic “complexity” of the absorption profile relates to both the Mgii and Civ absorption strengths. Roughly, each of the five classes obtained from our multivariate analysis falls in a well defined region, which we have marked to guide the reader. Note that, in general, the Civ strength is largest when the kinematic “complexity” is the greatest; Civ absorption appears to have no direct connection with the optical depth of the strongest Mgii component, nor with the total number of Voigt profile components. Most remarkably, it would appear that the gross characteristics of the Mgii kinematics can be predicted simply based upon the absorber’s location on the – plane.
Since the distribution of Mgii equivalent widths evolves with redshift (Steidel & Sargent (1992)), and this must be reflected in the Mgii kinematics as well, it seems reasonable to assume that evolution should be discernable on the – plane.
There are at least two possible types of evolution of absorber classes: (1) the number density per unit redshift of a given class could evolve, either diminishing with or increasing with time, and/or (2) any absorber in a given class could evolve into another class. The former is systematic and would indicate a global, cosmic evolution, which might imply the existence of absorber classes not seen in our intermediate redshift sample. The latter form of evolution would be stochastically related to the processes occuring in galaxies and their environs.
We present the observational – plane in Figure 14. The intermediate redshift data (taken from this study) have small, filled circle data points. We have included lower and higher redshifts data from the literature, which we have listed in Table Low and High Ionization Absorption Properties of Mgii Absorption–Selected Galaxies at Intermediate Redshifts. II. Taxonomy, Kinematics, and Galaxies11affiliation: Based in part on observations obtained at the W. M. Keck Observatory, which is operated as a scientific partnership among Caltech, the University of California, and NASA. The Observatory was made possible by the generous financial support of the W. M. Keck Foundation. 22affiliation: Based in part on observations obtained with the NASA/ESA Hubble Space Telescope, which is operated by the STScI for the Association of Universities for Research in Astronomy, Inc., under NASA contract NAS5–26555.. The higher redshift absorbers () are taken from Bergeron & Boissé (1984), Boissé & Bergeron (1985), Lanzetta et al. (1987), and Steidel & Sargent (1992) [six–pointed stars]. The lower redshift points () are taken from Bergeron et al. (1994) [downward pointing, open triangles], and the data555We note that the sample is small and is selected based upon a bright, background quasar having a small projected separation from a nearby galaxy, as opposed to being Mgii–absorption selected (Bowen et al. 1995); this may have introduced a bias, possibly related to impact parameter distribution, as compared to the higher redshift data. are taken from Bowen et al. (1995, 1996), Jannuzi et al. (1998), and Bowen (1999, private communication) [open diamonds]. There are four extraordinary systems listed in Table Low and High Ionization Absorption Properties of Mgii Absorption–Selected Galaxies at Intermediate Redshifts. II. Taxonomy, Kinematics, and Galaxies11affiliation: Based in part on observations obtained at the W. M. Keck Observatory, which is operated as a scientific partnership among Caltech, the University of California, and NASA. The Observatory was made possible by the generous financial support of the W. M. Keck Foundation. 22affiliation: Based in part on observations obtained with the NASA/ESA Hubble Space Telescope, which is operated by the STScI for the Association of Universities for Research in Astronomy, Inc., under NASA contract NAS5–26555. that have ranging from to Å. These have not been presented in Figure 14.
Three points from Figure 14 are that (1) there are absorbers in the higher, lower, and redshift samples with Civ and Mgii strengths typical of each of the five classes found in our clustering analysis of the intermediate redshift systems; (2) there are both higher and redshift absorbers occupying regions of the – that are not represented in our intermediate redshift sample; and (3) as with the intermediate redshift systems, the higher redshift systems exhibit a large range of for a given . Though there is no suggestion for such a spread in the lower redshift systems, there are too few measurements to characterize the spread in values.
Given the fairly systematic dependence of kinematics in the – plane, we can infer that the Mgii kinematics of the lower and higher redshift systems that occupy locations consistent with a given absorber class are likely to be similar to that class’ kinematics.
The higher redshift systems with Å, are a class of absorber not present in our sample. Note the large spread in for these systems, which would suggest that some are “Civ deficient”. This may be indicative that the physical processes giving rise to the range of in intermediate redshift systems are also occuring in these Å, higher redshift systems.
In Figure 15, we present the HIRES/Keck Mgii profiles of four Mgii systems with Å. Note that the profiles are optically thick with virtually unity doublet ratio over a the full velocity span, which is typically or greater. We also show the Mgii profile measured in the spectrum of SN 1993J in M81 using the GHRS on HST (Bowen et al. (1995); spectrum provided courtesy of Dr. D. Bowen). In comparison to the smaller equivalent width, intermediate redshift absorbers, the Mgii kinematics and absorption strengths of these Å systems are clearly unique, exhibiting “double” black–bottomed profiles.
Of the systems shown in Figure 15, only the system toward B2 is represented on Figure 14. Though the Civ strengths of the other systems shown in Figure 15 are unmeasured or unpublished, it is clear that these systems constitute their own unique “class” (with respect to the five classes found in our clustering analysis). As shown in Figure 15, the Mgii kinematics are suggestive of “double–DLAs”, and, in fact, the system toward B2 is a DLA (Bechtold, Green, & York (1987)). In high quality data, “Double–DLAs” might be expected to have slightly asymmetric damping wings, reflecting the different column densities in the two systems.
Steidel & Sargent (1992) found that the number density of these large equivalent systems decreases with redshift over the range (the full range over which the Mgii doublet is observable from the ground). Based upon the SN 1993J spectrum of M81 and the Galaxy in absorption (the line of sight passes through half the disk and halo of M81, half the disk and halo of the Galaxy, and through “intergalactic” material apparently from the strong dwarf–galaxy interactions taking place with both galaxies), one possibility is that these systems arise from two galaxies with low impact parameters that happen to have a line–of–sight superposition.
For this scenario to be consistent with the Mgii absorber evolution, the number of galaxy pairs would need to decrease in step with the evolution of the absorbers themselves over the same redshift regime. In fact, over the redshift interval , it is seen that the galaxy pair fraction, where pairs are defined to have projected separations less than kpc, evolves proportional to , with (Neuschaefer et al. (1997), and references therein). Le Fevre et al. (1999) found a similar, better constrained result with for . These compare well with for Mgii absorbers with Å (Steidel & Sargent (1992); the evolution is probably stronger for those with Å).
As such, galaxy pair evolution remains a plausible scenario as a contribution to the evolution of large equivalent width, higher redshift Mgii absorbers and the class we loosely have called “Double–DLAs”. We note, however, that outflows from very luminous, star bursting galaxies at these high redshifts could also account for some of these “super” systems, since the low ionization gas can be very prominent in absorption (Pettini et al. (1999)).
7. Summary
We have performed a multivariate analysis of the absorption strengths and kinematics of Mgii and the absorption strengths of Feii, Ly, and Civ for a sample of 45 Mgii absorption–selected systems. Descriptions of the survey and analysis of the data used herein have been presented in Churchill et al. (1997, 1999a) and in Paper I. The multivariate analysis was performed using the STATISTICA package (www.statsoft.com). We applied both a “Tree Clustering” and “–means Clustering” analysis to the 30 systems in Sample CA from the data listed in Table Low and High Ionization Absorption Properties of Mgii Absorption–Selected Galaxies at Intermediate Redshifts. II. Taxonomy, Kinematics, and Galaxies11affiliation: Based in part on observations obtained at the W. M. Keck Observatory, which is operated as a scientific partnership among Caltech, the University of California, and NASA. The Observatory was made possible by the generous financial support of the W. M. Keck Foundation. 22affiliation: Based in part on observations obtained with the NASA/ESA Hubble Space Telescope, which is operated by the STScI for the Association of Universities for Research in Astronomy, Inc., under NASA contract NAS5–26555..
We have also compared the low, intermediate, and high ionization absorption properties of 16 systems with the and luminosities, colors, and impact parameters of their host galaxies. The full complement of absorption line data was taken from Paper I. The galaxy properties, listed in Table Low and High Ionization Absorption Properties of Mgii Absorption–Selected Galaxies at Intermediate Redshifts. II. Taxonomy, Kinematics, and Galaxies11affiliation: Based in part on observations obtained at the W. M. Keck Observatory, which is operated as a scientific partnership among Caltech, the University of California, and NASA. The Observatory was made possible by the generous financial support of the W. M. Keck Foundation. 22affiliation: Based in part on observations obtained with the NASA/ESA Hubble Space Telescope, which is operated by the STScI for the Association of Universities for Research in Astronomy, Inc., under NASA contract NAS5–26555., are taken from the survey of Steidel et al. (1994) and the previous studies of Churchill et al. (1996) and Steidel et al. (1997). We tested for absorption–galaxy property correlations using Kendall and Spearman non–parametric rank correlation indicators as implemented with the program ASURV (LaValley, Isobe, & Feigelson (1992)), which incorporates upper limits on the data.
The main results are summarized as follows:
1. The clustering analysis revealed that there is a wide range of properties for Mgii–selected absorbers and that these can be categorized into three main types (Figure 2). Based upon strong and , there is the class of DLA/Hi–Rich Mgii absorbers. For the remaining systems, there is a spread in the Civ strengths for a given that gives rise to ‘Civ–weak” and “Civ–strong” systems.
2. The Civ–weak class separates into the Single/Weak and the Civ–deficient classes (Figures 2 and 3). Single/Weak systems are characterized by a single unresolved Mgii absorption line with Å, a velocity spread of km s-1, and a range of Civ strengths, but with no greater than Å (in our sample). The Mgii strengths and kinematics are the dominant properties in distinguishing them as a separate class. Civ–deficient systems have multiple Voigt profile components, , a range of kinematic spreads, km s-1, and no stronger than Å. The Civ strength, and to a lesser degree the Mgii kinematics, are the dominant properties distinguishing this as a Civ–weak class.
3. The Civ–strong class separates into the Classics and the Doubles (Figures 2 and 3). Classic systems, like the Civ–deficient systems, have multiple Voigt profile components, and a similar, but slightly larger, range of kinematic spread. The Civ strengths, on the other hand, are greater than Å. Separate from the Classics are the Doubles, which are characterized by roughly twice the number of Voigt profile components, , twice the Civ strength, and twice the Mgii kinematic spread, as compared to the Classics.
4. The Mgii, and Ly strengths are tightly correlated with the number of Mgii Voigt profile components, (see Figure 6). The tight correlation between and implies that the majority of the neutral hydrogen is arising in the phase giving rise to the Mgii absorption. In single cloud, , systems (the Single/Weak class), ranges from – Å and ranges from less than to Å, suggesting a range of metallicities and/or ionization conditions in this class of object.
5. There is a highly significant correlation between and (see Figure 5; also see Churchill et al. 1999b ). This correlation is driven by the five absorbers (two Classics and three Doubles) with the largest . For km s-1 there is a Å spread in , due to the Civ–deficient systems and the Single/Weak systems with larger . More systems with km s-1 are needed in order to determine if all “kinematically active” Mgii absorbers have such strong Civ.
6. Assuming the Mgii clouds are in photoionization equilibrium, we showed that in many systems a substantial fraction of the Civ absorption is arising in a separate phase from the Mgii (see Figure 7). We also showed that some fraction of the systems likely have Siiv in a separate phase from the Mgii. The FOS profiles of the larger Civ absorbers (Classics with large Civ and Doubles) are resolved due to the kinematic spread, or velocity structure, of the Civ phase. A quantity expressing the degree to which the profiles are resolved, , correlates at the 99.99% confidence level with the Mgii kinematic spread. Furthermore, there is a clear impression that the asymmetries in the resolved Civ profiles trace the Mgii kinematics. The above facts lead us to suggest that, often, some of the Civ arises in a physically distinct phase from the Mgii gas, but is kinematically clustered with the Mgii clouds.
7. For our small sample of 16 galaxies, we find no significant trends (greater than ) of Civ and Ly, or their ratios with each other and with Mgii, with host galaxy and luminosities, colors, and impact parameters. DLA/Hi–Rich systems, which have systematically smaller impact parameters and redder colors, significantly affect the outcome of correlation tests. The Civ and Ly absorption properties do not smoothly depend upon global galaxy properties. At , we find that decreases with impact parameter, which could be interpreted as very tentative evidence for a global galactocentric ionization/density gradient (see Figure 11). The available data also show marginal trends for redder galaxies to have lower ionization conditions (Figure 12). This is suggestive that Civ phases may be systematically smaller in the redder galaxies.
8. We found that the Mgii kinematics of a given absorber is related to its location in the – plane. In a comparison of our intermediate redshift sample ( with published low redshift () and high redshift () samples, we found evidence for redshift evolution in the – plane. This implies that other “classes” of absorbers are present at high redshift, possibly including a “Double DLA/Hi–Rich” class. There is also a group of “super” Mgii systems at that have a large range of values. We disussed a scenario in which the evolution of these strongest Mgii absorbers could be due to the evolution of the number of galaxy pairs and/or accreting LMC–like satellite galaxies.
7.1. Further Ruminations
In general, the observed range of Mgii kinematics and Civ absorption strengths could be due to a number of factors. These include global differences in gaseous conditions related to environment (i.e. group or isolated galaxies) or galaxy morphology, local variations dominated by passage through different parts of host galaxies (e.g. halos, outer disks, spiral arms, etc.), or small scale fluctuations in galactic interstellar and halo structures. An additional important issue is whether characteristic absorption properties might be tied to the evolutionary stage of the host galaxy. This would imply that a given host galaxy may not always be of the same “absorber class” throughout its evolution.
At higher redshifts (), galaxy–galaxy interactions were more common and no doubt played an important role in the kinematics and multiphase ionization conditions in many Mgii absorbers (e.g. Carilli & van Gorkom (1992); Bowen & Blades (1993); Bowen et al. (1995)). A local analogue is seen in absorption associated with M61, a nearly face–on, later–type galaxy with enhanced star formation. The Mgii velocity spread is km s-1 at an impact parameter 21 kpc and there are two nearby galaxies (Bowen et al. (1996)).
Since it is the kinematic complexity and spread and not the total amount of the Mgii that appears to be the important property for predicting the Civ strength in galaxies, it is not unreasonable to conjecture that sources of mechanical energy (i.e. active star formation) may be of central importance (see Guillemin & Bergeron (1997)). Extended multiphase halos are seen preferentially around late–type spiral galaxies with signs of elevated star formatiopn (see Dahlem (1998) and references therein). In fact, a basic scenario which might explain both the taxonomy of Mgii absorbers (especially the Double and Civ–deficient systems) and the Civ–Mgii kinematics connection, is one in which star formation processes accelerate hot, ionized gas outward, which subsequently cools and fragments into parcels of low ionization gas (e.g. Houck & Bregman (1990); Li & Ikeuchi (1992); Avillez (1999)). These parcels would be observed as outlying kinematic components in the Mgii profiles.
These points are somewhat suggestive of a causal connection between evolution in the cosmic star formation rate and absorbing gas cross sections, kinematics, and ionization conditions. If true, we could hypothesize that scenarios of a cosmic mean history of galaxy evolution inferred from the global record of star formation history should be fully consistent with one based upon an “absorption line perspective”.
The global star formation rate appears to drop below (Lilly et al. (1996); Madau, Lucia, & Dickinson (1998); however, see Cowie, Songaila, & Barger (1999)), implying a reduction in the (infalling) gas reservoir for galaxies. It could be that a majority of galaxies transform into self–regulatory systems by and begin to evolve in a more isolated fashion and in a direction dependent upon their ability to continue forming stars. Galaxies that are rich in gas and capable of forming large numbers of molecular clouds in their interstellar media (i.e. late–type galaxies) would continue to form stars and exhibit evolution, whereas those less capable would exhibit no discernable evolution. Such a scenario is consistent with the differential luminosity evolution reported by Lilly et al. (1995) and is not inconsistent with the tentative trends we see between galaxy color and ionization conditions (also see Guillemin & Bergeron (1997)).
It is unfortunate that there currently are no Mgii absorption–line samples for the highest redshifts (), so an absorption line perspective cannot yet be fully appreciated [however, see the theoretical predictions of Rauch, Haehnelt, & Steinmetz (1997)].
References
- Avillez (1999) Avillez, M. A., 1999, in The Stromlo Workshop on High Velocity Clouds, ASP Conference Series, Vol. 666, in press (astro–ph/9901056)
- Babu & Feigelson (1996) Babu, G. J., & Feigelson, E. D. 1996, Astrostatistics, (London : Chapman & Hall)
- Bahcall et al. (1993) Bahcall, J. N., etal. 1993, ApJS, 87, 1
- Bahcall et al. (1996) Bahcall, J. N., etal. 1996, ApJ, 457, 19
- Bechtold, Green, & York (1987) Bechtold, J., Green, R. F., & York, D. G 1987, ApJ, 312, 50
- Bergeron & Boissé (1984) Bergeron, J., & Boissé, P. 1984, A&A, 133, 374
- Bergeron & Boissé (1991) Bergeron, J., & Boissé, P. 1991, A&A, 243, 344
- Bergeron et al. (1992) Bergeron, J., Christiani, S., & Shaver, P. 1992, A&A, 257, 417
- Bergeron et al. (1994) Bergeron, J., et al. 1994, ApJ, 436, 33
- Boissé & Bergeron (1985) Boissé, P., & Bergeron, J. 1985, A&A, 145, 59
- Boissé et al. (1998) Boissé, P., Le Brun, V., Bergeron, J., Deharveng, J.–M. 1998, A&A, 333, 841
- Bowen (1999) Bowen, D. V., 1999, private communication
- Bowen & Blades (1993) Bowen, D. V., & Blades, J. C. 1993, ApJ, 403, 55
- Bowen et al. (1996) Bowen, D. V., Blades, J. C., & Pettini, M. 1996, ApJ, 472, L77
- Bowen et al. (1995) Bowen, D. V., Blades, J. C., & Pettini, M. 1995, ApJ, 448, 634
- Bruzual & Charlot (1993) Bruzual, G., & Charlot, S. 1993, ApJ, 405,538
- Carilli & van Gorkom (1992) Carilli, C. L. & van Gorkom, J. H. 1992, ApJ 399, 373
- Charlton & Churchill (1996) Charlton, J. C., & Churchill, C. W. 1996, ApJ, 465, 631
- Charlton & Churchill (1998) Charlton, J. C., & Churchill, C. W. 1998, ApJ, 499, 181
- Churchill (1997) Churchill, C. W. 1997, Ph.D. Thesis, University of California, Santa Cruz
- Churchill & Charlton (1999) Churchill, C. W., & Charlton, J. C. 1999, AJ, 118, 59
- (22) Churchill, C. W., Rigby, J. R., Charlton, J. C., & Vogt, S. S. 1999a, ApJS, 120, 51
- (23) Churchill, C. W., Mellon, R. R., Charlton, J. C., Jannuzi, B. T., Kirhakos, S., Steidel, C. C., & Schneider, D. P. 1999b, ApJ, 519, L43
- Churchill et al. (2000) Churchill, C. W., Mellon, R. R., Charlton, J. C., Jannuzi, B. T., Kirhakos, S., Steidel, C. C., & Schneider, D. P. 2000, ApJ, submitted (Paper I)
- Churchill et al. (1996) Churchill, C. W., Steidel, C. C., & Vogt, S. S. 1996, ApJ, 471, 164
- Cowie, Songaila, & Barger (1999) Cowie, L. L., Songaila, A. & Barger, A. J. 1999, AJ, 118, 603
- Dahlem (1998) Dahlem, M. 1998, PASP, 109, 1298
- Ferland (1996) Ferland, G. J. 1996, Hazy, University of Kentucky Internal Report
- Guillemin & Bergeron (1997) Guillemin, P., & Bergeron, J. 1997, A&A, 328, 499
- Haardt & Madau (1996) Haardt, F., & Madau, P. 1996, ApJ, 461, 20
- Hernquist & Mihos (1995) Hernquist, L., & Mihos, J. C., ApJ, 488, 41
- Houck & Bregman (1990) Houck, J. C., & Bregman, J. N. 1990, ApJ, 352, 506
- Hibbard & van Gorkom (1996) Hibbard, J. E., & van Gorkom, J. H. 1996, AJ, 111, 655
- Hubble (1936) Hubble, E. 1936, The Realm of the Nebulae, (New Haven : Yale University Press)
- Hummel et al. (1990) Hummel, E., van der Hulst, J. M., Kennicutt, R. C., & Keel, W. C. 1990, A&A, 236, 333
- Irwin (1995) Irwin, J. I. 1995, PASP, 107, 715
- Jannuzi et al. (1998) Jannuzi, B. T., et al. 1998, ApJS, 118, 1
- Johnson & Wichern (1992) Johnson, R. A., & Wichern, D. W. 1992, Applied Multivariate Statistical Analysis, (Upper Saddle Rive : Prentice–Hall)
- Knapp, Turner, & Cunniffe (1985) Knapp, G. R., Turner, E. L., & Cunniffe, P. E. 1985, AJ, 90, 454
- Lanzetta & Bowen (1990) Lanzetta, K. M., & Bowen, D. V. 1992, ApJ, 357, 321
- Lanzetta & Bowen (1992) Lanzetta, K. M., & Bowen, D. V. 1992, ApJ, 391, 48
- Lanzetta, Turnshek, & Wolfe (1987) Lanzetta, K. M., Turnshek, D. A., & Wolfe, A. M. 1987, ApJ, 322, 739
- LaValley, Isobe, & Feigelson (1992) La Valley, M., Isobe, T., & Feigelson, E. 1992, in Astronomical Data Analysis Software and Systems I, ASP Conf. Series, V25, D.M. Worrall, C. Biemesderfer, & J. Barnes, eds., 245
- Le Brun et al. (1993) Le Brun, V., Bergeron, J., Boissé, P., & Christian, C. 1993, A&A, 297, 33
- Le Brun et al. (1997) Le Brun, V., Bergeron, J., Boissé, P., & Deharveng, J. M. 1997, A&A, 321, 733
- Le Fevre et al. (1999) Le Fèvre, O., Abraham, R., Lilly, S. J., Ellis, R. S., Brinchmann, J., Schade, D., Tresse, L., Colles, M., Crampton, D., Glazebrook, K., Hammer, F., & Broadhurst, T. 1999, MNRAS, in press (astro–ph/990921)
- Li & Ikeuchi (1992) Li, F., & Ikeuchi, S. 1992, ApJ, 390, 405
- Lilly et al. (1996) Lilly, S. J., Le Fèvre, O., Hammer, F., & Crampton, D. 1996, ApJ, 460, L1
- Lilly et al. (1995) Lilly, S. J., Tresse, L., Hammer, F., Crampton, D., Le Fèvre, O. 1995, ApJ, 455, 108
- Lu et al. (1996) Lu, L., Sargent, W. L. W., Barlow, T. A., Churchill, C. W., & Vogt, S. S. 1996, ApJS, 107, 475
- Lutz (1992) Lutz, D. 1992, A&A, 315, L137
- Madau, Lucia, & Dickinson (1998) Madau, P., Lucia, P. & Dickinson, M. 1998, ApJ, 498, 106
- Mathews & Brighenti (1998) Mathews, W. G., & Brighenti, F. 1998, in Galactic Halos: A UC Santa Cruz Workshop, ASP Conf. Series, V136, ed. D. Zaritsky (San Francisco : PASP), 277
- McLin, Giroux, & Stocke (1998) McLin, K. M., Giroux, M. L., & Stocke, J. T. 1998, in Galactic Halos: A UC Santa Cruz Workshop, ASP Conf. Series, V136, ed. D. Zaritsky (San Francisco : PASP), 175
- Mo & Miralda–Escudé (1996) Mo, H. J., & Miralda-Escudé, J. 1996, ApJ, 469, 589
- More (1978) More, J. J. 1978, in Numerical Analysis Proceedings, ed. G.A. Watson, Lecture Notes in Mathematics (Garching : Springer–Verlag), 630
- Morganti, Oosterloo, & Tsvetanov (1998) Morganti, R., Oosterloo, T., & Tsvetanov, Z. 1998, AJ, 115, 915
- Mukherjee et al. (1998) Mukherjee, S., Feigelson, E. D., Babu, G. J., Murtagh, F., Fraley, C., & Raftery, A. 1998, ApJ, 508
- Mulchaey et al. (1996) Mulchaey, J. S., Mushotzky, R. F., Burstein, D., & Davis, D. S. 1996, ApJ, 456, L5
- Neuschaefer et al. (1997) Neuschaefer, L. W., Im, M., Ratnatunga, K. U., Griffiths, R. E., & Casertano, S. 1997, ApJ, 480, 59
- O’Connell (1999) O’Connell, R. W. 1999, ARA&A, in press (astro–ph/9906068)
- Patton et al. (1997) Patton, D. R., Pritchet, C. J., Yee, H. K. C., Ellingson, E., & Carlberg, R. G. 1997, AJ, 475, 29
- Petitjean & Bergeron (1990) Petitjean, P., & Bergeron, J. 1990, A&A, 231, 309
- Petitjean & Bergeron (1994) Petitjean, P., & Bergeron, J. 1994, A&A, 283, 759
- Pettini et al. (1999) Pettini, M., Steidel, C. C., Adelberger, K. L., Dickinson, M., & Giavalisco, M. 1999, ApJ, in press (astro–ph/9908007)
- Rao & Turnshek (1998) Rao, S. M., & Turnshek, D. A. 1998, ApJ, 500, L115
- Rao & Turnshek (1999) Rao, S. M., & Turnshek, D. A. 1999, (astro–ph/9909164)
- Rauch et al. (1997) Rauch, M., Haehnelt, M. G., & Steinmetz, M. 1997, ApJ, 481, 601
- Rigby et al. (1999) Rigby, J. R., Charlton, J. C., Churchill, C. W., Jannuzi, B. T., Kirhakos, S., & Vogt, S. S. 1999, in preperation
- Sargent, Boksenberg, & Steidel (1988) Sargent, W. L. W., Boksenberg, A., & Steidel, C. C., 1988, ApJS, 68, 539
- Savage & Sembach (1991) Savage, B. D., & Sembach, K. R. 1991, ApJ, 379, 245
- Savage, Sembach, & Lu (1997) Savage, B. D., Sembach, K. R., & Lu, L. 1997, AJ, 113, 2158
- Sembach & Savage (1992) Sembach, K. R., & Savage, B. D. 1992, ApJS, 83, 147
- (74) Sembach, K. R., Savage, B. D., & Hurwitz, M. 1999, astro-ph/9905343
- Steidel (1993) Steidel, C. C. 1993, in The Environment and Evolution of Galaxies, eds. J. M. Shull & H. A. Thronson, Jr. (Dordrecht : Kluwer), 263
- Steidel (1995) Steidel, C. C. 1995, in QSO Absorption Lines, ed. G. Meylan (Garching : Springer Verlag), 139
- Steidel (1998) Steidel, C. C. 1998, in Galactic Halos: A UC Santa Cruz Workshop, ASP Conf. Series, V136, ed. D. Zaritsky (San Francisco : PASP), 167
- Steidel et al. (1997) Steidel, C. C., Dickinson, M., Meyer, D. M., Adelberger, K. L., & Sembach, K. R. 1997, ApJ, 480, 568
- Steidel et al. (1994) Steidel, C. C., Dickinson, M. & Persson, E. 1994, ApJ, 437, L75
- Steidel & Sargent (1992) Steidel, C. C., & Sargent, W. L. W. 1992, ApJS, 80, 1
- van Gorkom (1992) van Gorkom, J. H. 1992, in Morphological and Physical Classifications of Galaxies, eds. G. Longo, M. Capaccioli, & G. Busarello (Kluwer Academic), 223
- Vogt et al. (1994) Vogt, S. S., et al. 1994, in Proceedings of the SPIE, 2128, 326
- Ward (1963) Ward, J. H. 1963, Journal of the American Statistical Association, 58, 236
- Yanny (1992) Yanny, B. 1992, PASP, 104, 840
- Yanny & York (1992) Yanny, B., and York, D. G. 1992, ApJ, 391, 569
TABLE 1 Absorber Properties QSO [Å] [km/s] [Å] [Å] [Å] Samplesc Class 0.5915 1 a IC Sngl/Wk 0.8514 12 CA Double 0.8665 1 a IC Sngl/Wk 0.9560 1 CA,IC Sngl/Wk 0.6127 7 DLA/Hi 0.7252 1 Sngl/Wk 0.5764 4 a CA DLA/Hi 0.7291b 5 IC Civ–def 1.0480 7 CA,IC Civ–def 1.3250 6 CA,IC Classic 1.3430b a 5 a CA,IC Classic 0.4744 8 CA DLA/Hi 0.4833 7 CA,IC Civ–def 0.6428 1 CA,IC Sngl/Wk 0.8596 12 CA DLA/Hi 0.9315 1 a IC Sngl/Wk 1.1532b 7 CA,IC Classic 0.7055 1 IC Sngl/Wk 0.9110b 18 CA,IC Double 1.2113 1 Sngl/Wk 1.2724 1 CA,IC Sngl/Wk 0.9276 12 CA,IC Double 0.9343 1 CA,IC Sngl/Wk 0.5505 4 IC Classic 0.5584 4 IC Sngl/Wk 0.8955 1 IC Sngl/Wk 0.7730 8 CA,IC Classic 0.8546b 7 CA,IC Classic 0.6601b 8 CA,IC Civ–def 0.5008 4 A Civ–def 0.8933 4 a A,CA Civ–def 0.9739 4 CA Classic 0.9984 1 CA Sngl/Wk 0.4566 7 CA Classic 0.5215 1 IC Sngl/Wk 0.4720 1 A Classic: 0.6561 3 A,CA DLA/Hi 0.7971 4 CA Classic 0.8913 10 CA DLA/Hi 0.8182 1 IC Sngl/Wk 0.9056 1 CA,IC Sngl/Wk 0.9902 5 CA,IC Civ–def 1.0414 4 CA,IC Sngl/Wk 0.4297 4 a CA Civ–def 0.7908 6 CA,IC Classic a Not “flag” transition; see system notes (§3) b Measurement of was censored (see text). Uncensored values are 46.8 km s-1 (, ), 45.1 km s-1 (, ), c Sample A: systems with detection limits greater then Å. Sample CA: systems used for multivariate Cluster Analysis . Sample IC: systems used for Ionization Condistions analysis.
| TABLE 2 | ||||||
| Galaxy Properties | ||||||
| QSO | Reference | |||||
| (kpc) | ||||||
| Churchill et al. (1996) | ||||||
| Churchill et al. (1996) | ||||||
| This paper | ||||||
| Churchill et al. (1996) | ||||||
| Churchill et al. (1996) | ||||||
| Churchill et al. (1996) | ||||||
| This paper | ||||||
| Churchill et al. (1996) | ||||||
| Churchill et al. (1996) | ||||||
| Churchill et al. (1996) | ||||||
| This paper | ||||||
| Steidel et al. (1997) | ||||||
| Churchill et al. (1996), Steidel et al. (1997) | ||||||
| Churchill et al. (1996), Steidel et al. (1997) | ||||||
| This paper | ||||||
| This paper | ||||||
| a Recent analysis of a WFPC2/HST image revealed a previously unseen galaxy within 1″ of the QSO. This | ||||||
| galaxy identification should be viewed with caution. | ||||||
| b extrapolated from –band image using an Im spectroscopic template consistent with the color. | ||||||
| TABLE 3 | ||||
| Mgii and Civ Equivalent Widthsa from the Literature | ||||
| QSO | [Å] | [Å] | References | |
| Mrk 205 | BB93 | |||
| BBP96 | ||||
| B99,J98 | ||||
| BBP95 | ||||
| B94 | ||||
| B94 | ||||
| B94 | ||||
| B94 | ||||
| SS92 | ||||
| BB85 | ||||
| BB85 | ||||
| SS92 | ||||
| LTW87 | ||||
| SS92 | ||||
| LTW87 | ||||
| SS92 | ||||
| BB84 | ||||
| SS92 | ||||
| LTW87 | ||||
| SS92 | ||||
| SS92 | ||||
| SS92 | ||||
| SS92 | ||||
| SS92 | ||||
| SS92 | ||||
| SS92 | ||||
| SS92 | ||||
| LTW87 | ||||
| SS92 | ||||
| SS92 | ||||
| SS92 | ||||
| SS92 | ||||
| SS92 | ||||
| SS92 | ||||
| SS92 | ||||
| SS92 | ||||
| LTW87 | ||||
| LTW87 | ||||
| SS92 | ||||
| LTW87 | ||||
| SS92 | ||||
| SS92 | ||||
| LTW87 | ||||
| SS92 | ||||
| SS92 | ||||
| SS92 | ||||
| SS92 | ||||
| a Equivalent widths are rest frame. | ||||
| b Does not appear on Figure 14. | ||||
| References:— (BB84) Bergeron & Boissé 1984; (BB85) Boissé & Bergeron 1985; | ||||
| (LTW87) Lanzetta et al. 1987; (BB93) Bowen & Blades 1993; (B94) Bergeron | ||||
| et al. 1994; (BBP95) Bowen et al. 1995; (BBP96) Bowen et al. 1996; (SS92) | ||||
| Steidel & Sargent 1992; (J98) Jannuzi et al. 1998; (B99) Bowen 1999. | ||||