Low and High Ionization Absorption Properties of Mgii Absorption–Selected Galaxies at Intermediate Redshifts. I. General Properties11affiliation: Based in part on observations obtained at the W. M. Keck Observatory, which is operated as a scientific partnership among Caltech, the University of California, and NASA. The Observatory was made possible by the generous financial support of the W. M. Keck Foundation. 22affiliation: Based in part on observations obtained with the NASA/ESA Hubble Space Telescope, which is operated by the STScI for the Association of Universities for Research in Astronomy, Inc., under NASA contract NAS5–26555.
Abstract
We present extensive metal–line absorption properties for 45 absorption systems that were selected by their Mgii absorption at redshifts between 0.4 and 1.4. For each system the properties of several chemical species are determined, including a wide range of ionization conditions. In the optical, the absorption systems have been observed at km s-1 resolution with HIRES/Keck, which covered Mgii, several Feii transitions, Mgi, and in some cases (depending upon redshift), Caii, Tiii, Mnii, and Aliii. Ultraviolet, lower resolution ( km s-1) Faint Object Spectrograph data (1600 Å–3275 Å) were obtained from the Hubble Space Telescope archive. These spectra covered Alii, Aliii, Siii, Siiii, Siiv, Cii, Ciii, Civ, Nv, Ovi, and several Lyman series transitions, with coverage dependent upon the absorption system redshift. From these data, we infer that Mgii absorbing galaxies at intermediate redshifts have multiphase gaseous structures.
Subject headings:
quasars— absorption lines; galaxies— evolution; galaxies— halos1. Introduction
During the last decade a great deal of progress has been made toward understanding the physical properties of intervening metal–line absorption systems measured in the spectra of high redshift quasars. This is particularly true at intermediate redshifts, , for absorbers selected by the presence of the resonant Mgii doublet (e.g. Lanzetta, Turnshek, & Wolfe (1987); Tytler et al. (1987); Sargent, Boksenberg, & Steidel (1988); Petitjean & Bergeron (1990), Steidel & Sargent (1992)). One of the most notable achievements was the demonstration that Mgii absorbers with Å are almost always associated with galaxies (Bergeron & Boissé (1991); Steidel (1995)). Those works substantiated the –year standing hypothesis by Bahcall & Spitzer (1969) that metal–line absorption in quasar spectra arises in extended gaseous envelopes surrounding intervening galaxies.
The general picture today is that a wide variety of morphological types (from ellipticals to irregulars) have gaseous “halos” that extend to roughly 40 kpc, with the most common being Sbc–Scd types (Steidel, Dickinson, & Persson 1994; Guillemin & Bergeron (1997)). The line–of–sight gas kinematics of the absorbers is consistent with that expected for material bound in galactic potential wells (Petitjean & Bergeron (1990); Churchill, Steidel, & Vogt 1996; Charlton & Churchill (1998)). This picture, however, is not without its counter examples or ambiguities. In some cases there is evidence that compact star forming objects spread out over kpc are seen at the Mgii absorption redshift and there is no directly associable bright galaxy (Yanny (1992); Yanny & York (1992)). It is also not yet established whether the more numerous “weak” Mgii absorbers, those with Å, are related to galaxies similar in type to those associated with “strong” Mgii absorption. There is mounting evidence that a fair number of the weak systems do not arise within kpc of normal, bright galaxies (Churchill & Le Brun (1998); Churchill et al. 1999a ).
What are the typical low to high ionization absorption conditions in intermediate redshift Mgii absorption–selected galaxies? Do the majority of Mgii systems have an associated high ionization phase as seen in Siiv, Civ, Nv, and Ovi absorption? Are there any trends between the high ionization and low ionization absorption strengths? Are there other relationships (or lack of relationships!) that provide clues to the physical nature of galactic gas at intermediate redshifts?
Motivated by these and similar questions, we have undertaken a program to measure the absorption properties of a wide variety of chemical and ionization species associated with Mgii absorbers. Unique to our study is that the Mgii systems have been observed at high resolution ( km s-1) with HIRES/Keck I (Churchill (1997)). These spectra also provide a population of weak systems, which are significantly more numerous in their redshift path density (Churchill et al. 1999a ). The HIRES spectra cover Mgii, several Feii transitions, Mgi, and depending upon redshift coverage, Caii, Tiii, Mnii, and Aliii. The remaining absorption properties, including neutral hydrogen and higher ionization species, have been measured in lower resolution ( km s-1) spectra obtained from the Hubble Space Telescope archive of the Faint Object Spectrograph.
In this paper, we present the measurements of the absorption lines found in the FOS spectra. Additional analysis focused on the above motivational questions is presented in a parallel companion paper (Churchill et al. (2000), hereafter Paper II). In § 2, we outline our sample selection. Details of the data analysis are presented in § 3. In § 4, we provide a brief description of each system. The general absorption properties are presented in § 5 and a brief synopsis is given in § 6.
2. Sample Selection
The Mgii systems for our study were selected from the samples of Steidel & Sargent (1992, hereafter SS92) and Sargent, Boksenberg, & Steidel (1988, hereafter SBS). We obtained HIRES spectra (Vogt et al. (1994)) on the Keck I telescope of many of the brightest quasars from the SS92 and SBS database. The optical wavelength coverage for our HIRES spectra translates to a redshift interval of for 28 Mgii systems. An additional 23 systems with equivalent widths below the detection threshold in the SS92 and SBS quasar spectra were discovered in the HIRES spectra, which have a detection threshold of Å (Churchill et al. 1999a ). In order to study the wealth of ionization species with transitions further into the ultraviolet, we then searched the Hubble Space Telescope archive for Faint Object Spectrograph (FOS) observations of the quasars observed with HIRES/Keck. A number of the FOS spectra were obtained fully reduced from the HST QSO Absorption Line Key Project (hereafter KP, Bahcall et al. (1993); Bahcall et al. (1996); Jannuzi et al. (1998)). The remaining FOS spectra were obtained from the HST archive and reduced using the same methodology as for the KP spectra.
The journal of the HIRES/Keck observations is given in Table Low and High Ionization Absorption Properties of Mgii Absorption–Selected Galaxies at Intermediate Redshifts. I. General Properties11affiliation: Based in part on observations obtained at the W. M. Keck Observatory, which is operated as a scientific partnership among Caltech, the University of California, and NASA. The Observatory was made possible by the generous financial support of the W. M. Keck Foundation. 22affiliation: Based in part on observations obtained with the NASA/ESA Hubble Space Telescope, which is operated by the STScI for the Association of Universities for Research in Astronomy, Inc., under NASA contract NAS5–26555.. The spectral resolution was , which corresponds to km s-1. From left to right, the columns are the quasar name, the visual magnitude, the emission redshift, the observation date, the total exposure time, and the observed wavelength range. In the continuum near the observed Mgii features, the spectra have signal–to–noise ratios ranging from 15 to 50, with the majority being around 30. The spectra do not have continuous wavelength coverage; there are small gaps redward of 5100 Å, where the free spectral range of the projected echelle format exceeds the width of the Tektronix CCD.
There are several FOS observational modes, including grating, polarimetry, and slit settings. We have chosen to limit our survey to the highest resolution spectra (), obtained with the G130H (1150–1600 Å), G190H (1600–2300 Å) and G270H (2225–3275 Å) gratings. We chose to exclude spectra obtained at lower resolution in order to maintain uniformity and because they are not very useful for narrow–line absorption work. However, we did use a lower resolution G160L spectrum (in one case) to search for a Lyman limit break. We also opted to exclude spectropolarimetry data because they required additional reduction and calibration steps that did not yield spectra of comparable quality to those obtained with non–spectropolarimetry mode. However, when available, we did use spectropolarimetry data to search for Lyman limit breaks and damped Ly lines at the absorber redshifts. Finally, we excluded spectra with slit widths greater than ″. Some of the FOS spectra in our sample were obtained before the COSTAR refurbishing mission. The instrumental spread function of pre–COSTAR spectra introduces broad wings in proportion to the aperture width of the observing mode (Jannuzi & Hartig (1994)). We studied only those FOS spectra obtained with fairly narrow apertures in order to mitigate systematics in the absorption line strengths between the pre–COSTAR and COSTAR spectra.
The final selection of FOS spectra are listed in Table Low and High Ionization Absorption Properties of Mgii Absorption–Selected Galaxies at Intermediate Redshifts. I. General Properties11affiliation: Based in part on observations obtained at the W. M. Keck Observatory, which is operated as a scientific partnership among Caltech, the University of California, and NASA. The Observatory was made possible by the generous financial support of the W. M. Keck Foundation. 22affiliation: Based in part on observations obtained with the NASA/ESA Hubble Space Telescope, which is operated by the STScI for the Association of Universities for Research in Astronomy, Inc., under NASA contract NAS5–26555.. From left to right the columns are the quasar name, the alias useful for searching the HST archive, the program identification numbers, and the names of the principal investigators for each of the gratings. The observing modes of the KP spectra are described in Jannuzi et al. (1998); the slit widths are all less than ″. The observing modes of the non–KP spectra vary and are noted in § 4, where each spectrum is individually discussed. We also excluded quasars with complicated broad absorption line features. We make no corrections to these narrow aperture pre–COSTAR spectra and assume a Gaussian instrumental spread function (e.g. Schneider et al. (1993)) for measuring equivalent widths in all FOS spectra.
These selection criteria resulted in a sample of 45 Mgii absorbing systems. These systems and their rest–frame equivalent widths are listed in Table Low and High Ionization Absorption Properties of Mgii Absorption–Selected Galaxies at Intermediate Redshifts. I. General Properties11affiliation: Based in part on observations obtained at the W. M. Keck Observatory, which is operated as a scientific partnership among Caltech, the University of California, and NASA. The Observatory was made possible by the generous financial support of the W. M. Keck Foundation. 22affiliation: Based in part on observations obtained with the NASA/ESA Hubble Space Telescope, which is operated by the STScI for the Association of Universities for Research in Astronomy, Inc., under NASA contract NAS5–26555.. The first three columns are the quasar name, the absorber redshift, and the Mgii rest–frame equivalent width, . The remaining columns are explained in § 4. In Figure 1, we show a plot of vs. absorber redshift, . Note that the sample is devoid of Å systems for . This is not surprising because the total redshift path above covered by the HIRES spectra is very small compared to the coverage from and because small equivalent width systems are very common.
The distribution of is shown in Figure 2. Using a maximum likelihood fit (e.g. Lanzetta, Turnshek, & Wolfe (1987)), we find that the distribution of our sample follows a power–law with for Å, which is consistent with that of an unbiased sample, , over this equivalent width range (Churchill et al. 1999a ). Between – Å the data are systematically below the fit, but are consistent with the maximum likelihood result to in all bins. Above Å, there is a slight overabundance of systems (not included in the maximum likelihood analysis), due to a selection bias toward larger equivalent width absorbers in the HIRES/Keck survey (Churchill (1997)). These are all damped Ly absorbers. Overall, the sample studied here is consistent with an unbiased sample in its equivalent width distribution for Å and for .
3. Data Analysis
The HIRES data were processed in the standard manner using the IRAF111IRAF is distributed by the National Optical Astronomy Observatories, which are operated by AURA, Inc., under contract to the NSF. Apextract package for echelle data. The details of the HIRES data reduction are given in Churchill (1995, 1997). The KP FOS spectra were reduced by the KP collaboration, as described in Schneider et al. (1993), Bahcall et al. (1996), and Jannuzi et al. (1998). The archival FOS spectra were reduced and calibrated using KP methods.
As a consistency check, we performed two separate, full analyses of the FOS data. The primary analysis invoked a priori knowledge of the Mgii redshifts for searching, identifying, and measuring the absorption lines (described in greater detail below). This analysis also used a priori knowledge of other metal–line systems along the line of sight (from an exhaustive search of the literature), in order to assess the possibility of misidentifications and blends from these other systems. We developed our own set of automated and graphically interactive software routines for objective feature finding, identifying blending due to other systems, and measuring equivalent widths (including Gaussian deblending). Many of our algorithms are based upon those described by Schneider et al. (1993) and Bahcall et al. (1996). The secondary analysis, which we call the “KP analysis”, was performed as a consistency check. This was an unbiased search for metal–line systems using the KP methodologies (Bahcall et al. (1993); Bahcall et al. (1996); Jannuzi et al. (1998)) and software, i.e. the ZSEARCH and JASON programs. The two full analyses were compared for each FOS absorption line measurement. Though the “KP analysis” yielded different results in detail from those of the primary analysis (i.e. small differences in equivalent widths and their errors), there were very few inconsistencies. In the few cases of differing results, both analyses were studied and a consensus was reached.
3.1. Continuum Fitting
Since the continuum fitting is the most subjective aspect of the data reduction and probably has the most significant impact on the analysis, we briefly elaborate. For the HIRES data, continuum fitting is fairly straight forward because the continuum is well sampled and the signal–to–noise ratio is quite high. We used the technique of Sembach & Savage (1992), which employs Legendre polynomials across a limited regions of spectrum around each of the transitions. The HIRES spectra were not flux calibrated, so the normalized flux is simply relative to the flux levels resulting from the HIRES sensitivity function. Following flux calibration, the FOS spectra were continuum fit as described in Schneider et al. (1993); this entails several iterations of interactive cubic spline fitting to the flux calibrated spectra.
3.1.1 Line Finding
For both the HIRES and the FOS spectra, absorption features were detected using a method slightly modified from that of Schneider et al. (1993), which is optimal in the case of unresolved lines. One constructs a discrete model of the instrumental spread function (ISF) consisting of elements, where is a non–negative integer and . The term is the value at pixel of a symmetric ISF having a peak value at . For both HIRES and FOS, the ISF is modeled as a Gaussian with and , respectively. We use , which gives a model ISF over 13 pixels.
The equivalent width of an unresolved feature centered in pixel is calculated by centering the ISF on the pixel and then computing
| (1) |
where , is the flux in pixel , is its fitted continuum level, is the wavelength interval spanned by the pixel, and are the minimum and the maximum points in the ISF, and the index222The index , as written here, provides a minor correction to a previously published version of this formula in Schneider et al. (1993). , and where for an absorption feature. At the spectra ends the continuum is extrapolated over pixels (similar to a wrap around convolution). The uncertainty in , is given by
| (2) |
where , and where is the uncertainty in resulting from data reduction and calibration sources and Poisson noise in the quasar flux and sky. This uncertainty “spectrum” serves as the observed equivalent width detection threshold.
In general terms, an unresolved absorption line at pixel is defined when the pixel equivalent width, , is less than , where is an arbitrarily defined number giving the number of beyond the equivalent width detection threshold. For resolved features, the detection is defined over a spectral region. The region extremes are defined at the pixels where the , which are smooth over the scale length of the ISF, become greater then zero.
For the HIRES spectra, we enforce a detection threshold. In Figure 3, we show the cumulative distribution of the rest–frame equivalent width detection threshold of Mgii . Our sample is 100% complete to a threshold of Å, 93% complete to Å, and 73% complete to Å. For the FOS spectra, we require only a detection threshold (whereas the “KP analysis” enforced a threshold). We applied a less stringent threshold because we used a priori knowledge of the expected location of the absorption lines, whereas the “KP analysis” was an unbiased search for absorption lines, and was therefore more conservative.
3.1.2 Equivalent Widths
For the HIRES spectra, the equivalent widths, , are measured directly by summing the quantity across the profiles. The measurement uncertainties are obtained from quadrature summing the quantity . The equivalent width uncertainties do not account for subjectivity in the continuum placement.
For the FOS spectra, the equivalent widths and their uncertainties were measured by fitting Gaussians to the absorption features. The quoted equivalent widths and uncertainties were taken from our own measurements (i.e. not from the “KP analysis”). We have used an interactive minimization scheme, where the minimization is performed by the NETLIB–slatec routine333NETLIB is a collection of mathematical software, papers, and databases maintained by AT&T Bell Laboratories, the University of Tennessee, and Oak Ridge National Laboratory (www.netlib.org). dnls1 (More (1978)). The uncertainties in the fitted parameters, the Gaussian amplitudes, widths, and centers, are computed using a modified version of the routine dfridr (Press et al. (1992)). The equivalent width uncertainties are based upon standard error propagation, including correlated terms. For a given line, the minimum allowed Gaussian width is set by the instrumental resolution.
Due to the number density of absorption features and the limited resolution of the FOS spectra, Gaussian deblending was sometimes required. Deblending was used only in cases where the individual line centroids were clearly separated or where a weak blend in the wing of a stronger line showed clear “double” structure. Otherwise, a blend was quoted. Examples of the deblending cases are illustrated in Figure 4, which shows the Siiv doublet at in PG ; lies between two Ly lines and resides in the wing of Galactic Mgii .
3.1.3 Wavelength Zero Point Shifting of FOS Spectra
The velocity zero points of the KP FOS spectra were defined by setting the mean of the singly ionized transitions from Galactic clouds to redshift zero (see Savage et al. (1993)). The archival FOS spectra, on the other hand, were not zero point shifted immediately following their reduction. In both the KP and archival spectra, analysis of the different absorption lines associated with the Mgii systems often revealed a systematic velocity shift with respect to the HIRES spectra, which yielded very precise (), heliocentric, vacuum wavelength, absorption redshifts from Mgii.
We adjusted the zero points of the FOS spectra using a constant velocity shift, which was often determined from the mean velocity offsets of two or more Mgii systems along the line of sight. Since Siii and Cii have ionization states similar to Mgii, they were used to derive the shift. If neither Siii nor Cii was available, then we used Ly and/or Civ. The largest shift we applied was no larger than % of a FOS spectral resolution element.
3.1.4 Line Identification Policy in FOS Spectra
Our philosophy for the detection and identification of lines in the crowded FOS spectra is as follows [also see § 4 of Bahcall et al. (1996)]. We generated an objective list of lines using a detection criterion (see § 3.1.1). This relatively “liberal” threshold was chosen because we are not producing a formal catalog of all absorbers, but have precise redshifts from Mgii in the HIRES spectra. In addition, the continuum fits to the FOS spectra were conservative in that they are probably systematically low in regions of dense line blending.
We examined, case by case, those lines that happen to be coincident with the predicted positions of the transitions from Si, Oi, Ni, Feii, Siii, Alii, Sii, Cii, Aliii, Nii, Feiii, Siiii, Siii, Siiv, Siv, Niii, Ciii, Civ, Svi, Nv, Ovi, and the Lyman series. For several of the above species, multiple transitions were covered, allowing either examination of a “clean” region of spectrum, or data that corroborated or ruled out identifications in “confused” regions. Some of these transitions were rarely detected at the level. We did not search regions of the spectra having an observed equivalent width detection threshold greater than Å.
A fair fraction of the time, line blending with transitions from other absorbing systems (some from our sample) was problematic. We attempted to identify all lines involved with blends as follows: We constructed a list of 100 transitions with accurate rest–frame wavelengths (Morton (1991)) and a list of all known absorption redshifts, including Ly “systems” for which Ly could be confirmed, from an exhaustive literature search (optical and ultraviolet observations) for known systems. In most all cases, a viable candidate for a blend could be determined.
For a given system, a species/transition is identified under the following conditions: 1) there is at least one 3 detection that can be identified with a transition of the species; 2) all other covered transitions of the species are not inconsistent with the identification444Additional transitions can be consistent if they: a) are not covered, b) have equivalent widths between the scaled value and the equivalent width of the strongest transitions, c) are in a blend for which the contribution of the transition of interest could be consistent.; 3) at least one transition is not blended with a possible transition from another system, or, if it is, can be unambiguously deblended using Gaussian fitting (meaning that it is on the wing of a line or has its own clear line center, see § 3.1.2). In the cases of doublets, if the weaker member of a doublet is not inconsistent with the first, then we quote it as a detection. This can occur when the second member is in a blend or is not covered by the spectrum. It is always possible that a doublet is a chance match with two “random” lines, but this type of false match is expected to have small probability in our spectra, based upon the simulations by Bahcall et al. (1996) and by Jannuzi et al. (1998).
If a species was detected in fewer than 10% of the systems, it was eliminated from our overall presentation. Each species has what we call a “flag transition”. The flag transitions are those with the strongest for each chemical/ionization species. For the non–doublet transitions, they are Feii , Mgi , Alii , Cii , Siii , and Siiii . If the flag transition for the species is not identifiable using the above criteria, but a weaker transition is, the equivalent width of the weaker transition is quoted (in Table Low and High Ionization Absorption Properties of Mgii Absorption–Selected Galaxies at Intermediate Redshifts. I. General Properties11affiliation: Based in part on observations obtained at the W. M. Keck Observatory, which is operated as a scientific partnership among Caltech, the University of California, and NASA. The Observatory was made possible by the generous financial support of the W. M. Keck Foundation. 22affiliation: Based in part on observations obtained with the NASA/ESA Hubble Space Telescope, which is operated by the STScI for the Association of Universities for Research in Astronomy, Inc., under NASA contract NAS5–26555.). We list these for completeness, but do not include them in our analysis.
In spectral regions with no detected absorption lines, the equivalent width limits were computed from Equation 2, assuming unresolved features. For any given undetected species, the transition with the most stringent limit was adopted. If there was a blend at the expected position of the transition, then an “upper limit” was obtained by quoting the equivalent width of the blended absorption line(s). Due to flat fielding uncertainties, the minimum limit quoted (observer frame) is Å (see Bahcall et al. 1996).
3.1.5 Measuring Lyman Limit Breaks
Measurements of the Lyman limit breaks were made using KP techniques, as discussed in Schneider et al. (1993) and Jannuzi et al. (1998). In the cases of multiple or double breaks, we modeled the data employing the same technique applied by Churchill & Charlton (1999; see their Figure 3). The redshifts of the Lyman limit break models were fixed at the redshifts of the Mgii absorbers. We varied the Hi column densities and superimposed synthetic spectra on the data. The quoted optical depths were obtained from the best matching model spectrum. Because the signal–to–noise ratio was often low, we did not use any fitting statistics, but simply attempted to make the depth of the break consistent with the model. In the cases of possible double or multiple breaks (due to redshift proximity), this modeling technique was successful at either singling out which Mgii system actually gives rise to the break, or placing constraints on the relative strengths of the double break. When a Lyman break is present, we quote a rough estimate of its optical depth in § 4.1, where each absorber is discussed individually. We also place a “” in column six of Table Low and High Ionization Absorption Properties of Mgii Absorption–Selected Galaxies at Intermediate Redshifts. I. General Properties11affiliation: Based in part on observations obtained at the W. M. Keck Observatory, which is operated as a scientific partnership among Caltech, the University of California, and NASA. The Observatory was made possible by the generous financial support of the W. M. Keck Foundation. 22affiliation: Based in part on observations obtained with the NASA/ESA Hubble Space Telescope, which is operated by the STScI for the Association of Universities for Research in Astronomy, Inc., under NASA contract NAS5–26555. (described in § 4). If a break was not present, we tabulated a “” and assign an upper limit on of cm-2. When the location of the break was not covered in the spectra, we placed a “”.
4. Presentation of System Properties
Line identifications of absorption features in FOS spectra is often plagued by line blending and other sources of confusion. Thus, we believe that a fairly complete description of the issues encountered with each system is warranted, especially in view of the possibility that any single system may be the subject of future detailed study as higher quality data become available.
The results from the HIRES/Keck spectra are presented in Table Low and High Ionization Absorption Properties of Mgii Absorption–Selected Galaxies at Intermediate Redshifts. I. General Properties11affiliation: Based in part on observations obtained at the W. M. Keck Observatory, which is operated as a scientific partnership among Caltech, the University of California, and NASA. The Observatory was made possible by the generous financial support of the W. M. Keck Foundation. 22affiliation: Based in part on observations obtained with the NASA/ESA Hubble Space Telescope, which is operated by the STScI for the Association of Universities for Research in Astronomy, Inc., under NASA contract NAS5–26555.. Tabulated are the quasar name, the absorber redshift, the Mgii rest–frame equivalent width, , the Feii rest–frame equivalent width, , and the Mgii rest–frame equivalent width, . Equivalent width limits are quoted at the level. In a few systems, we have detected Mnii, Caii, or Tiii; their detection is mostly an arbitrary function of wavelength coverage. We have not listed them in Table Low and High Ionization Absorption Properties of Mgii Absorption–Selected Galaxies at Intermediate Redshifts. I. General Properties11affiliation: Based in part on observations obtained at the W. M. Keck Observatory, which is operated as a scientific partnership among Caltech, the University of California, and NASA. The Observatory was made possible by the generous financial support of the W. M. Keck Foundation. 22affiliation: Based in part on observations obtained with the NASA/ESA Hubble Space Telescope, which is operated by the STScI for the Association of Universities for Research in Astronomy, Inc., under NASA contract NAS5–26555. (however, we show these data in Figure 5).
In Table Low and High Ionization Absorption Properties of Mgii Absorption–Selected Galaxies at Intermediate Redshifts. I. General Properties11affiliation: Based in part on observations obtained at the W. M. Keck Observatory, which is operated as a scientific partnership among Caltech, the University of California, and NASA. The Observatory was made possible by the generous financial support of the W. M. Keck Foundation. 22affiliation: Based in part on observations obtained with the NASA/ESA Hubble Space Telescope, which is operated by the STScI for the Association of Universities for Research in Astronomy, Inc., under NASA contract NAS5–26555., we present the results from the FOS/HST spectra. Tabulated are the quasar name, the absorber redshift, the Ly, Ly, and Ly equivalent widths, status of the Lyman break, and the equivalent widths of Alii, Aliii, Siii, Siiii, Siiv, Cii, Ciii, Civ, Nv, and Ovi. All equivalent widths are rest frame. The spectroscopic data are presented in Figures 5–. For each system, three sets of panels are shown: the HIRES detections, the FOS detections, and the FOS limits. The spectra are all normalized by the continuum fits. Both pre–COSTAR and COSTAR spectra are represented. We note the pre–COSTAR spectra in the discussion of individual systems (§ 4.1).
The panels with HIRES profiles show a velocity window of to km s-1 centered on the Mgii optical depth mean. Ticks above the continuum give the velocity positions of the Voigt profiles components (the Voigt profile decomposition is described in Paper II). The panels with singlet FOS absorption lines show a velocity window of to km s-1 centered on the line. The panels with doublet FOS absorption lines also show a velocity window of to km s-1, but the zero point is arbitrarily set half way between the doublet members in order to center the doublet in the panel. Ticks above the FOS spectra show the expected positions of the absorption based upon the Mgii Voigt profile components.
For each system we show the flag transition or both members of a doublet for the species presented in Tables Low and High Ionization Absorption Properties of Mgii Absorption–Selected Galaxies at Intermediate Redshifts. I. General Properties11affiliation: Based in part on observations obtained at the W. M. Keck Observatory, which is operated as a scientific partnership among Caltech, the University of California, and NASA. The Observatory was made possible by the generous financial support of the W. M. Keck Foundation. 22affiliation: Based in part on observations obtained with the NASA/ESA Hubble Space Telescope, which is operated by the STScI for the Association of Universities for Research in Astronomy, Inc., under NASA contract NAS5–26555. and Low and High Ionization Absorption Properties of Mgii Absorption–Selected Galaxies at Intermediate Redshifts. I. General Properties11affiliation: Based in part on observations obtained at the W. M. Keck Observatory, which is operated as a scientific partnership among Caltech, the University of California, and NASA. The Observatory was made possible by the generous financial support of the W. M. Keck Foundation. 22affiliation: Based in part on observations obtained with the NASA/ESA Hubble Space Telescope, which is operated by the STScI for the Association of Universities for Research in Astronomy, Inc., under NASA contract NAS5–26555.. If a weaker transition was used for a measurement, then it is labeled in Figures 5– and a footnote is placed in Table Low and High Ionization Absorption Properties of Mgii Absorption–Selected Galaxies at Intermediate Redshifts. I. General Properties11affiliation: Based in part on observations obtained at the W. M. Keck Observatory, which is operated as a scientific partnership among Caltech, the University of California, and NASA. The Observatory was made possible by the generous financial support of the W. M. Keck Foundation. 22affiliation: Based in part on observations obtained with the NASA/ESA Hubble Space Telescope, which is operated by the STScI for the Association of Universities for Research in Astronomy, Inc., under NASA contract NAS5–26555. or Table Low and High Ionization Absorption Properties of Mgii Absorption–Selected Galaxies at Intermediate Redshifts. I. General Properties11affiliation: Based in part on observations obtained at the W. M. Keck Observatory, which is operated as a scientific partnership among Caltech, the University of California, and NASA. The Observatory was made possible by the generous financial support of the W. M. Keck Foundation. 22affiliation: Based in part on observations obtained with the NASA/ESA Hubble Space Telescope, which is operated by the STScI for the Association of Universities for Research in Astronomy, Inc., under NASA contract NAS5–26555.. For the HIRES spectra, we show the strongest Tiii, Caii, and/or Mnii, even though these species are not listed in Table Low and High Ionization Absorption Properties of Mgii Absorption–Selected Galaxies at Intermediate Redshifts. I. General Properties11affiliation: Based in part on observations obtained at the W. M. Keck Observatory, which is operated as a scientific partnership among Caltech, the University of California, and NASA. The Observatory was made possible by the generous financial support of the W. M. Keck Foundation. 22affiliation: Based in part on observations obtained with the NASA/ESA Hubble Space Telescope, which is operated by the STScI for the Association of Universities for Research in Astronomy, Inc., under NASA contract NAS5–26555..
4.1. Discussion of the Individual Systems
4.1.1 Q , UM 18 ()
The FOS spectra of this quasar, which has four intervening Mgii absorbers, were previously studied by Jannuzi et al. (1998) and Koratkar et al. (1998). Jannuzi et al. obtained only the G270H grating spectrum, with pre–COSTAR optics, and using the slit. Koratkar et al. obtained both the G190H and G270H grating spectra in spectropolarimetry mode (″ aperture). We have included only the Jannuzi et al. spectrum in our study, except for a constraint on the Lyman limit break obtained from the Koratkar et al. G190H spectrum.
-
— This system has no detectable Feii or Mgi in the HIRES spectrum. In the FOS spectrum, Siii is blended with a Ly line at and we thus conservatively fit the entire blend and quote an upper limit for . Civ is blended with Siii at and with Ly at . The quoted upper limit for is taken to be the equivalent width limit at the expected position of . Alii is blended with Ly at so we measure that line and record it as the limit on . The Lyman limit was not covered.
-
— This system is rich in Feii and Mgi in the HIRES spectrum. In the FOS spectrum, the quoted may be very slightly overestimated due to the coincidence of Siiii at . We caution that the Siii transition is weak relative to our claimed detection, but is consistent within the permitted scaling. Jannuzi et al. (1998) identified a Ly line at at the location of Civ , but our new knowledge of the presence of a Mgii system implies our preferred Civ identification. The unphysical doublet ratio of Civ is due to a blend of with Ly at , which is part of a clear Lyman series. Both members of the Siiv doublet are blended, the former with Ly at and the latter with Galactic Feii . A limit on was recorded based on measuring the blend at the expected position of Siiv . Nv is blended with Ly at . There is a strong Lyman limit break with .
-
— This system has no detectable Feii or Mgi in the HIRES spectrum. In the FOS spectrum, the blue wing of the Ly line is blended with Ly at ; we deblended the lines with a Gaussian fit to obtain the quoted . Jannuzi et al. (1998) favored the identification of a Ly line at at the location of Alii . Furthermore, the profile is extremely broad (greater than 500 km s-1 in the rest–frame), suggesting a blend; we thus quote an upper limit on . Siiii is coincident with the strong Ly line at . Siiv is blended with Galactic Feii so an upper limit on was measured at the position of . Civ is blended with Ly at ; we used the limit on to compute the upper limit on . From a model of the Lyman limit, we determined that this system does not contribute to the observed break from the system.
-
— This system has no detectable Feii or Mgi in the HIRES spectrum. In the FOS spectrum, we claim a detection of Siiii , but note that it could be blended with Ly at (if Ly is hidden in a complex blend at Å). Siii is blended with Ly at , and other members of that series are cleanly detected. The other Siii transitions are blended with other possible lines so cannot be used to corroborate or refute a Siii identification. We quote a limit on Siii from measurement of the blended line at the position of . Siiv is blended in the red wing of Ly at , but a clean upper limit can be derived from the position of Siiv . The region where the Lyman limit is expected exhibits a complex shape, however, there is no apparent break.
4.1.2 Q , PHL 938 ()
Only a fairly low signal–to–noise ratio, G190H FOS spectrum was obtained by Rao & Turnshek (1999) using the ″ aperture. The signal–to–noise ratio is significantly reduced blueward of the Lyman limit break at Å.
-
— This system is a damped Ly absorber and is seen to have Feii, Mgi , Mnii, and Tiii absorption in the HIRES spectrum. In the FOS spectrum, the Siiv transition is clearly detected, though the could have a contribution from Ly from the strong Lyman series at . The Lyman limit was not covered.
-
— This system has Mgi, but no Feii, in the HIRES spectrum. In the FOS spectrum, the Lyman series lines are somewhat ambiguous [the data are quite noisy such that is greater than ]. The Ovi transition is in the red wing of a strong line, possibly Ly at ; we determine an upper limit on at the position of . The Lyman limit was not covered.
4.1.3 PG ()
A G270H FOS spectrum of this quasar was previously studied by Jannuzi et al. (1998) using the ″ aperture. Koratkar et al. (1998) obtained spectra in the spectropolarimetry mode using both the G190H and G270H gratings (″ aperture). We have limited our study to the G270H spectrum from Jannuzi et al. , with the exception of analysis of Lyman limit breaks and of the damped Ly line in the G190H spectrum. There are five intervening Mgii absorption systems.
-
— This system is a damped Ly absorber (Rao & Turnshek (1995)). In the HIRES spectrum, Mgi, Caii and several Tiii transition were detected (Caii was not covered). Feii, expected to be very strong, was not covered in the HIRES spectrum. In the FOS spectrum, Feii was detected. We quoted using , since all other Siii transitions were available only in the spectropolarimetry G190H spectrum. Alii is strong and could be affected by a blend with a Ly line; however we note that is consistent with a black–bottom Alii profile with the same kinematic spread as Mgii. We point out that the strong damped Ly line was measured in a G190H spectrum obtained in spectropolarimetry mode. The Lyman limit was not covered.
-
— This system has Feii and Mgi in the HIRES spectrum. We quoted using , since all other Siii transitions were available only in the spectropolarimetry G190H spectrum. We identify Cii in this system. The line was previously identified as Ly at by Jannuzi et al. (1998), however, the ratio would be large for the small in that system and there are no other transitions to corroborate it. Ly and the Lyman limit were only covered on the spectropolarimetry G190H spectrum, and could not be measured.
-
— This system has Feii and very weak Mgi detected in the HIRES spectrum. In the FOS spectrum, we have quoted a detection for Siiii , though we note Jannuzi et al. (1998) identify this absorption feature as Ly at . We quote a Cii detection; though Jannuzi et al. have identified this feature as Feii at , their identification is not consistent with the absence of the Feii transition in the more sensitive HIRES spectrum. The quoted upper limit for is obtained from because is blended with Galactic Mgi. is conservatively quoted as an upper limit because both the and are detected just below the level. There is a partial Lyman limit break with measured in the G190H spectropolarimetry spectrum.
-
— This system has Feii, Mgi and Aliii in the HIRES spectrum. The Civ doublet is taken from the ground–based spectrum of SS92, which has resolution . In the FOS spectrum, Ly is coincident with Siiii from the Mgii system; the quoted may be larger than the true Ly absorption strength. Gaussian deblending was used to measure because the blue wing of the Ly line is blended with Galactic Feii , but a clear asymmetry is apparent. could have a contribution from a blend with Alii at , but this contribution should be small. The Siiv is not formally detected, but this is not inconsistent with due to an uncertain continuum fit near the spectrum edge; we claim a detection for Siiv. Siiii is blended with Galactic Mgii in its blue wing and possibly with an unidentified line in its red wing; the equivalent width of the full blend was taken as a limit on Siiii. The upper limit for is obtained from the expected position of because is blended with Siiii at . Both Ovi and are blended with other lines, the former with Ly at , and the latter with Ovi , also from . Absorption from Ovi might be present in this system, but it cannot be determined, so we quote an upper limit obtained by fitting the weaker blended feature at the position of . The Lyman limit break shows structure suggestive of a “double break”. A model of the Lyman break revealed that both this system and the system contribute roughly equally, ach having .
-
— This system has Feii and Aliii in the HIRES spectrum. The Civ doublet is taken from the ground–based spectrum of SS92, which has resolution at the position of the doublet. In the FOS spectrum, Nv is blended with Ly at . We quote a detection of Nv based upon , which is blueward of Ly at . A significant feature was present at the location of Siiv redward of the Ly forest, but was not covered. We tentatively claim a detection for the Siiv doublet (consistent with our policy on line identifications). Siiii is coincident with the strong Ly line associated with the Mgii absorber; we quote the equivalent width of this line as an upper limit on . There is a Lyman limit break with measured in the G190H spectropolarimetry spectrum. The Lyman limit break shows structure suggestive of a “double break”. Modeling showed that both this system and the system contribute roughly equally to the break with each having .
4.1.4 PKS ()
G130H, G190H, and G270H FOS spectra of this quasar were obtained by M. Burbidge (see Cohen et al. (1991). Of the pre–COSTAR spectra included in our study, these are the only ones obtained with a “large” aperture (″). As such, the quoted equivalent widths may be systematically small; we did not apply any correction factors.
-
— This is a near–DLA system (also see Rao et al. 1995); the measured Å places it on the logarithmic part of the curve of growth with cm-2. Due to a blend with Siiii at in the red wing of the Ly line, could be slightly overestimated. Detected in the HIRES spectrum are several Feii transitions, Mgi , and Caii ( was not covered). In the FOS spectrum, the Civ doublet is present on both the G190H and G270H gratings; the equivalent widths of the transition measured from the two spectra are consistent ( Å and Å, respectively.) The red wing of Ciii is blended with Ly at and an unidentified line, thus a limit is quoted based on a fit to the blend. Ovi is blended with Ly at and is coincident with both the member of Ovi at and a dominating unidentified line. We conservatively quote an upper limit on based on the equivalent width of the blend at the expected position of Ovi . Accurate measurement of the optical depth from the Lyman limit is compromised by geocoronal emission; given that this system is a near–DLA, the flux below Å should be zero. Modeling showed that the break itself arises from the system (see below).
-
— In the HIRES spectrum, this system has detected Feii, Mgi, and Caii (Caii was not covered). In the FOS spectrum, Civ was covered by both the G190H and G270H gratings, but the profile shapes and equivalent widths are not consistent (the G190H appears compromised, but the G270H transition is large relative to ); we have quoted the average of the equivalent widths from the two gratings and present the G270H spectrum in Figure 5. Any Siiii that is present in the spectrum is blended in the red wing of the Ly line at ; we have quoted for the upper limit on . The upper limit on was obtained from , since is blended with Siiv at . Ovi is blended with Ovi at and a dominating unidentified line. However, a clean upper limit on was obtained from . Modeling showed that the Lyman limit break arises from this system, however accurate measurement of the optical depth is compromised by geocoronal emission.
4.1.5 PKS ()
G190H and G270H FOS spectra of this quasar (obtained by Bergeron with the ″ square aperture) were studied by Boissé et al. (1998), and a separate G270H spectrum (″ round aperture) was obtained by Bowen. We independently reduced these data, and we present results below from the Bergeron G190H and from a combined G270H spectrum from the Bowen and Bergeron observations. Some slight differences between our analysis results and those of Boissé et al. are discussed on a system by system basis below.
-
— This system has Feii in the HIRES spectrum. In the FOS spectrum, Ly is blended with Ly at and a Ly line at , but it is distinct such that accurate deblending is possible. We claim a tentative detection of Siiv, which appears to be present in both the G190H and G270H spectra. We note however, that the blue wing of is blended with Ly at and that there may be a small contribution to from Nv at , though the latter is not formally detected. Though Churchill & Le Brun (1998) claimed a tentative upper limit on Civ, our reduction and continuum fit of the G190H spectrum yielded a detection above the level; we thus claim a detection for Civ. Siiii is blended with Ly at ; we fit this feature to obtain an upper limit. The Lyman limit was not covered and Ly is below the Lyman break from the system where the flux is zero.
-
— This is a well studied damped Ly system (e.g. Steidel et al. 1995; Lu et al. 1996b; Boissè et al. 1998). In the HIRES spectrum, a suite of five Feii transitions are detected, as are the Mnii triplet, Mgi and Tiii and . In the FOS spectrum, numerous transitions are detected, and the optical depth of the Lyman limit is .
-
— This system has Feii in the HIRES spectrum. Our measurement of the very weak Ly line was consistent with that reported by Churchill & Le Brun (1998). Ly is blended with the Lyman series at and Ly is blended with Ly at . Siiii is in the blue wing of a Ly line at so a non–restrictive limit was obtained by fitting this blend. Though it appears that a clean Civ doublet is present, is actually Feii from the DLA and is Mgii from a dwarf galaxy at . A non–restrictive limit on is obtained by fitting the feature coincident with the expected position of . Ovi is blended with the blue wing of Ly at and is blended with Ly, also at ; we used to obtain an upper limit on . There is no Lyman limit break.
-
— In the HIRES spectrum, Feii, Mgi and the Aliii are present. The Civ doublet is taken from the ground–based spectrum of SBS, which has resolution at the observed wavelength of Civ. In the FOS spectrum, the quoted is taken from because is blended with Mgii from the dwarf galaxy at . Boissè et al. (1998) reported detection of Nv , but the feature located where is expected may be a Ly line at , since would be in the extreme blue wing of the possible Ly line at . We quote an upper limit on from measuring the blend at the position of . Though Ovi may be present, is blended with Ly at and Ovi is in a complex region in the wing of the damped Ly line at . The optical depth of the Lyman limit is .
4.1.6 PKS ()
This quasar, a luminous BL Lacertae object, has only a lower limit on its emission redshift. Only a G270H FOS spectrum was obtained by Rao & Turnshek (1999) using the ″ aperture.
-
— This system has no detectable Feii or Mgi in the HIRES spectrum. Ly was not covered in the FOS spectrum. The upper limit on is obtained from the transition because the other Siii transitions are not covered. Cii , if present, is blended with strong Siii at , so this blend is fit to obtain an upper limit on . For the upper limit on , we use because is blended with Galactic Feii and . The Lyman limit was not covered.
-
— This system was reported to be a “double” system by Veron–Cetty et al. (1990). Several Feii transitions and Mgi are present in the HIRES spectrum. The FOS spectrum is very rich in many, cleanly identified, transitions. The member of the Nv doublet is blended with Galactic Feii , but is unambiguously detected. The Lyman break was not covered.
4.1.7 Q , MRK 132 ()
The G270H FOS spectrum, obtained with the ″ round aperture, was studied by Jannuzi et al. (1998). The FOS spectrum covers only the Ly forest down to a strong Lyman limit break at 2200 Å from a system that wipes out all flux below this wavelength.
-
— This system has no detectable Feii or Mgi in the HIRES spectrum. In the FOS spectrum, Ly is blended with from a possible Civ doublet at . There are no corroborating transitions for the Civ redshift in the HIRES spectrum, but there is a possible Feii line in the FOS spectrum. We quote a non–restrictive upper limit on . Siiii is blended with Ciii at , the redshift of the strong Lyman limit break. There is a strong absorption feature coincident with Siii (could be Feii at ), but its strength is not consistent with detection limits based to the Siii ; we have used to place an upper limit on . The Lyman limit break was not covered.
-
— This system has Feii in the HIRES spectrum. The Civ doublet is taken from the ground–based spectrum of SBS, which has resolution at this wavelength. In the FOS spectrum, only Ly is clearly detected above the threshold. A possible detection of Siiv is not clear; there could be coincident Ly lines blended with both members of the doublet. We conservatively quote an upper limit on . The Lyman limit break was not covered. Nv is possibly blended with Ovi at , so provides an upper limit on .
4.1.8 PG ()
Both the G190H and G270H FOS spectra of this quasar have been studied by Jannuzi et al. (1998). They were obtained with pre–COSTAR optics using the slit. The metal line properties of the Mgii systems were studied in detail by Churchill & Charlton (1999).
-
— This system was reported as a double system by Jannuzi et al. (1998) and by Churchill & Charlton (1999), with redshifts and . In the HIRES spectrum, Feii and Mgi are present. The FOS spectrum has the richest complement of transitions of all the systems in our sample. Cii is blended with a possible Ly line at . Cii is blended with Ovi and with Ovi at . The quoted is based upon using a Gaussian deblending, which likely yielded a slightly large value. The Civ profile required a double Gaussian fit and the from is blended with from . We approximately measured (estimated uncertainty of Å) as the sum of half of the equivalent width of this blend and the equivalent width of the unblended from the system. Ovi also required a double Gaussian fit, but could be determined more accurately due to the larger separation of Ovi . Ciii is clearly detected but is blended with Ly at and a smaller Ly line from the Mgii absorber; our upper limit is the equivalent width of the blend. Modeling of the Lyman limit showed that the break is entirely due to the system with [see Churchill & Charlton (1999)].
-
— This system has no detectable Feii or Mgi in the HIRES spectrum. was measured using because is blended with Ovi at . In the FOS spectrum, Ly is blended with with Ly at and Ciii at such that only a non–restrictive limit can be derived from a fit to the blend. Cii is blended with strong Ly at . This system makes no contribution to the Lyman limit break (see notes on the system).
4.1.9 PG ()
The pre–COSTAR G270H FOS spectrum of this quasar, obtained with the slit, has been studied by Jannuzi et al. (1998).
-
— In the HIRES spectrum, Feii, Mgi and Caii were detected ( was not covered). In the FOS spectrum, detected Siii was used to measure because no other Siii transitions are covered. The Lyman limit was not covered.
-
— This system has no detectable Feii or Mgi in the HIRES spectrum. In the FOS spectrum, Siii was used to measure because no other Siii transitions are covered. Civ was not detected at the level, however, it is consistent with the weak, but significant detection; we have quoted a detection for Civ. The Lyman limit was not covered.
-
— This system has no detectable Feii or Mgi in the HIRES spectrum. In the FOS spectrum, only Ly was unambiguously detected. Siiii is blended with Ovi at ; it is difficult to evaluate the relative contributions so we quote an upper limit on . The Siiv doublet is somewhat ambiguous; if real, it is offset redward from the predicted location. The transition may be Ly at and the transition is blended with Cii at , a system with other corroborating lines. The limit on was determined by fitting the blend at the expected position of . The location of Nv is blended with an unknown transition in the blue wing of Ovi at , but a clean limit on is determined at the position of . (Cii at is ruled out as the blend based upon the absence of stronger Cii ). The Lyman limit was not covered.
4.1.10 PG ()
Both the G190H and G270H FOS spectra (″ aperture) of this quasar have been studied by Jannuzi et al. (1998).
-
— This system has detected Feii and Mgi in the HIRES spectrum. The FOS spectrum is very rich with clearly detected transitions. As seen in Ly and Ly, there is a higher redshift system at with no detectable Mgii in the HIRES spectrum. There are no detected metal lines from that system that might contaminate those of the Mgii absorber. was obtained by Gaussian deblending of with Siiii at . We have tentatively claimed Nv as a detection, noting that is not formally detected, but is consistent with the expected value from . Nv was also detected by the systematic procedures of Jannuzi et al. (1998). is quoted as an upper limit, since its measured value is inconsistent with and . The Lyman limit is on the edge of the G190H spectrum where the signal–to–noise ratio is hopeless.
-
— This system has several Feii transitions but no Mgi in the HIRES spectrum. In the FOS spectrum, this system is part of a group of absorbers at redshifts , , and . This is one of the examples in the KP data set of extensive metal–line systems occurring in overdensities in the distribution of Ly absorbers (Bahcall et al. (1996); Jannuzi (1998)). The blend in the blue wing of Siiii is Siii at . was obtained by Gaussian deblending. We quote an upper limit on because is blended with Galactic Feii and is blended with Galactic Feii . There is no Lyman limit break in a very clean portion of the spectrum.
4.1.11 Q , TON 153 ()
Both the G190H and G270H FOS spectra of this quasar have been studied by Bahcall et al. (1996). These spectrum were obtained with pre–COSTAR optics using the slit. The G160L FOS spectrum, covering the Lyman limit, was presented by Bahcall et al. (1993).
-
— In the HIRES spectrum, Feii, Mgi are present. In the FOS spectrum, there is an unknown blend with Nv but a clean upper limit on is taken from the position of . Ovi is blended with Ly at ; we used to place an upper limit on . There is a strong Lyman limit break, with , associated with this system.
4.1.12 PG ()
The G190H grating spectrum (″ aperture) was obtained by K. Lanzetta. The G270H grating was obtained by Rao & Turnshek (1999), also with the aperture. This is a complex spectrum with at least 10 known metal–line absorption redshifts, several of which give rise to a Lyman series. In the G190H spectrum, there is a strong Lyman limit break at Å from a system that wipes out all flux below this wavelength. The two strongest Lyman series systems at and , give rise to a partial Lyman limit break. The former is associated with a Civ absorber (SBS) and has strong Ovi absorption in the FOS spectrum.
-
— This system had no detectable Feii nor Mgi in the HIRES spectrum. In the FOS spectrum, the upper limit on was obtained using the transition since it was the only Siii line redward of the strong Lyman limit break at . The Siiv is sitting on the shoulder of this break, and is thus fairly noisy, with blended with a possible Ly line at ; a non–restrictive upper limit is quoted from the noisy region at the expected position of . The Lyman limit was not covered.
-
— The HIRES spectrum is relatively noisy so that some weak kinematic outlying clouds could be missed. Near Mgii there is an unidentified line at km s-1 (which cannot be Mgii because the transition is absent). Feii was detected, but Mgi was not present. In the FOS spectrum, only Ly is detected. Alii is blended in the red wing of strong Ly at . Cii is blended with Ly, also at . The Siiv doublet is on the shoulder of the “double”, partial Lyman limit break systems; is blended with Ly at and is blended with the blue wing of a complex blend, including two Ly lines at and , and Ly at . We quote an upper limit for . The upper limit on is obtained using because is blended with Ovi at . The Lyman limit is wiped out by the break at Å.
-
— This system has no detectable Feii transitions nor Mgi in the HIRES spectrum. In the FOS spectrum, the Ly line is the central member of a triple blend with Ly at being the red–most member and an unidentified line (possibly Ly at ) to the blue. The quoted was obtained by Gaussian deblending, but because the profile is complicated the error is likely underestimated. was also obtained using Gaussian deblending, due to an unidentified line, possibly Ly at . The Cii transition is detected in a crowded region of the spectrum, but is unblended between Ly at and Ly at . Siiv is clearly detected, not being blended with any Lyman series lines, however, is blended with Ly at , which is corroborated by a Ly line. For Civ, is stronger at the level, suggesting a blend. The upper limit on is obtained from because is blended with Niii at . The Lyman limit is wiped out by the break at Å.
-
— This system has several Feii transitions, but Mgi was not covered in the HIRES spectrum. In the FOS spectrum, the Ly is blended with an unidentified line; we measured using Gaussian deblending, but note that the value is uncertain. Cii is blended with a strong Ly line at . Siiv is blended with Galactic Mgii . The Civ doublet, which brackets a possible Ly line at , is undetected. There is also a possible Ly line at slightly to the blue of Nv . The Lyman limit is wiped out by the break at Å.
4.1.13 PKS ()
The G160L, G190H, and G270H FOS spectra of this quasar have been studied by Jannuzi et al. (1998) and Bergeron et al. (1994). These spectra were obtained pre–COSTAR, using the slit.
-
— The HIRES spectrum is fairly noisy in the region of the Mgii doublet and Feii transitions, so it is possible that some kinematic outlying clouds were missed. Feii and Mgi were detected. In the FOS spectrum, the detections are all unambiguous.and the upper limits are not compromised by blends. We note that there is a Lyman limit break with in the G160L spectrum (Jannuzi et al. 1998).
-
— This system has no detected Feii transitions nor Mgi in the HIRES spectrum. Siiii is blended with Siii at , that latter being corroborated by the presence of a proper–strength Siii line. The line at the expected wavelength of Cii is Siiv at . Based upon the G160L spectrum, there is no evidence for a Lyman limit break at this redshift.
4.1.14 Q , 3C 336 ()
Both the G190H and G270H FOS spectra (″ aperture) of this quasar have been studied by Steidel et al. (1997). The background level for the G190H is not certain. The spectrum has slightly negative flux in the core of the damped Ly line at and below the Lyman limit break. Thus, the equivalent widths of lines measured in this grating may be systematically small. The HIRES spectrum is quite noisy, such that the detection threshold is low for accompanying transitions.
-
— In the HIRES spectrum, only the Mgii doublet is detected. In the FOS spectrum, the Civ is blended with Siiii at , but the appears to be clear. The upper limit on was obtained from on the G270H grating because the stronger transition was in a noisy region of the G190H spectrum. Cii is ambiguous, being in a very noisy part of the spectrum and possibly being blended with Ovi at ; we quote the upper limit on . The upper limit on is obtained using because is blended with a strong line, which could be Ly at with a contribution from Nv at . The Lyman limit break was not covered.
-
— This system is a damped Ly absorber (Steidel et al. (1997)). In the HIRES spectrum, Feii is strong and Tiii is detected. In the FOS spectrum, the upper limit on is obtained using because is blended with a strong line, which could be Ly at with a contribution from Siiv at . The Lyman limit break was not covered.
-
— This system was first seen in Civ absorption. Only the Mgii transition was detected because was wiped out by the pen mark on the HIRES CCD. Neither Feii nor Mgi was detected. Siiv is blended with Cii , but is cleanly measured. A robust measurement of was not possible due to the signal to noise of the spectrum. Also, Ly may suffer from blending so we have quoted an upper limit on . Though Siiii is in a busy part of the FOS spectrum, there are no other candidates for the line; the line immediately to the blue is Feii at . The Ovi was not formally detected in a noisy region of the spectrum. The region of the spectrum corresponding to the Lyman limit is very noisy due to the break at .
-
— In this system, Feii, Mgi , and Mnii and were detected in the HIRES spectrum. In the FOS spectrum, Siii is blended with Galactic Feii , so the transition of the doublet is used to measure . was measured using Gaussian deblending, where the blue wing is Siiv at . Nv is blended with Galactic Feii ; we obtained the limit on using . The Ovi doublet is ambiguous, being in a very noisy part of the spectrum and possibly being blended with Cii at ; we quote a limit on . There is a Lyman limit break with a large optical depth whose accurate measurement is difficult.
4.1.15 PG ()
The G270H FOS spectrum of this quasar were studied by (Bahcall et al. 1996). This spectrum was taken with the pre–COSTAR optics using a slit. A pre–COSTAR spectropolarimetry G190H spectrum was obtained with the wide, ″ by Impey et al. (1996). We did not include the G190H spectrum in our study except to investigate the Lyman limit breaks.
-
— This system has no detected Feii transitions nor Mgi in the HIRES spectrum. There were no detection in the FOS spectrum. The upper limit on is taken from Siii , which provided the best limit despite being blended with Siiv at . The apparent, but slightly offset, Alii is Siii at , as corroborated by Siii . The upper limit on is fairly clean, given the density of lines near the transition; is likely a blend, possibly with a Ly line at . There is no flux at the position of the Lyman limit due to the strong break from the system.
-
— This system has no detected Feii transitions nor Mgi in the HIRES spectrum. In the FOS spectrum, the upper limit on is obtained using because is coincident with Siiii at . Cii may be present, but the observed equivalent width is Å, which is below the suggested threshold of Å for a detection limit in order to avoid flat fielding residuals in the reduced spectrum (Bahcall et al. 1996). (The signal–to–noise ratio of this spectrum is higher than many of the available flat fields for the epoch of these observations of PG .) Siiv is coincident with Cii at ; we obtained using , which lies in the extended red wing of a possible Ly line at . The Nv line includes a contribution from Siii at . This implies that the candidate line is unrealistically strong relative to , and also the separation of the centroids of the two lines do not agree. We measure for the candidate line, but cautiously quote this value only as an upper limit. There is no flux at the position of the Lyman limit due to the strong break from the system.
-
— In the HIRES spectrum, this system has several detected Feii transitions and detected Mgi. In the FOS spectrum, there is a Ly line at in the red wing of Siiii ; was obtained using Gaussian deblending. Both members of the Siiv doublet are blended, but easily modeled with Gaussian fitting. The transition is the central member of a three line blend with Ly at and and the transition is in the blue wing of Galactic Mgii (see Figure 4). The feature just blueward of where Nv is expected is Siiii at ; a limit was determined at the expected position of . There is a strong Lyman limit break with that wipes out all flux blueward of Å.
-
— This system has no detected Feii transitions nor Mgi in the HIRES spectrum. In the FOS spectrum, the detections are without ambiguity, expect perhaps Cii , which could be an artifact of flat fielding problems. The relatively strong feature between Siiv and is Galactic Mgi. Nv is blended with Ly at , but a limit was measured at the position of . There is a Lyman limit break with .
4.1.16 PKS , PHL 1598 ()
Both the G190H and G270H FOS spectra of this quasar have been studied by Jannuzi et al. (1998). The optics were pre–COSTAR and a slit was used.
-
— This system is a near–DLA, with Å. In the HIRES spectrum, Feii was not covered, whereas Mgi and both members of the Caii were detected. In the FOS spectrum, there is no confusion with Ly absorbers due to the low redshift of the quasar. We quote a detection for the Siiv doublet, since is detected and is consistent with its expected strength (recall that there is no Ly forest confusion, nor are there any other metal–line systems). We obtained an upper limit (albeit not very constraining) on using . The Lyman limit was not covered.
4.1.17 PKS ()
Both the G190H and G270H FOS spectra of this quasar have been studied by Bahcall et al. (1993) and by Bergeron et al. (1994). These were obtained with pre–COSTAR optics using the slit.
-
— In the HIRES spectrum, Feii was detected, but Mgi was not. From the FOS spectrum, we quote a detection for Siii based upon its correct strength relative to detected Siii , although we note Bahcall et al. (1996) identified the line as Ly at . The line to the red of Siiii is Ly at , which has a corroborating Ly line, thus this is not a doublet at another redshift, and a Siiii detection is claimed. Nv is detected, but we note that is probably blended with another absorption feature. Cii is not detected at , which means that the strong feature to the blue of Ovi is not Cii ; it is likely Ly at . The Lyman limit is located in an extremely noisy region of the G190H spectrum and no measurement is possible. See Bergeron et al. (1994) for an independent study of the FOS data for this system.
5. Overall Absorption Properties
For most systems, the measured absorption properties are not without some ambiguity in one transition or another. We do not anticipate that highly detailed system by system analyses can be made. That is not to say that, in some cases where robust measurements of extreme properties are measured, physical information cannot be extracted [e.g. the absorbers toward PG (Churchill & Charlton (1999))]. However, we are confident that our analysis of the data has yielded measurements that provide a sound representation of the absorption properties of the sample as a whole, given the consistency between our two independent methods for identifying absorption lines (see § 3). Here, we present the general overall properties of the systems and discuss a few of the more immediately obvious trends in the data. We reserve further analysis for Paper II.
In Figure 6, we present the rest–frame absorption strengths of the species listed in Tables Low and High Ionization Absorption Properties of Mgii Absorption–Selected Galaxies at Intermediate Redshifts. I. General Properties11affiliation: Based in part on observations obtained at the W. M. Keck Observatory, which is operated as a scientific partnership among Caltech, the University of California, and NASA. The Observatory was made possible by the generous financial support of the W. M. Keck Foundation. 22affiliation: Based in part on observations obtained with the NASA/ESA Hubble Space Telescope, which is operated by the STScI for the Association of Universities for Research in Astronomy, Inc., under NASA contract NAS5–26555. and Low and High Ionization Absorption Properties of Mgii Absorption–Selected Galaxies at Intermediate Redshifts. I. General Properties11affiliation: Based in part on observations obtained at the W. M. Keck Observatory, which is operated as a scientific partnership among Caltech, the University of California, and NASA. The Observatory was made possible by the generous financial support of the W. M. Keck Foundation. 22affiliation: Based in part on observations obtained with the NASA/ESA Hubble Space Telescope, which is operated by the STScI for the Association of Universities for Research in Astronomy, Inc., under NASA contract NAS5–26555. vs. that of Mgii. Only the “flag transitions” are plotted. If a transition other than the “flag transition” was used to measure an equivalent width or an upper limit on an equivalent width, the value was not plotted on any of the figures. However, this results in a negligible difference to the general appearance of Figure 6. For all data, the median errors are roughly the size of the data points and those points with downward pointing arrows represent upper limits. Though there are very few Caii data points (due to redshift coverage), we have presented Caii absorption strengths for comparison with the numerous studies focused on the Galaxy, and on local and low redshift galaxies (e.g. Morton & Blades (1986); Robertson et al. (1988); Bowen 1991a , 1999b; Vallerga et al. (1993); Sembach, Danks, & Savage (1993); Welty, Morton, & Hobbs (1996)).
Spearman–Kendall non–parametric rank correlation tests, including upper limits (Isobe, Feigelson, & Nelson (1986); LaValley, Isobe, & Feigelson (1992)), show that the absorption strengths of all transitions with ionization potentials less than that of Cii ( eV) are correlated with at a greater than 97% confidence level (with the exception of Caii). We take this as additional confirmation that our measurements, for the most part, provide an accurate representation of the overall sample, since it is expected that these absorption strengths should be correlated. Note, however, that since most of the low ionization transitions are saturated, their equivalent widths are a better measure of the overall kinematic spread of the gas than of column densities (e.g. Petitjean & Bergeron (1990), 1994). An interesting trend with ionization level is that, as is increased above Å, the low ionization strengths correspondingly increase whereas the higher ionization strengths have considerable scatter and a relatively low mean. Most of the latter data represent the damped Ly systems, as can be seen by their large values. Accurate measurements of Nv and Ovi were fairly rare, but from the few data points available, it would appear that is often less than Å, and that Ovi may have a range of absorption strengths similar to Civ.
Based upon photoionization models (Bergeron & Stasińska (1986); SS92), it has been widely accepted that Mgii absorbers are optically thick at the Lyman limit in neutral hydrogen, i.e. they have neutral hydrogen column densities of cm-2 in one or more of the kinematic components. In Figure 7, we present the rest–frame equivalent widths of Mgii and Civ vs. that of Ly. Three data point types are shown. Those systems with a measured Lyman limit break are solid circles, those with no break are open circles, and those for which the break was not covered are open squares. The majority of Mgii absorbers have Ly strengths in the rough range – Å, with a sparsely populated tail extending out to Å. It is not clear if there is a gap in the distribution of ; this would occur if damped Ly systems [by definition those with cm-2, which corresponds to Å] are more common than are “Hi rich” systems with in the intermediate range – Å.. Since these Hi–rich, but non–damped, systems have strong Mgii absorption (most above Å), their co–moving number density probably evolves in close step with the strongest Mgii absorbers (SS92).
The Ly transition is easily saturated and is thus not a good measure of the neutral hydrogen column density. The Lyman limit break can provide an estimate of and is the unambiguous signature of optically thick neutral hydrogen (Tytler (1982)). The location of Lyman limit break was covered for 17 of the 45 absorbers. All but two of the systems with Å have breaks; it is likely that nearly all metal–line systems in this equivalent width range would also have breaks (also see Jannuzi et al. (1998)).
Since the redshift number density of the weakest Mgii systems is several times greater than that of systems with Lyman limit breaks (Churchill et al. 1999a ), it is expected that most Mgii absorbers with Å will not have a break. We find two weak systems with breaks, six without, and nine undetermined. We note that the majority of the systems have Å, and none of these for which the location of the Lyman limit was covered has a break. This suggests, not surprisingly, that the weakest of the weak Mgii absorbers are the ones lacking breaks. Note that the presence of a Lyman break is independent of Civ strength in that the full range of observed exhibit breaks. Also, note that the Civ strengths are relatively small in the damped Ly systems, implying that their Civ kinematics are probably similar to a more “typical” strong Mgii absorber.
In Figure 8, we present the rest–frame equivalent widths of Siiv and Cii vs. that of Civ. As with Figure 6, we plot “flag transitions” only. In the plot of vs. , we illustrate the combined effects of a range of kinematics and ionization conditions. We also present vs. , which has been central for studying the ionization conditions in the ISM and Halo of the Galaxy (e.g. Savage, Sembach, & Lu (1997)). Future high resolution spectra of these particular transitions will be essential for a detailed understanding of the kinematics and ionization conditions of the ISM and halos of these intermediate redshift galaxies.
For future detailed studies using higher resolution data, silicon has the added virtue of sampling three ionization states. Thus, we also present the rest–frame equivalent widths of Siiii vs. Siii, and of Siiii and Siii vs. Siiv, in Figure 9. Again, we plot “flag transitions” only. Since both silicon and magnesium are –process elements, and Siii and Mgii have nearly identical ionization potentials and transitions with similar oscillator strengths, it is expected that Siii will tightly trace Mgii. The Siiii transition, however, is very strong and is expected to be saturated, even at high resolution.
6. Conclusion
We have measured the absorption properties of 45 intermediate redshift Mgii absorbers in FOS spectra from the HST archive and from the database of the HST QSO Absorption Line Key Project. The sample was selected from the 51 Mgii systems observed with HIRES/Keck for which FOS spectra of the same quasars existed. The Mgii profiles, and other transitions observed in the optical, have been resolved at km s-1 resolution. The UV FOS spectra have resolution km s-1. In this paper, we presented the data, the data analysis, and a brief description of the properties of each system. We present additional analysis of the data in a parallel companion paper (Paper II).
We have found evidence for a high ionization gaseous phase in intermediate redshift Mgii absorbing galaxies. Mostly, the high ionization species detected are Civ and Siiv, which are commonly seen in absorption in the Galaxy (e.g. Savage & Sembach (1996); Savage, Sembach, & Lu (1997)). These data lead us to suggest that these galaxies have multiphase interstellar media and halos similar to those observed locally (Dahlem (1998); also see Churchill et al. 1999b ).
What is the kinematic spread of the Civ and what is its line of sight velocity structure? How is this structure related to that seen in Mgii? High resolution spectroscopic observation are sorely needed for sorting out the physical nature of this high ionization material and its relation to the kinematically complex low ionization gas. Only if the high ionization profiles are resolved at resolutions comparable to the HIRES/Keck data, can the relative kinematics of the low and high ionization gas can be quantified.
References
- Bahcall & Spitzer (1969) Bahcall, J. L., and Spitzer, L. Jr. 1969, ApJ, 156, L63
- Bahcall et al. (1993) Bahcall, J. N., et al. . 1993, ApJS, 87, 1
- Bahcall et al. (1996) Bahcall, J. N., et al. . 1996, ApJ, 457, 19
- Bergeron et al. (1994) Bergeron, J., et al. 1994, ApJ, 436, 33
- Bergeron & Boissé (1991) Bergeron, J., & Boissé, P. 1991, A&A, 243, 344
- Bergeron & Stasińska (1986) Bergeron, J. and Stasińska, G. 1986, A&A, 169, 1
- Boissé et al. (1998) Boissé, P., Le Brun, V., Bergeron, J., Deharveng, J.–M. 1998, A&A, 333, 841
- (8) Bowen, D. V. 1991a, MNRAS, 145, 649
- (9) Bowen, D. V. 1991b, MNRAS, 251, 649
- Charlton & Churchill (1998) Charlton, J. C., & Churchill, C. W. 1998, ApJ, 499, 181
- Churchill (1995) Churchill, C. W. 1995, Lick Technical Report, 74
- Churchill (1997) Churchill, C. W. 1997, Ph.D. Thesis, University of California, Santa Cruz
- Churchill & Charlton (1999) Churchill, C. W., & Charlton, J. C. 1999, AJ, 118, 59
- Churchill & Le Brun (1998) Churchill, C. W. & Le Brun, V. 1998, ApJ, 499, 677
- (15) Churchill, C. W., Mellon, R. R., Charlton, J. C., Jannuzi, B. T., Kirhakos, S., Steidel, C. C., & Schneider, D. P. 1999b, ApJ, 519, L43
- Churchill et al. (2000) Churchill, C. W., Mellon, R. R., Charlton, J. C., Jannuzi, B. T., Kirhakos, S., Steidel, C. C., & Schneider, D. P. 2000, ApJ, submitted (Paper II)
- (17) Churchill, C. W., Rigby, J. R., Charlton, J. C., & Vogt, S. S. 1999a, ApJS, 120, 51
- Churchill et al. (1996) Churchill, C. W., Steidel, C. C., & Vogt, S. S. 1996, ApJ, 471, 164
- Cohen et al. (1991) Cohen, R. D., Bartko, F., Beaver, E. A., Burbidge, E. M., Junkharinen, V. T., Lyons, R. W., Rosenblatt, E. I., Burks, G. S.; Harma, R. J., & Henriksen, M. 1991, BAAS, 23, 1426
- Dahlem (1998) Dahlem, M. 1998, PASP, 109, 1298
- Guillemin & Bergeron (1997) Guillemin, P., & Bergeron, J. 1997, A&A, 328, 499
- Impey et al. (1996) Impey, C., Petry, C. E., Malkan, M. A., & Webb, W. 1996, ApJ, 463, 473
- Isobe, Feigelson, & Nelson (1986) Isobe, T. Feigelson, E. D., & Nelson, P. I. 1986, ApJ, 306, 490
- Jannuzi (1998) Jannuzi, B. T. 1998, in Structure and Evolution of the IGM from QSO Absorption Line Systems, eds. P. Petitjean & S. Charlot, (Paris : Editions Frontieres), 93
- Jannuzi et al. (1998) Jannuzi, B. T., et al. 1998, ApJS, 118, 1
- Jannuzi & Hartig (1994) Jannuzi, B. T., & Hartig, G. F. 1994, in Calibration of the Science Instruments on HST, ed. J. C. Blades & S. Osmer (Baltimore : STScI), 215
- Koratkar et al. (1998) Koratkar, A., Antomucci, R., Goodrich, R. & Storrs, A. 1998, ApJ, 503, 599
- LaValley, Isobe, & Feigelson (1992) LaValley, M., Isobe, T., & Feigelson, E. 1992, in Astronomical Data Analysis Software and Systems I, ASP Conf. Series, V25, D.M. Worrall, C. Biemesderfer, & J. Barnes, eds., 245
- Lanzetta, Turnshek, & Wolfe (1987) Lanzetta, K. M., Turnshek, D. A., & Wolfe, A. M. 1987, ApJ, 322, 739
- Lu et al. (1996) Lu, L., Sargent, W. L. W., Barlow, T. A., Churchill, C. W., & Vogt, S. S. 1996, ApJS, 107, 475
- More (1978) More, J. J. 1978, in Numerical Analysis Proceedings, ed. G.A. Watson, Lecture Notes in Mathematics (Garching : Springer–Verlag), 630
- Morton & Blades (1986) Morton, D. C., & Blades, J. C. 1986, MNRAS, 220, 927
- Morton (1991) Morton, D. C. 1991, ApJS, 77, 119
- Petitjean & Bergeron (1990) Petitjean, P., & Bergeron, J. 1990, A&A, 231, 309
- Petitjean & Bergeron (1994) Petitjean, P., & Bergeron, J. 1994, A&A, 283, 759
- Press et al. (1992) Press, W. H., Flannery, B. P., Teukolsky, S. A., & Vetterling, W. T. 1992, Numerical Recipes, (Cambridge : Cambridge University Press)
- Rao & Turnshek (1995) Rao, S. M., & Turnshek, D. A. 1995, ApJ, 499, 488
- Rao & Turnshek (1999) Rao, S. M., & Turnshek, D. A. 1999, in preparation
- Robertson et al. (1988) Robertson, J. G., Morton, D. C., Blades, J. C., York, D. G., & Meyer, D. M. 1988, ApJ, 325, 635
- Sargent, Boksenberg, & Steidel (1988) Sargent, W. L. W., Boksenberg, A., & Steidel, C. C., 1988, ApJS, 68, 539 (SBS)
- Savage et al. (1993) Savage, B. D., et al. 1993, ApJ, 413, 116
- Savage & Sembach (1996) Savage, B. D., & Sembach, K. R. 1996, ARA&A, 34, 279
- Savage, Sembach, & Lu (1997) Savage, B. D., Sembach, K. R., & Lu, L. 1997, AJ, 113, 2158
- Schneider et al. (1993) Schneider et al. 1993, ApJS, 87, 45
- Sembach, Danks, & Savage (1993) Sembach, K. R., Danks, A. C., & Savage, B. D. 1993, A&AS, 100, 107
- Sembach & Savage (1992) Sembach, K. R., & Savage, B. D. 1992, ApJS, 83, 147
- Steidel (1995) Steidel, C.C. 1995, in QSO Absorption Lines, ed. G. Meylan (Garching : Springer Verlag), 139
- Steidel et al. (1995) Steidel, C. C., Bowen, D. V., Blades, J., & Dickinson, M. 1995, ApJL, 440, 45
- Steidel et al. (1997) Steidel, C. C., Dickinson, M., Meyer, D. M., Adelberger, K. L., & Sembach, K. R. 1997, ApJ, 480, 568
- Steidel et al. (1994) Steidel, C. C., Dickinson, M. & Persson, E. 1994, ApJ, 437, L75
- Steidel & Sargent (1992) Steidel, C. C., & Sargent, W. L. W. 1992, ApJS, 80, 1 (SS92)
- Tytler (1982) Tytler, D. 1982, Nature, 298, 427
- Tytler et al. (1987) Tytler, D., Boksenberg, A., Sargent, W. L. W., Young, P., & Kunth, D. 1987, ApJS, 64, 667
- Vallerga et al. (1993) Vallerga, J. V., Vedder, P. W., Craig, N., & Welsh, B. Y. 1993, ApJ, 411, 729
- Veron–Cetty et al. (1990) Veron–Cetty, M.–P., Djorgovski, S., Magain, P., Meylan, G., & Surdjen, J., A&A Supp, 86, 543
- Vogt et al. (1994) Vogt, S. S., et al. 1994, in Proceedings of the SPIE, 2128, 326
- Welty, Morton, & Hobbs (1996) Welty, D. E., Morton, D. C., & Hobbs, L. M. 1996, ApJS, 106, 533
- Yanny (1992) Yanny, B. 1992, PASP, 104, 840
- Yanny & York (1992) Yanny, B., and York, D. G. 1992, ApJ, 391, 569
| TABLE 1 | |||||
| Journal of HIRES/Keck Observations | |||||
| QSO | V [mag] | Date [UT] | Exp [s] | Range [Å] | |
| 16.2 | 1994 Jul 5 | 2700 | 3655.7–6079.0 | ||
| 17.2 | 1996 Jul 18 | 3000 | 3766.2–5791.3 | ||
| 16.1 | 1995 Jan 23 | 5400 | 4317.7–6775.1 | ||
| 15.5 | 1995 Jan 22 | 5400 | 3765.8–6198.9 | ||
| 16.5 | 1995 Jan 22 | 4500 | 3765.8–6198.9 | ||
| 15.7 | 1995 Jan 24 | 3600 | 3977.8–6411.8 | ||
| 16.0 | 1995 Jan 23 | 3600 | 5400.0–7830.0 | ||
| 16.1 | 1995 Jan 23 | 3600 | 3810.5–6304.9 | ||
| 15.4 | 1995 Jan 22 | 2400 | 3765.8–6189.9 | ||
| 16.3 | 1995 Jan 22 | 4200 | 3765.8–6189.9 | ||
| 16.0 | 1995 Jan 23 | 3600 | 3810.5–6304.9 | ||
| 16.3 | 1996 Jul 18 | 6300 | 3766.2–5791.3 | ||
| 16.0 | 1995 Jan 22 | 3600 | 3765.8–6189.9 | ||
| 18.3 | 1994 Jul 4,5 | 16,200 | 3726.9–6191.0 | ||
| 14.9 | 1994 Jul 4,5 | 2700 | 3723.3–6185.7 | ||
| 15.9 | 1996 Jul 19 | 3900 | 3766.2–5791.3 | ||
| 16.3 | 1996 Jul 18 | 4500 | 3766.2–5791.3 | ||
| TABLE 2 | ||||
| FOS Archival Data Used for this Study | ||||
| QSO | Alias | Program ID and PI | ||
| G130H | G190H | G270H | ||
| (1150–1600 Å) | (1600–2300 Å) | (2225–3275 Å) | ||
| UM | 6705(Koratkar) | 4581(KP) | ||
| PHL | 6577(Rao) | |||
| PG | 6109(Koratkar)∗ | 5664(KP) | ||
| PKS | 1026(Burbidge) | 1026(Burbidge) | 1026(Burbidge) | |
| PKS | 5351(Bergeron) | 5351(Bergeron)+5451(Bowen) | ||
| PKS | 6577(Rao) | |||
| MRK | 5664(KP) | |||
| PG | 2424(KP) | 2424(KP) | ||
| PG | 4112(KP) | |||
| PG | 5664(KP) | 5664(KP) | ||
| TON | 2424(KP) | 2424(KP) | ||
| PG | 5948(Lanzetta) | 6577(Rao) | ||
| PKS | 2424(KP) | 2424(KP) | ||
| C | 5304(Steidel) | 5304(Steidel) | ||
| PG | 3732(Impey)∗ | 3221(KP) | ||
| PKS, PHL 1598 | 4581(KP) | 4581(KP) | ||
| PKS | 2424(KP) | 2424(KP) | ||
| ∗ Spectropolarimtrey mode; limited use (see text). | ||||
| Note:— KP indicates the observation was either part of the QSO Absorption Line Key Project (PI J. Bahcall) | ||||
| observations or from the GTO observations of J. Bahcall. | ||||
| TABLE 3 | ||||
|---|---|---|---|---|
| Database and HIRES/Keck Resultsa | ||||
| QSO | [Å] | [Å] | [Å] | |
| 0.5915 | ||||
| 0.8514 | ||||
| 0.8665 | ||||
| 0.9560 | ||||
| 0.6127 | ||||
| 0.7252 | ||||
| 0.5764 | b | |||
| 0.7291 | ||||
| 1.0480 | ||||
| 1.3250 | ||||
| 1.3430 | b | b | ||
| 0.4744 | ||||
| 0.4833 | ||||
| 0.6428 | ||||
| 0.8596 | ||||
| 0.9315 | b | |||
| 1.1532 | ||||
| 0.7055 | ||||
| 0.9110 | ||||
| 1.2113 | ||||
| 1.2724 | ||||
| 0.9276 | ||||
| 0.9343 | ||||
| 0.5505 | ||||
| 0.5584 | ||||
| 0.8955 | ||||
| 0.7730 | ||||
| 0.8546 | ||||
| 0.6601 | ||||
| 0.5008 | ||||
| 0.8933 | ||||
| 0.9739 | ||||
| 0.9984 | ||||
| 0.4566 | ||||
| 0.5215 | ||||
| 0.4720 | ||||
| 0.6561 | ||||
| 0.7971 | ||||
| 0.8913 | ||||
| 0.8182 | ||||
| 0.9056 | ||||
| 0.9902 | ||||
| 1.0414 | ||||
| 0.4297 | b | |||
| 0.7908 | ||||
| a All equivalent widths are rest–frame and their limits are . | ||||
| b Not “flag” transition; see system notes (§3) | ||||
TABLE 4 FOS/HST Resultsa QSO Ly lim 0.5915 b b 0.8514 0.8665 b b 0.9560 b 0.6127 0.7252 b 0.5764 b 0.7291 a b 1.0480 b 1.3250 b b 1.3430 b 0.4744 0.4833 b 0.6428 0.8596 b 0.9315 1.1532 b 0.7055 a b b 0.9110 1.2113 b 1.2724 0.9276 0.9343 b b 0.5505 b 0.5584 b 0.8955 0.7730 0.8546 b 0.6601 b 0.5008 b 0.8933 b 0.9739 b 0.9984 0.4566 0.5215 0.4720 b b 0.6561 b 0.7971 0.8913 b b 0.8182 b 0.9056 b b 0.9902 1.0414 0.4297 0.7908 a All equivalent widths are rest–frame and their limits are . b Not “flag” transition; see system notes (§3)


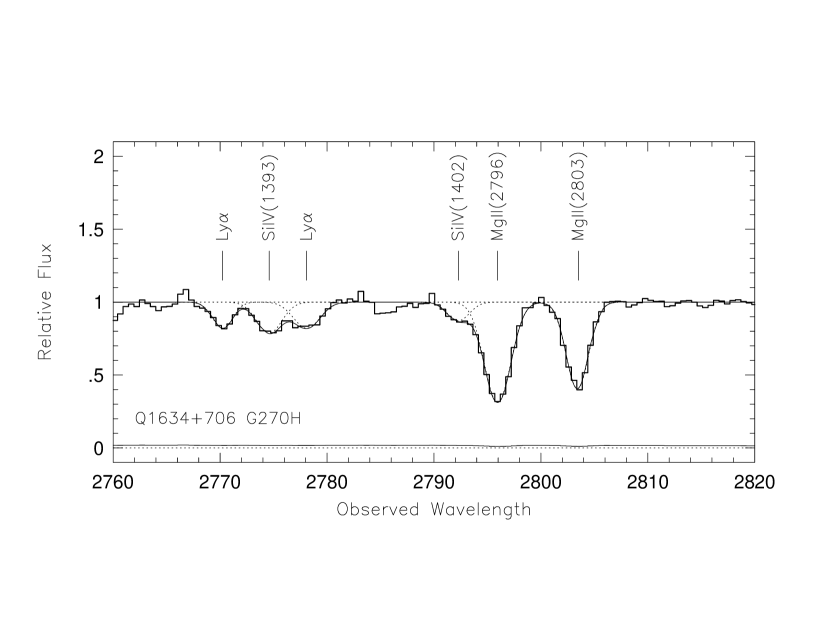


![[Uncaptioned image]](/html/astro-ph/0005585/assets/x8.png)
![[Uncaptioned image]](/html/astro-ph/0005585/assets/x9.png)
![[Uncaptioned image]](/html/astro-ph/0005585/assets/x10.png)
![[Uncaptioned image]](/html/astro-ph/0005585/assets/x11.png)
![[Uncaptioned image]](/html/astro-ph/0005585/assets/x12.png)
![[Uncaptioned image]](/html/astro-ph/0005585/assets/x13.png)
![[Uncaptioned image]](/html/astro-ph/0005585/assets/x14.png)
![[Uncaptioned image]](/html/astro-ph/0005585/assets/x15.png)
![[Uncaptioned image]](/html/astro-ph/0005585/assets/x16.png)
![[Uncaptioned image]](/html/astro-ph/0005585/assets/x17.png)
![[Uncaptioned image]](/html/astro-ph/0005585/assets/x18.png)
![[Uncaptioned image]](/html/astro-ph/0005585/assets/x19.png)
![[Uncaptioned image]](/html/astro-ph/0005585/assets/x20.png)
![[Uncaptioned image]](/html/astro-ph/0005585/assets/x21.png)
![[Uncaptioned image]](/html/astro-ph/0005585/assets/x22.png)
![[Uncaptioned image]](/html/astro-ph/0005585/assets/x23.png)
![[Uncaptioned image]](/html/astro-ph/0005585/assets/x24.png)
![[Uncaptioned image]](/html/astro-ph/0005585/assets/x25.png)
![[Uncaptioned image]](/html/astro-ph/0005585/assets/x26.png)
![[Uncaptioned image]](/html/astro-ph/0005585/assets/x27.png)
![[Uncaptioned image]](/html/astro-ph/0005585/assets/x28.png)
![[Uncaptioned image]](/html/astro-ph/0005585/assets/x29.png)
![[Uncaptioned image]](/html/astro-ph/0005585/assets/x30.png)
![[Uncaptioned image]](/html/astro-ph/0005585/assets/x31.png)
![[Uncaptioned image]](/html/astro-ph/0005585/assets/x32.png)
![[Uncaptioned image]](/html/astro-ph/0005585/assets/x33.png)
![[Uncaptioned image]](/html/astro-ph/0005585/assets/x34.png)
![[Uncaptioned image]](/html/astro-ph/0005585/assets/x35.png)
![[Uncaptioned image]](/html/astro-ph/0005585/assets/x36.png)
![[Uncaptioned image]](/html/astro-ph/0005585/assets/x37.png)
![[Uncaptioned image]](/html/astro-ph/0005585/assets/x38.png)
![[Uncaptioned image]](/html/astro-ph/0005585/assets/x39.png)
![[Uncaptioned image]](/html/astro-ph/0005585/assets/x40.png)
![[Uncaptioned image]](/html/astro-ph/0005585/assets/x41.png)
![[Uncaptioned image]](/html/astro-ph/0005585/assets/x42.png)
![[Uncaptioned image]](/html/astro-ph/0005585/assets/x43.png)
![[Uncaptioned image]](/html/astro-ph/0005585/assets/x44.png)
![[Uncaptioned image]](/html/astro-ph/0005585/assets/x45.png)
![[Uncaptioned image]](/html/astro-ph/0005585/assets/x46.png)
![[Uncaptioned image]](/html/astro-ph/0005585/assets/x47.png)
![[Uncaptioned image]](/html/astro-ph/0005585/assets/x48.png)
![[Uncaptioned image]](/html/astro-ph/0005585/assets/x49.png)


