Periodic modulation of the optical counterpart of the X-ray pulsator 1WGA J1958.2+3232. A new intermediate polar.††thanks: Based on observations collected at Catania and Asiago Astrophysical Observatories.
Abstract
Time-resolved observations of a 6’ x 6’ field, containing the position error boxes of the X-ray source 1WGA J1958.2+3232, were performed in June 1999 with the 91 cm Catania telescope, equipped with a Photon Counting Intensified CCD. The star recently proposed as the optical counterpart of the 1WGA J1958.2+3232, exhibited a strong optical modulation with a period compatible with that seen in X-ray ( 12 min). The optical modulation was detected again in September and October 1999. These results confirm the identification of the optical counterpart and support the classification of 1WGA J1958.2+3232 as a cataclysmic variable, possibly an Intermediate Polar. Modulation at period twice as large was also found in one observation run, suggesting that the true spin period of the White Dwarf could be 24 min rather than 12 min, thus 1WGA J1958.2+3232 appears to be, among the IPs, the slowest rotator which exhibit double peaked spin profile.
Key Words.:
stars: individual: 1WGA J1958.2+3232 – novae, cataclysmic variables – binaries: close - X-rays: stars – instrumentation: photometers1 Introduction
1WGA J1958.2+3232 is one of the objects found by Israel et al. (Isr98 (1998)) in a systematic search for pulsators in the catalogue of ROSAT X-ray sources compiled by White, Giommi & Angelini (WGA94 (1994)). The source appeared with a mean flux (in 0.1-2.4 keV) of 10-12 erg cm-2 s-1, modulated with a period 721 14 s and pulsed fraction of about 80%. A subsequent observation performed by ASCA confirmed both the flux level and the strong periodic modulation at 734 1 s (Israel et al. Isr99 (1999)). The energy spectrum, as measured by ROSAT, is consistent with a power law model with a photon index =0.8 and a column density NH=(6)1020cm-2.
On the basis of optical photometry and spectroscopy, Israel et al. (Isr99 (1999)) proposed a mV=15.7 star as the counterpart of 1WGA J1958.2+3232. The spectrum of this star, characterized by strong emission lines, was classified as B0Ve type, suggesting that 1WGA J1958.2+3232 could be a Be/X-Ray binary with an accreting neutron star. The assumed distance of 800 pc (resulting from interstellar absorption spectral features) yielded an X-ray luminosity of 81031 erg s-1 in 0.1-2.4 keV.
Recently Negueruela et al. (Neg99 (2000)) reported new spectroscopic measurements, with a higher signal to noise ratio, of the Israel et al. (Isr99 (1999)) candidate. They found that optical properties of the source are incompatible with a Be/X-Ray binary, because photospheric features are absent, whereas some characteristics of the spectrum, such as the strong emission in all Balmer lines, are typical of a cataclysmic variable. The shape of the lines, strongly asymmetric and double peaked, suggests the presence of an accretion disc.
We included 1WGA J1958.2+3232 in our target list during a campaign for scientific performance evaluation of a photon counting detector that we carried out in June 1999. We report here on the results of this campaign and of subsequent observations.
2 Observations
The observations were carried out with the 91 cm telescope of the Astrophysical Observatory of Catania (OACT) - Serra la Nave and with the 182 cm telescope of the Astronomical Observatory of Padua (OAPD) - Asiago Cima Ekar (see the observations log in Table 1). Two kinds of detectors were used: a photon counting camera based on an Intensified CCD111The ICCD detector has been developed at the Istituto di Fisica Cosmica ”G.Occhialini”, in collaboration with Dipartimento di Ingegneria Elettronica of Padua University. (Bergamini et al. Ber97 (1997, 1998, 2000)) and a standard photomultiplier photometer.
The Photon Counting ICCD (PC-ICCD) employs a high-gain Micro-Channel Plate (MCP) image intensifier as input device. The intensifier converts virtually each photon, interacting photoelectrically with the photocathode, into a luminous spot on a phosphor screen that preserves the (x,y) location of the event. The photon event is reimaged onto a fast framing CCD camera by means of a fiber optic taper with a 3.6:1 demagnification ratio. The camera detects the location of each event and a dedicated digital electronic system establishes the coordinates of the centroid of the events with subpixel accuracy. The detector can operate in image integration mode, where the collected photons are accumulated in a memory array, or in photon list mode where the photon events are recorded as a list of time tagged event coordinates with temporal resolution as low as 4.5 ms.
Thus, in photon list mode, the PC-ICCD is able to perform high speed space resolved photometry, allowing to investigate time variability down to few ms, simultaneously for all the stars in the field of view.
The PC-ICCD was developed for space UV astronomy and uses a RbTe photocathode: even though the photocathode shows its peak sensitivity in the vacuum UV range, it yields a residual quantum efficiency ( 0.1 %) for ground based observations (Bergamini et al. Ber00 (2000)). In order to preserve this residual efficiency, no photometric filter has been used with the ICCD; the boundaries of instrumental band (3200-5500 Å) were set respectively by the atmosphere UV cut-off and by the detector photocathode sensitivity.
For measurements in photometric bands, we used a photon-counting cooled photometer of OACT, equipped with an EMI 9893QA/350 photomultiplier.
| Date | Detector | Site | Telescope | UT start | Duration | Time resolution | Filtera |
|---|---|---|---|---|---|---|---|
| June 9, 1999 | ICCD | OACT | 91 cm | 01.27.10 | 2686 s | 16.8 ms | WL |
| June 13, 1999 | ICCD | OACT | 91 cm | 01.27.07 | 3600 s | 16.8 ms | WL |
| June 15, 1999 | ICCD | OACT | 91 cm | 01.18.15 | 3768 s | 16.8 ms | WL |
| June 17, 1999 | ICCD | OACT | 91 cm | 00.58.42 | 5004 s | 16.8 ms | WL |
| June 18, 1999 | ICCD | OACT | 91 cm | 00.14.20 | 7565 s | 16.8 ms | WL |
| September 7, 1999 | EMI 9893QA/350 | OACT | 91 cm | 21.03.02 | 7000 s | 5 s | U |
| September 14, 1999 | EMI 9893QA/350 | OACT | 91 cm | 20.02.38 | 9000 s | 5 s | U |
| October 1, 1999 | ICCD | OAPD | 182 cm | 21.14.01 | 9646 s | 4.512 ms | WL |
-
a
WL = White Light
3 Data analysis and results
3.1 Source identification and short term variability
On several nights in June 1999, 1WGA J1958.2+3232 was observed in photon list mode with a time resolution of 16.8 ms for a total of 6.3 h distributed in five integrations (Table 1). The 27.6 27.6 mm2 sensitive area of the PC-ICCD covered a 6.4’ 6.4’ field of view with an effective resolution of 0.35 arcsec (FWHM).
A set of IDL routines were used to process the data stream of each observation and to perform data reduction adopting the following procedure. The observations were segmented into 60 s long data subsets. From each subset a 512 512 image array (pixel size 0.75) was accumulated and flat–field corrected. In order to add consistently the field images acquired in the five separate observation runs and to compensate for small tracking inaccuracies within the single run, we selected a bright isolated source and used its centroid to coalign the 60 s images. The latter procedure, which improved the overall Point Spread Function (FWHM) from 4 to 3, was also applied to the light curve extraction process described below. A 2.82.8 section of the field accumulated from the 6.3 h observation is shown in Fig. 1: the circles represent the position uncertainty (90% confidence) of ROSAT (30) and ASCA (40) X-ray detections.
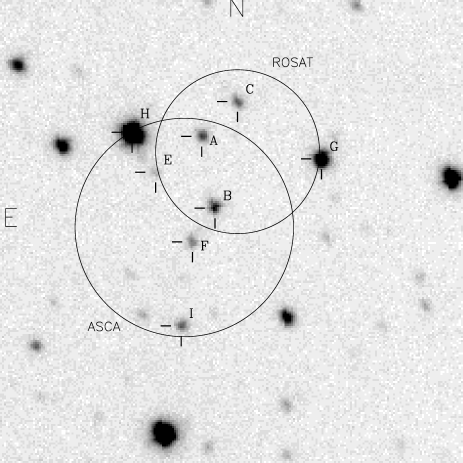
From the sources found inside, or close to, the two position error circles we selected eight objects detected well above the sky background to be searched for variability. Note that the contribution of the detector noise to the background is virtually nil, being as low as 10-5 counts s-1 pix-1 (sky background was 10-2 counts s-1 pix-1). From each object labeled in Fig. 1 (the candidates of Israel et al. Isr99 (1999) are reported with the same name, except star D which is too faint in our data) we extracted the source and background light curve binned at 1 s resolution. Great care was paid in the selection of the aperture radii used in the process, the field of 1WGA J1958.2+3232 being located in a crowded region near the galactic equator. The optimal source aperture radius was found at 2.25 whereas for the background a concentric ring of inner and outer radii respectively measuring 9 and 11.25 was used. With the same procedure the light curves of three bright stars found well outside both ROSAT and ASCA error box were generated and, since a preliminary time series analysis excluded any intrinsic periodicity, they were used as comparison to remove any atmospheric effect.
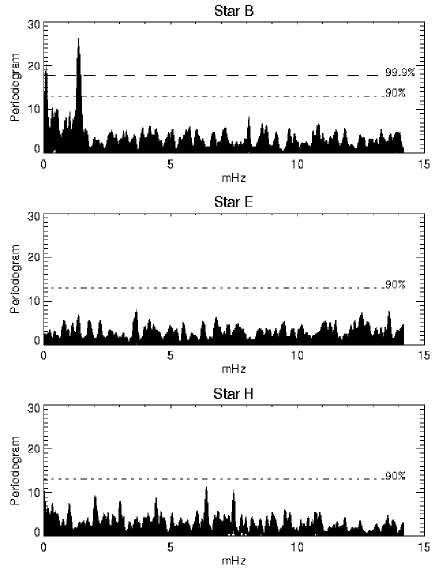
To investigate the time variability, for each object we computed a Lomb-Scargle periodogram (Scargle Sca82 (1982)) on the combined data set. Some typical periodograms are shown in Fig. 2. Only star B shows a significant periodic signal. The periodogram shows two peaks, the most apparent corresponding to about 721 s period, consistent with the X-ray period. Star B is the source previously proposed as optical counterpart of 1WGA J1958.2+3232 by Israel et al. (Isr99 (1999)).
In order to look for longer periodicity, we planned new observations with the PC-ICCD at Asiago Observatory at the beginning of October but, due to poor weather conditions, we were able to collect only about 2h40m of data. The detector was operated in the highest time resolution mode (4.512 ms), corresponding to the widest dynamic range, but with a reduced field of view (a quarter of the sensitive area of the detector, resulting, with the Asiago plate scale, in 5.8’ 1.45’). This choice was determined by the necessity to preserve, under higher count rates resulting from the better efficiency of the telescope, the linearity of the detector also for the brightest nearby stars, employed as comparison in data reduction of June observations. Thus, we were able to use the same comparison stars also for the October 1 run.
Observations in standard optical photometric bands have been
carried out with the photoelectric photometer, again at the 91 cm
telescope of the Catania Astrophysical Observatory. The
photometer was operated in two different mode: i) in the standard
mode to determine the U B V magnitudes and colours in the Johnson
system, ii) in continuous acquisition at fixed filter,
the U filter in our case. A diaphragm of = 15 arcsec was adopted.
The V magnitude and colour indices of 1WGA J1958.2+3232
were determined calibrating on nearby field stars of known
magnitudes and colours (e.g. HD 188992 V=8.29,
B-V=-0.07, U-B=-0.38, and HD 189596 V= 7.54, B-V=-0.11,
U-B=-0.44). Average seasonal atmospheric extinction and
instrumental coefficients have been adopted to transform
instrumental magnitudes to the Johnson system. The magnitudes and
colours we obtain for 1WGA J1958.2+3232 are V= 15.713
0.073, B-V = 0.231 0.067, U-B = -0.784 0.096.
Continuous monitoring observations on September 7 and 14, with the U filter and integration time of 5 sec for each measurement, have been done with the aim of improving the measured accuracy of the 12 m period. Uninterrupted sequences of 7000 second and of 9000 sec were obtained in September 7 and 14 respectively. The sky background was subtracted by linear interpolation of the values measured on ten samplings obtained at the beginning and at the end of each run. Correction for the atmospheric extinction have been made by adopting the average seasonal coefficient for the U filter.
No measurements of the sky background or of comparison stars have been made during the observing runs, to avoid interruptions of the data string and introduction of spurious frequencies in the power spectrum. This prevents us from using these data to study the long term variability.
The light curves of the source in the single nights, reduced as previously explained, are shown in Fig. 3.

A Lomb-Scargle periodogram was applied on the time series from separate nights, after removing low frequency trends in U band observations (carried out without comparison stars) by a polynomial fit on each data set. The periodograms are shown in Fig. 4: the best period and its first harmonic are marked by vertical dotted lines. In all but one observations a peak was clearly visible near the period of the X-ray modulation. The amplitude of the peak varies from night to night, but in the longest runs it is statistically significant. On the other hand, in the periodogram of June 13, there is only a hint of a peak. The different run length doesn’t justify the difference in the observability of the modulation: the peak of the longest run (October 1) is well below the 90% confidence level. In four observations a weaker peak is also present near the first harmonic of the X period, suggesting that pulse shape is time dependent and not simply sinusoidal. We notice also the presence of a peak corresponding to a period about twice the main period that can be seen in the periodograms of June 15 and September 7. In September 7, the confidence level for this frequency is greater than 99.999 %.

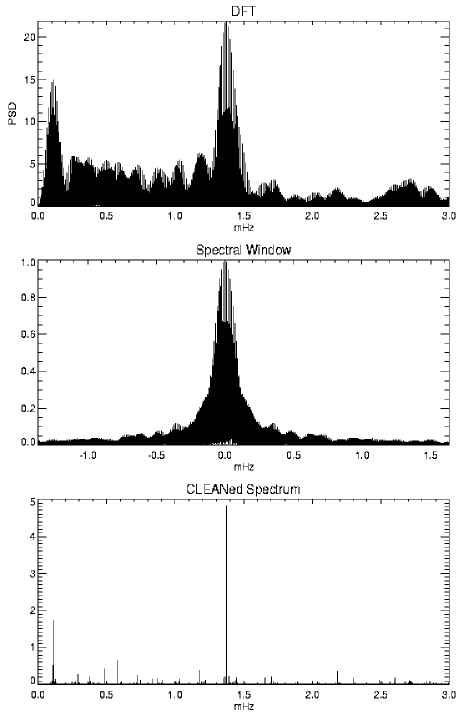
In order to improve the resolution in the main period measure, a Discrete Fourier Transform (DFT) was computed on the overall observation set (Deeming Dee75 (1975)), excluding the observation of October 1, because the modulation was very low. The spectrum is shown in Fig. 5, together with the spectral window. The clean spectrum, produced by the deconvolution of the raw spectrum with the spectral window by means of the CLEAN algorithm (Roberts et al. Rob87 (1987)), is also included in the lower panel of Fig. 5. The resulting main period is 727.06 0.02 s, but, due to the complex spectral window, dominated by the 1/d aliasing, there is an ambiguity as to which of the alias peak is the true period. A MonteCarlo simulation showed that 1/d alias 721 and 733 s are acceptable (the resulting probability for the 727 s peak to be the true period is about 70 %, whereas there is about 30 % probability for either 721 s or 733 s peak). In particular, 733.24 0.02 is compatible with the ASCA measure (734 1 s), thus we consider this period as the most likely. In the CLEANed spectrum it is also apparent the presence of some weaker peaks,near 833 s and at some others lower frequency.
Instead, there is no significant peak near the half frequency of the main modulation. The FFT computed on the longest data set in which this modulation is apparent yields a best period determination of 1448158 s. The DFT computed on both the data set showing this modulation doesn’t improve the accuracy. In fact, the June 15 observation is far shorter, with lower statistics and the large gap between the two observations results in a quite complex spectral window. In order to better estimate the period, the epoch folding technique (Leahy et al. Lea83 (1983)) was applied to the September 7 data, after removing the 733.24 modulation by subtracting a Fourier fit (in the epoch folding diagrams peaks are found at all the sub-harmonics of the signal frequencies). The resulting period was 1467 25 s (the uncertainty has been derived from simulations), consistent with 2 733 s. After subtracting the long term variation, the light curves of September 7 and 14 were folded at twice the 733.24 s period (Fig. 6). A visual inspection of the folded light curves confirms the presence of an even-odd effect, more evident in the September 7 pulse shape.

3.2 The long term variability
Low frequency, high amplitude variations are clearly apparent in
the longest differential photometry runs and from night to night.
For example, the mean flux on October 1 is 50% lower than the
mean flux averaged on the five nights of June. Moreover, on June
17, the source intensity increases by about 50% during
1h20m. In both observations carried out with the
photometer, without comparison stars, the data show long term
trends not easily attributable to instrumental or transparency
changes. The data of September 7 show a slightly increasing trend
from the beginning to the end of the observations, even before the
correction for the atmospheric extinction is applied. After the
atmospheric
extinction correction, the average increase is about 15 %.
The data of September 14 show a steady increase in the first half
of the observations, up to about the 40 %, and then a decrease
to about the initial level. Although the changes in September 7
night could result from an improvement of the sky transparency,
the trend observed on September 14 is more difficult to explain
in the same way. In both cases the observations were made after
the object meridian passage, therefore, the extinction effect
should increase with time, contrary to the observed trends. The
sky was very clear on both nights, so that an increase of the
transparency of about the 40 %, as shown by the data of the
second night, is very unlikely, also because the subsequent
observations made during the rest of the night do not support
this possibility. Changes on the photometer gain are excluded by
the stability of the photon counting system over several years.
Also changes in the sky background can be excluded because we
were in dark period, and the observing direction is free of any
close city light. The telescope was manually guided all the time
through an intensified TV camera using an off-set nearby star.
Normally the correction of the telescope wiggle produces random
noise, or loss of signal, but no long term trends. We are,
therefore, inclined to attribute the observed long term variation
to real variations of intensity of 1WGA J1958.2+3232.
A peak is apparent in the DFT at low frequency (the second highest peak in the CLEANed spectrum showed in Fig. 5), corresponding to a period of 2.45h (with alias at 2.73h and 2.23h) with modulation of about 7.5%. However, due to the poor sampling, we are not able to reliably ascribe it to an orbital period. In fact the period corresponding to the peak is only slightly shorter than the two longest runs.
4 Discussion
Our observed B-V and U-B color indices are not compatible with colors of any unreddened normal stellar object. If it was a reddened object, adopting the Cygnus reddening law , 1WGA J1958.2+3232 would come out to be a hot star of spectral type about O5, with E(B-V) 0.6. Assuming a standard reddening law, the visual interstellar extinction mag would lead to a distance of 1.5-2 Kpc, not compatible with the absence of interstellar absorption feature in Na I D2 lines and the weak interstellar feature observed in the Ca II K line (Negueruela et al. Neg99 (2000)), which are in agreement with a far lower distance, not above 500 pc.
In fact 1WGA J1958.2+3232 in the color-color diagram lies on the Black-Body and white dwarf region. According to our measurements (B-V = 0.231 0.067 and U-B = - 0.784 0.096), it falls a little above the B-B line and the main distribution of DA white dwarfs: it should be an object of about T=10,000 K whose optical emission comes from the disc accretion region.
Large modulation at the 733 s period (the same as measured in X-ray) was found in almost every night, even if with a variable amplitude. Weaker power peaks are present only in two data sets, but further measures are needed to confirm their significance. The detection of periodical optical modulation at the X-ray period rules out any possibility that 1WGA J1958.2+3232 could be a binary system hosting a Be, because the optical emission should be dominated by the early type star, whereas the modulated component comes from the compact object. A stable optical period, usually in the range from some tens of seconds to some tens of minutes, and X-ray modulation at or close to the same period, is a signature of the Intermediate Polar class of Cataclysmic Variables.
Generally, in the Intermediate Polar power spectra, the main power is found at the spin period in X-ray (with the exception of RX1712-24, Buckley et al. Buc97 (1997)), whereas the optical light curves can be dominated by the spin (e.g. V709 Cas, Norton et al. Nor99 (1999), BG CMi, De Martino et al. DM95 (1995), UU Col, Burwitz et al. Bur96 (1996)), or by a sideband (e.g. AO Psc, Hellier et al. Hel91 (1991), V1223 Sgr, Jablonski & Steiner Jab87 (1987), RX J1712-24, Buckley et al. Buc95 (1995)), or by the orbital modulation, depending on the strength of the magnetic field and the accretion geometry and rate. In particular, differences in the accretion rate can produce variation in the dominant frequency (e.g. FO Aqr, which in the past was dominated by the spin period, De Martino et al. DM94 (1994), recently was found with the orbital modulation dominating over all the other periods, De Martino et al. DM99 (1999)).
In the X-Ray light curve measured by ROSAT, Israel et al. (Isr98 (1998)) found modulation at the same period that we see in optical and at its first harmonic, whereas they didn’t find any evidence of a period shorter then the main one. Thus, the dominant period in X-rays and the optical should be the spin of the white dwarf, rather than a sideband of a shorter period. The dominance of the spin period and the non-detection of sidebands neither in X-ray nor in optical light curves suggest that 1WGA J1958.2+3232 is a disc accretor.
The amplitude of the modulation varies greatly from night to night, but this is a rather common behavior for the Intermediate Polars class (see, for example, Welsh & Martell Wel96 (1996)). Especially in the optical domain, IPs often show night to night variations in the relative amplitudes of the power spectrum at the characteristic frequencies. The presence of power in the DFT at the first harmonic of the 12 min period, in some nights only, suggests that the pulse shape could be variable.
The presence of another peak at half frequency suggests that the true spin period could be 1466 s: then, the 12 min period would be the first harmonic and the peak sometimes seen at 3687 s would correspond to the third harmonic. Among the Intermediate Polars there are three systems (DQ Her, YY Dra and V405 Aur, Allan et al. All96 (1996)) which have optical and X-ray light curves dominated by the modulation at the first harmonic of the spin period, whereas at the fundamental frequency the modulation is very weak, or absent. However, all these objects are characterized by a fast spinning white dwarf (142 s, 529 s, 545 s respectively, Ritter & Kolb Rit98 (1998)). Commonly, the double peak pulse shape is interpreted as a signature of two poles accretion, but Norton et al. (Nor99 (1999)) point out that two poles accretors generally produce single peaked profiles (e.g. in EX Hya there is strong evidence of two poles accretion but the pulse profile is single peaked, Hellier Hel95 (1995)). They outline a model according to which, among the two poles accretors, only short period IPs (with a period below 700 s) could exhibit a double peaked pulse profile. For another system (BG CMi) there has been some uncertainty whether the dominant period (913 s) is the spin period or a sideband of its first harmonic (Patterson & Thomas Pat93 (1993)), but successive observations did not find any evidence confirming the longer 1693 s period (Garlick et al. Gar94 (1994), De Martino et al. DM95 (1995), Hellier Hel97 (1997)).
If 24 min were the true period, 1WGA J1958.2+3232 would be the slowest rotator which exhibits double peaked profile. In the Norton model it should have a single peaked pulse shape even if the accretion takes place on two poles. However, we point out the very high significance level of the 24 min peak in September 7 night and the evident even-odd asymmetry in the folded light curve in Fig. 6.
In conclusion, in spite that the evidence for this longer period is present only in one observation run and in spite that the run cover only less than 5 periods, we tend to identify the 24 min period as the true spin period, but further observations (in particular, time resolved spectroscopy) are needed in order to confirm this outcome.
In the time series from October 1 observation, the modulation at
12 min is very low and the corresponding peak in the periodogram
is well below the 90% confidence level. In the same night, the
mean flux is 20% lower than the flux averaged on the June
observations and in the middle of the run a dip is present: a
possible explanation of this behavior could be a partial eclipse
of the accreting
disc.
Regarding the long term variability, we are not able to ascribe
it to an orbital modulation, because the low frequency peaks in
the DFT correspond to long periods, poorly sampled by the
observations. The presence of power at low frequency could be
produced by instabilities in the accretion disc or curtain.
5 Conclusions
We have presented time resolved optical photometry of the stars included in the field of the X-ray pulsating source 1WGA J1958.2+3232. A stable, high amplitude, periodic modulation was found in the light curves of the star previously proposed by Israel et al. (Isr99 (1999)) as the optical counterpart of 1WGA J1958.2+3232. The 12 min period, compatible with the X-ray one, is likely associated with the first harmonic of the spin of a white dwarf in an Intermediate Polar Cataclysmic Variable. If this outcome will be confirmed, 1WGA J1958.2+3232 would be, among the Intermediate Polars, the slowest rotator which exhibit double peaked spin pulse shape.
Acknowledgements.
The authors are grateful to Domitilla de Martino, Gian Luca Israel, Sandro Mereghetti, Pablo Reig and Luigi Stella for helpful conversations and to Lucio Chiappetti and Constantinos Paizis for a critical reading of the manuscript. Financial support from the Catania Astrophysical Observatory and the Regione Sicilia, is gratefully acknowledged. This work was partially supported by the European Commission under contract ERB FMRXCT98-0195 and by Agenzia Spaziale Italiana (ASI).References
- (1) Allan A., Horne K., Hellier C., Mukai K., Barwig H., Bennie P.J., Hilditch R.W., 1996, MNRAS, 279, 1345-1348
- (2) Bergamini P., Bonelli G., D’Angelo S., Latorre S., Poletto L., Sechi G., Tanzi E.G., Tondello G., Uslenghi M., 1997, Proc. SPIE Vol.3114, 250
- (3) Bergamini P., Bonelli G., Tanzi E.G., Uslenghi M., Poletto L., Tondello G., 1998, Proc.SPIE, Vol.3445, 630
- (4) Bergamini P., Bonelli G., Paizis A., Tommasi L., Uslenghi M., Tondello G., Falomo R., 2000, Experimental Astronomy, in press
- (5) Buckley D.A.H., Sekiguchi K., Motch C., O’Donoghue D., Chen A., Schwarzenberg-Czerny A., Pietsch W, Harrop-Allin M.K., 1995, MNRAS, 275, 1028-1048
- (6) Buckley D.A.H., Haberl F., Motch C., Pollard K., Schwarzenberg-Czerny A., Sekiguchi K., 1997, MNRAS, 287, 117-123
- (7) Burwitz V., Reinsch K., Beuermann K., Thomas H.C., 1996, A&A, 310, L25-L28
- (8) De Martino D., Buckley D.A.H., Mouchet M., Mukai K., 1994, A&A, 284, 125-137
- (9) De Martino D., Mouchet M., Bonnet-Binaud J.M., Vio R., Rosen S.R., Mukai K., Augusteijn T., Garlick M.A., 1995, A&A, 298, 849-862
- (10) De Martino D., Silvotti R., Buckley D.A.H., Gänsicke B.T., Mouchet M., Mukai K., Rosen S.R., 1999, A&A, 350, 517-528
- (11) Deeming T.J, 1975, Ap&SS, 36, 137
- (12) Garlick M.A., Rosen S.R., Mittaz J.P.D., Mason K.O., De Martino D., 1994, MNRAS, 267, 1095-1102
- (13) Hellier C., 1995, ASP Conf.Ser., 85, 185-195
- (14) Hellier C., 1997, MNRAS, 288, 817-832
- (15) Hellier C., Cropper M., Mason K.O., 1991, MNRAS, 248, 233-255
- (16) Israel G.L., Angelini L., Campana S., Giommi P., Stella L., White N.E., 1998, MNRAS, 298, 502-506
- (17) Israel G.L., Covino S., Polcaro V.F., Stella L., 1999, A&A, 345, L1-L4
- (18) Jablonski F., Steiner J.E., 1987, ApJ, 323, 672-677
- (19) Leahy D.A., Darbro W., Elsner R.F., Weisskopf M.C., 1983, ApJ, 266160-170
- (20) Negueruela I., Reig P., Clark J.S., 2000, A&A, 354, L29-L32
- (21) Norton A.J., Beardmore A.P., Allan A., Hellier C., 1999, A&A, 347, 203-211
- (22) Patterson J., 1994, PASP, 106, 209-238
- (23) Patterson J., Thomas G., 1993, PASP, 105, 59
- (24) Ritter H., Kolb U., 1998, A&AS, 129, 83
- (25) Roberts D.H., Leh r J., Dreher J.W., 1987, AJ, 93, 968
- (26) Scargle J.D., 1982, ApJ, 263, 835-853
- (27) Welsh W.F., Martell P.J., 1996, MNRAS, 282, 739-752
- (28) White N.E., Giommi P., Angelini L., 1994, IAU Circ. 6100