FUSE Observations of Interstellar Gas Towards the LMC Star Sk -67 05
Abstract
We report on measurements of interstellar O VI, H2, P II, Si II, Ar I, and Fe II absorption along the line of sight to Sk -67 05, a B0 Ia star in a diffuse H II region in the western edge of the Large Magellanic Cloud (LMC). We find in the Milky Way (MW) component and, using the C IV column density from previous IUE observations, , a value similar to other halo measurements made with FUSE. In the LMC component, , and (), since only an upper limit on is available. Along this sightline the LMC is rich in molecular hydrogen, ; in the MW . A two-component fit for the excitation temperature of the molecular gas in the LMC gives K for and K for . For the MW, K; no excitation temperature could be determined for the higher rotational states. The MW and LMC gas-phase [Fe/P] abundances are and dex lower, respectively, than solar system abundances. These values are similar to [Fe/Zn] measurements for the MW and LMC towards SN 1987A.
Subject headings:
galaxies: Milky Way, LMC – ISM:atoms – ultraviolet:ISM1. Introduction
The analysis of interstellar absorption lines provides fundamental information about the content and physical conditions of the interstellar medium (ISM). Absorption line spectroscopy can be used to study the ISM in our Galaxy, in nearby systems such as the Magellanic Clouds, and in the intergalactic medium out to the most distant QSOs. These studies provide an opportunity to compare elemental abundances and physical conditions in regions with differing chemical histories.
As part of a general program to investigate the interstellar medium of the Milky Way and nearby galaxies, we have used the Far Ultraviolet Spectroscopic Explorer (FUSE) satellite (Moos et al. 2000) to observe the star Sk -67 05 (HD 268605) in the Large Magellanic Cloud (LMC). The first observations of Galactic halo gas with IUE were along sightlines to stars in the LMC (Savage & de Boer 1979; 1981). In this Letter we discuss the first FUSE observations of an LMC star revealing O VI absorption in both the Milky Way and LMC. We also discuss the measurements of H2, P II, Si II, Ar I, and Fe II absorption along this sightline.
2. Observations and Data Processing
Sk -67 05 ( = 27889, = -3632) is a B0 Ia star (Smith Neubig & Bruhweiler 1999) located near the western edge of the LMC. It lies in a diffuse H II region (Chu et al. 1994) with relatively low diffuse X-ray emission compared to regions closer to the center of the LMC (Snowden & Petre 1994). Ardeberg et al. (1972) give B V= -0.12, and for (B V)0 = -0.23 (Binney & Merrifield 1998), we find E(B V) = 0.11. Using the Galactic gas-to-dust correlation (Diplas & Savage 1994) we infer (H I) along this sightline.
This star was observed during the In-Orbit Checkout phase of the mission (Sahnow et al. 2000) at various times between 1999 August 20 and 1999 October 19. As these observations were part of tests designed primarily to align the four optical channels in the instrument, the star was stepped across the aperture during the observations. However, the data were taken in time-tagged photon-address mode, so that corrections could be made for this image motion. The analysis here uses LiF1 (990 - 1080 Å) data only; the LiF2 channel has lower sensitivity and poorer flatfield characteristics, and during this period no flatfield corrections were available. The SiC (905 - 1100 Å) channels were generally not aligned. The instrument was still in its preflight focus configuration, and the spectral resolution was . The wavelength scale was established with a pre-flight dispersion solution. However, because of the stepping manner in which the data were obtained, additional zero point adjustments were required. Relative velocities are generally accurate to 10 km s-1over limited spectral ranges, and the absolute scale was set by comparison with IUE spectra. The data presented represent a total of approximately 33 ksec of on-target exposure time for the LiF1A and 35 ksec for the LiF1B spectral regions, approximately equally split between day and night. Additional details of the data processing for this data set can be found elsewhere (Massa et al. 2000).
This star exhibits variable stellar wind features. However, as shown in Figure 3 of Massa et al. (2000), the variablility is minimal at the wavelengths of interest here, and does not affect our conclusions.
3. Interstellar Absorption Features
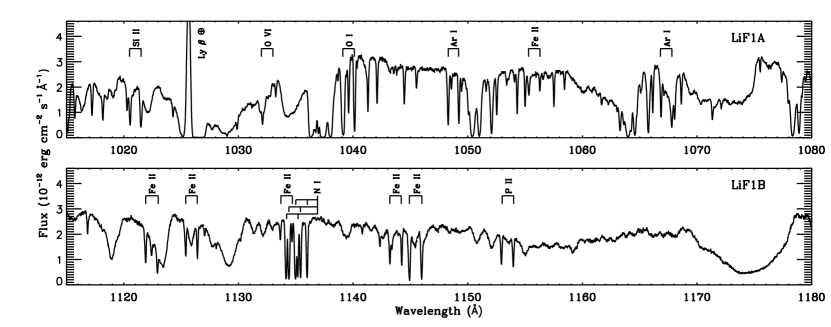
Figure 1 shows the composite spectrum from the LiF1 channel. Several metal lines that appear in the ISM of both the Milky Way and LMC are identified. Most other lines are due to H2 absorption in the LMC. The strong emission line is terrestrial Ly airglow from the daytime exposures.
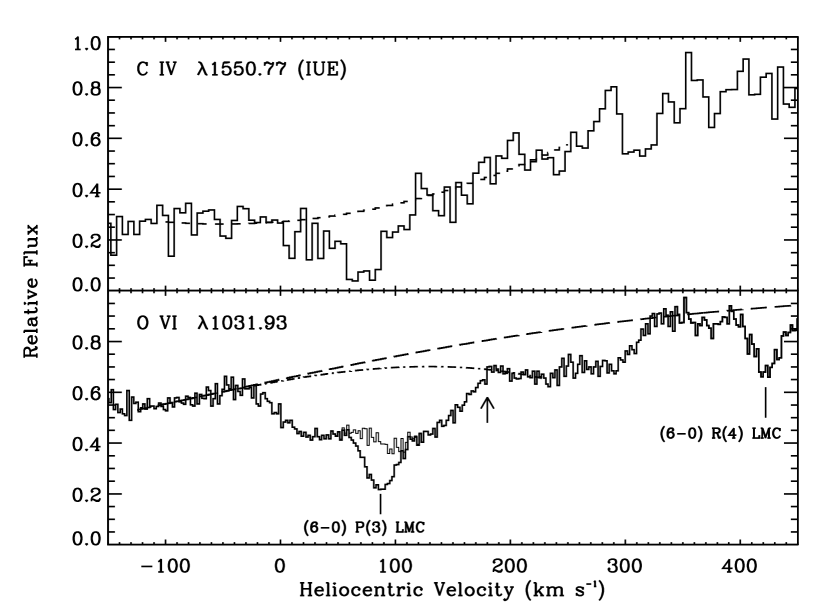
In this analysis we have used only the 1031.93 Å member of the O VI doublet since the 1037.62 Å line is blended with C II∗ 1037.02 Å and several H2 lines. Figure 2 shows the FUSE O VI absorption line and a high-dispersion IUE spectrum of the C IV . The H2 (6-0) P(3) line originating in the LMC appears at +88 km s-1, and must be modelled and removed to get an accurate estimate of the O VI column density.
We have analyzed the (2-0) to (9-0) H2 Lyman bands, using the method described in Shull et al. (2000) to determine the equivalent widths, -values, and column densities for the Milky Way and LMC components of H2. Since the typical spacing between the rotational-vibrational lines within each Lyman band is very close to the spacing between LMC and the Milky Way absorption, the measurement of the Milky Way H2 depends on a careful decomposition of blended lines. Because of this difficulty, we used only the (4-0) and (2-0) Lyman bands to measure the levels from the Milky Way gas.
The results of the H2 model, discussed below, give N(H2) = 15.28 for the (6-0) P(3) in the LMC. This was convolved with the instrumental resolution of 25 km s-1 and divided out of the original spectrum to remove the effects of the H2 absorption. The resulting O VI profile is shown as a light line in Fig. 2.
To calculate the O VI absorption we have considered two possible continuum placements, designated “high” and “low,” which are displayed in Fig. 2 as long-dashed and dash-dotted lines, respectively. The arrow at +180 km s-1 denotes the velocity we have adopted as separating the Milky Way and LMC components of O VI. Table 1 gives O VI equivalent widths derived using both continua.
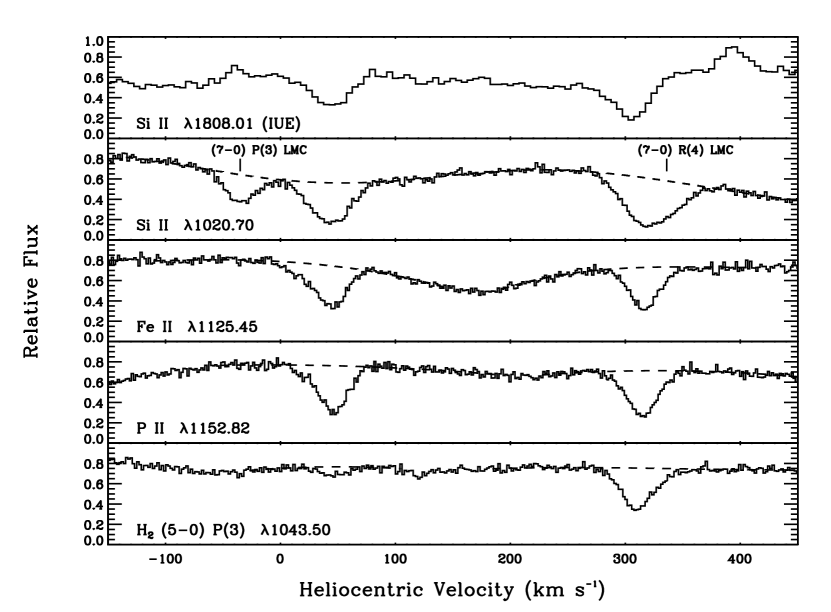
Figure 3 shows the spectra of several important metal lines and a molecular hydrogen line along the sightline to Sk -67 05. For comparison, the IUE spectrum of Si II 1808.01 is shown. The individual absorption lines have separately been shifted in velocity to align the Milky Way components with the corresponding feature in the IUE spectrum. We established the velocity scale for the O VI region by shifting the Si II 1020.70 line to match the Si II 1808.01 IUE velocity scale, which sets the velocities of the nearby H2 Lyman (7-0) P(2) 1016.46 and P(3) 1019.50 lines. The (6-0) P(3) 1031.19 and R(4) 1032.35 lines were then used to establish the O VI velocity, as shown in Fig. 2. The measured equivalent widths of several interstellar metal lines are also given in Table 1.
The adopted column densities for several ionic species, as well as several rotational states of H2 along this sightline, are given in Table 2. These were calculated by fitting to a single-component Doppler-broadened curve of growth for Fe II and H2, and by using the apparent column density method (Savage & Sembach 1991) for the other species listed. The two values given for the O VI column are based on the high and low continuum placements. We have added a systematic error of 0.04 dex in quadrature with the statistical error for O VI to account for errors in continuum placement and the velocity interval over which the apparent column density is integrated.
4. Discussion
Since 114 eV are required to convert O+4 to O+5, O VI is almost never produced by photoionization from starlight. Thus, it is a sensitive tracer of hot ( K) collisionally ionized gas in the interstellar medium. Adopting the high continuum placement shown in Fig. 2, which we believe is more appropriate, the O VI column density is and in the Milky Way and LMC, respectively. For the MW gas, sin = 14.17, which agrees well with the median value of 14.21 along 11 Galactic halo sightlines studied by Savage et al. (2000). Here = -3632 is the galactic latitude.
Using in the Milky Way from Wakker et al. (1998) and assuming an error of 0.05 dex, we find . If the low continuum is adopted, this ratio is . Either value is greater than, but consistent with, the halo value determined from FUSE observations of four extragalactic sightlines (Savage et al. 2000), as well as from Copernicus and IUE observations of stars in the lower halo (Spitzer, 1996).
Note that the widths of O VI components in both the MW and LMC are much broader than the thermal line width, which is 30 km s-1 (FWHM) for gas at 300,000 K. The substantial difference in the widths of the C IV and O VI lines may be due to the different scale heights in the Galactic halo of these ions (Savage et al. 2000).
Sk -67 05 was the only star for which Wakker et al. (1998) did not detect C IV in their study of the LMC halo. We recalculated their upper limit to assuming the velocity range observed in the O VI gas ( to km s-1) and find . Adopting the high continuum case we find for the LMC material along the Sk -67 05 sightline.
The H2 column density varies greatly between the LMC and Milky Way. For the LMC we find , summed over the to 5 states (Table 2), and a -value of km s-1. This column density is significantly higher than that measured along other LMC sightlines (de Boer et al. 1998; Shull et al. 2000). By comparison, FUSE observations of the metal deficient galaxy I Zw 18, have yielded only an upper limit, (Vidal-Madjar et al. 2000).
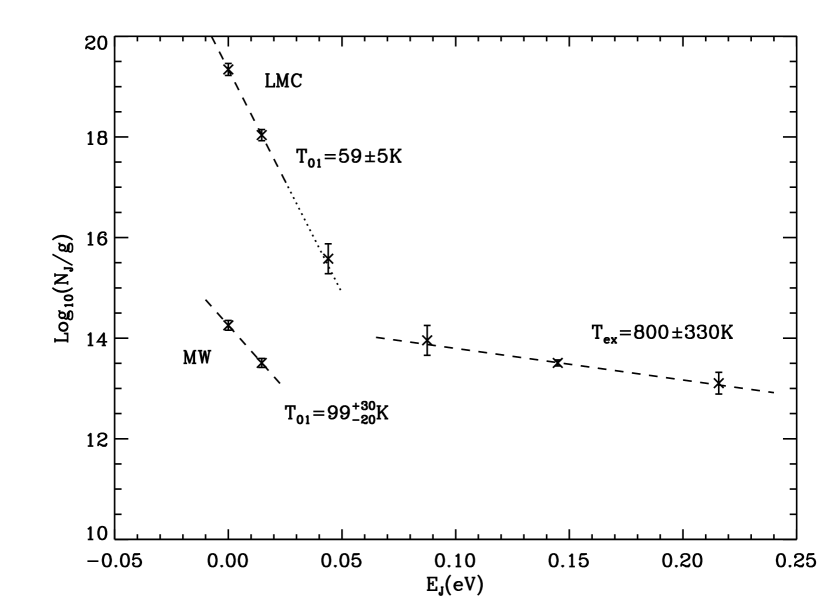
The distribution of H2 rotational states in the LMC is best fitted by a two-component excitation temperature (Fig. 4) with K for and K for . This is similar to the temperature distribution seen along the sightline to star LH10:3120 in the LMC using ORFEUS (de Boer et al. 1998). This indicates that the gas is not in thermal equilibrium, and the higher states are fluorescently pumped by UV radiation. This excited gas may therefore exist in the outer, optically thin regions of the cloud. In the interior regions the molecular fraction may increase due to self-shielding, which is expected when E(B V) 0.1 (Savage et al. 1977). The point falls almost exactly on the extension of the line, suggesting that the density of this gas is rather high.
For the Milky Way gas we find an H2 column density of , summed over the to 3 states (Table 2), and a rotational temperature of K (Fig. 4). This temperature is similar to other values measured with FUSE (Shull et al. 2000) and to Copernicus measurements of Galactic stars (Savage et al. 1977). There is an indication of a two-component temperature distribution for the Milky Way gas as well. However, because of the relatively small number of measurable lines and severe blending, we are unable to accurately determine an excitation temperature for the higher- MW material.
Absorption from both Milky Way and LMC material is clearly seen in all of the low ions present in the LiF1 data (e.g., Figs. 1 and 3). Blending of atomic, ionic, and H2 absorption along this sightline limits the number of species for which we can derive accurate equivalent widths and column densities. The depleted species Fe II has several well-observed transitions in our dataset (Table 1). We have constructed a single-component Doppler-broadened curve of growth for the Fe II lines observed in both the Milky Way and the LMC. The best fit yields and with and km s-1 for the Milky Way and LMC, respectively. Due to potential uncertainties in some of the -values we have adopted a conservative error of 0.1 dex in these column densities. Our data permit good measurements of the non-depleted species P II 1152.82, and we derive lower limits to the Milky Way and LMC column densities (Table 2) using the apparent column density method of Savage & Sembach (1991). If the -values for P II are similar to those derived for Fe II, the data suggest only very moderate saturation corrections of dex.
For the sightline through the halo of the Milky Way, we derive a gas-phase abundance , assuming a solar system ratio of (Anders & Grevesse 1989). For the LMC gas along this direction we find . This suggests significant incorporation of iron into dust grains in both galaxies. Differences in the relative abundance of singly- and doubly-ionized iron and phosphorous could affect this measurement (Sembach et al. 2000), but the magnitude of this effect is likely to be much too small to account for the gas-phase deficiency of iron along this sightline. The derived values of [Fe/P] are similar to the values of and for the Milky Way halo and LMC absorption towards SN 1987A (Welty et al. 1999). Future FUSE observations of a large number of LMC sightlines will allow us to study the distribution of gas-phase abundances and infer the composition of interstellar dust in this environment.
5. Summary
We have reported equivalent widths and column densities of O VI, H2, P II, Si II, Ar I, and Fe II along the line of sight to Sk -67 05 in the LMC using FUSE data. The principal results of this study are:
-
1.
In the halo of the Milky Way toward the LMC , a value somewhat greater than but consistent with other FUSE observations through the halo (Savage et al. 2000). In the LMC, where only an upper limit on is available, we find . This is consistent with the lower ratio seen in the disk of the Milky Way compared to the halo (Savage et al. 2000; Spitzer 1996).
-
2.
The LMC is rich in H2 along this sightline, . A two-component temperature fit gives K for and K.
-
3.
The gas-phase abundances of and in the Milky Way and LMC suggests significant depletion in both locations relative to solar abundances.
References
- (1)
- (2) Anders, E. & Grevesse, N. 1989, Geochim. Cosmochim. Acta, 53, 197
- (3)
- (4) Binney, J. & Merrifield, M. 1998, Galactic Astronomy, Princeton University Press.
- (5)
- (6) de Boer, K. S., Richter, P., Bomans, D. J., Heithausen, A., & Koorneef, J. 1998, A&A, 338, L5
- (7)
- (8) Chu, Y.-H., Wakker, B., Mac Low, M.M., Garcia-Segura, G. 1994, AJ, 108, 1696
- (9)
- (10) Diplas, A. & Savage, B. D. 1994, ApJ, 427, 274.
- (11)
- (12) Massa, D. et al. 2000, ApJ, this issue
- (13)
- (14) Moos, H. W. et al. 2000, ApJ, this issue
- (15)
- (16) Sahnow, D. J. et al. 2000, ApJ, this issue
- (17)
- (18) Savage, B. D., Bohlin, R. C., Drake, J. F., & Budich, W. 1977, ApJ, 216, 291
- (19)
- (20) Savage, B. D. & de Boer, K. S. 1979, ApJ, 230, L77
- (21)
- (22) Savage, B. D.& de Boer, K. S. 1981, ApJ, 243, 460
- (23)
- (24) Savage, B. D. & Sembach, K. R. 1991, ApJ, 379, 245
- (25)
- (26) Savage, B. D. et al. 2000, ApJ, this issue
- (27)
- (28) Sembach, K. R., Howk, J. C., Ryans, R. S., & Keenan, F. P. 2000, ApJ, 528, 310
- (29)
- (30) Shull, J. M. et al. 2000, ApJ, this issue
- (31)
- (32) Smith Neubig, M. M., & Bruhweiler, F. C. 1999, AJ, 117, 2856
- (33)
- (34) Snowden, S. L., & Petre, R. 1994, ApJ, 436, 123
- (35)
- (36) Spitzer, L. 1996, ApJ, 458, L29
- (37)
- (38) Vidal-Madjar, A. et al. 2000, ApJ, this issue
- (39)
- (40) Wakker, B. P., Howk, J. C., Chu, Y.-H., Bomans, D., & Points, S. D. 1998, ApJ, 499, L87
- (41)
- (42) Welty, D. E., Frisch, P. C., Sonneborn, G., & York, D. G. 1999, ApJ, 512, 636
- (43)
| [mÅ]aaMeasured equivalent widths and uncertainties (in mÅ) for the Milky Way (MW) and LMC components towards Sk-67 05. | ||||
|---|---|---|---|---|
| Ion | MW | LMC | ||
| O VI | 1031.926 | 2.14 | bbDerived using the “high” continuum (see text). | bbDerived using the “high” continuum (see text). |
| 1031.926 | 2.14 | ccDerived using the “low” continuum (see text). Probable contamination from H2 () P(3) 1031.19 Å line removed. | ||
| Si II | 1020.699 | 1.46 | ||
| P II | 1152.818 | 2.43 | ||
| Ar I | 1048.220 | 2.41 | ||
| Fe II | 1055.262 | 0.81 | ||
| Fe II | 1112.048 | 0.84ddOscillator strength taken from the preliminary results of Howk et al. (2000, in preparation). | ||
| Fe II | 1121.975 | 1.35ddOscillator strength taken from the preliminary results of Howk et al. (2000, in preparation). | ||
| Fe II | 1125.448 | 1.24 | ||
| Fe II | 1127.098 | 0.48ddOscillator strength taken from the preliminary results of Howk et al. (2000, in preparation). | ||
| Fe II | 1133.665 | 0.74 | ||
| Fe II | 1142.366 | 0.63 | ||
| Fe II | 1144.938 | 2.10 | ||
| [cm-2]aaLogarithm of the adopted column densities for the Milky Way (MW) and LMC components towards Sk-67 05 (in units of ions cm-2). | |||
|---|---|---|---|
| Species | MW | LMC | MethodbbMethod used for deriving column densities: (1) Apparent column density method; (2) Curve of growth fitting method. |
| O VI | ccColumn density using “high” continuum (see text). | ccColumn density using “high” continuum (see text). | 1 |
| O VI | ddColumn density using “low” continuum (see text). | 1 | |
| P II | 1 | ||
| Si II | 1 | ||
| Ar I | 1 | ||
| Fe II | 2 | ||
| H2 () | 2 | ||
| H2 () | 2 | ||
| H2 () | 2 | ||
| H2 () | 2 | ||
| H2 () | 2 | ||
| H2 () | 2 | ||