Detecting the First Objects in the Mid-IR with NGST
Abstract
We calculate the expected Mid-IR molecular hydrogen line emission from the first objects in the universe. Due to their low masses, the stellar feedback from massive stars is able to blowaway their gas content and collect it into a cooling shell where H2 rapidly forms and IR roto-vibrational (as for example the restframe 2.12 m) lines carry away a large fraction (up to 10%) of the explosion energy. The fluxes from these sources are in the range erg s-1 cm-2. The highest number counts are expected in the 20 m band, where about sources/deg2 are predicted at the limiting flux of erg s-1 cm-2. Among the planned observational facilities, we find that the best detection perspectives are offered by NGST, which should be able to reveal about 200 first objects in one hour observation time at its limiting flux in the above band. Therefore, Mid-IR instruments appear to represent perfect tools to trace star formation and stellar feedback in the high () redshift universe.
keywords:
galaxies: formation - intergalactic medium - cosmology: theory - ISM: molecules1 Introduction
Detecting the first luminous objects in the universe will be the primary goal of several future space- and ground-based telescopes. The importance of these experiments consists in the fact that they could be able to test current cosmological scenarios, study the properties of these (supposedly very small) galaxies, and their effects on the surrounding environment (as for example reionization, heating and metal enrichment of the IGM). Due to the predicted low luminosity of such objects, this task will be at the capability edge of even the most advanced and powerful instruments. Apart from the indirect probes of their effects, as for example the secondary anisotropies in the CMB left by reionization (Knox, Scoccimarro & Dodelson 1998; Gruzinov & Hu 1998; Bruscoli et al. 2000; Benson et al. 2000), some search strategies have already been suggested in the literature. Marri & Ferrara (1998) and Marri, Ferrara & Pozzetti (2000) have suggested that Type II supernovae occurring in the first objects might outshine their parent galaxy by more than a hundred times and become visible by instruments like the Next Generation Space Telescope (NGST). Schneider et al. (2000) have investigated the possibility of detecting gravitational wave emission from high-redshift very massive objects with LISA. Oh (1999) proposes direct imaging of the ionized halos around primordial objects either via their free-free emission (possibly detectable with the Square Kilometer Array) or Balmer line emission again with NGST.
One point that is particularly important when dealing with these low mass systems is that they are strongly affected by feedback mechanisms both of radiative and stellar type; these have been extensively investigated by Ciardi et al. (2000). Molecular hydrogen, being the only available coolant in a plasma of nearly primordial composition, is a key species in the feedback network as it regulates the collapse and star formation in these objects. Ferrara (1998, F98) pointed out that H2 is efficiently formed in cooling gas behind shocks produced during the blowaway (i.e. the complete ejection of the galactic gas due to SN explosions) process thought to occur in the first objects, with typical H2 fractions . We shall see that the conditions in these cooling blastwaves are such that a noticeable amount of the explosion energy is carried away by infrared (redshifted into the Mid-IR [MIR] spectral region) H2 molecular lines, which therefore might provide us with a superb tool to detect and trace these very distant primordial galactic blocks.
The use of molecular lines as diagnostics of moderate redshift () galaxies has already been proposed by some authors (Frayer & Brown 1997; Blain et al. 2000); at higher redshifts pioneering calculations were carried on by Shchekinov & Éntel’ (1985); more recently Silk & Spaans (1997) concentrated on the CO and dust emission from HII regions inside larger galaxies. All these studies have emphasized the power of the molecular line emission as a probe of distant sources. Based on previous calculations (F98), in this paper we calculate MIR fluxes and number counts for these sources in various bands and assess if forthcoming observing facilities will be able to eventually unveil the beginning of the cosmic star formation era and study the feedback processes in the young universe.
2 Emission model
Due to its symmetry, the H2 molecule has no electric dipole moment in the ground state. Therefore, the first detectable H2 emission lines are produced by quadrupole radiation and they are purely rotational. The line properties of interest to the present work, both for rotational and roto-vibrational lines, are listed in Table 1. There we see that the excitation temperatures, , of these lines fall in the range 500-7000 K. The temperature range spanned during the cooling of the post-shock IGM gas produced during the blowaway of low-mass primordial galaxies is (F98):
| (1) |
where is the total mass of the galaxy.111 We adopt a CDM (cluster normalized) cosmology with . The upper limit is set by the condition that the cooling time of the post-shock gas is shorter than the Hubble time. Strictly speaking the above upper limit holds until the IGM cooling is dominated by the inverse Compton radiative losses (), but we use it down to , where it still represents a very good approximation for our purposes. Given the range in eq. 1, it is then conceivable that the above molecular lines are excited during the process in which a cold shell forms, thus producing potentially detectable radiation. The flux observed on the ground in a given line is derived as follows.
Let be the restframe frequency of photons emitted by the molecule during the transition between the energy levels and ; then the line emissivity (erg s-1 cm-3 sr-1) is (Spitzer 1978):
| (2) |
where is the number density of molecules in the level and is the Einstein coefficient for spontaneous emission. The typical H2 densities found are much lower than the critical one ( cm-3), hence we neglect collisional de-excitations.
As the conditions for thermodynamic equilibrium are not satisfied, the population of the various levels must be obtained by solving the detailed balance equations (Spitzer 1978). Using this approach, the number density of molecules in the vibrational level , , of even and odd rotational levels decouple, and they are obtained by iteration using the following formula:
| (3) |
where is the statistical weight of level , is the ratio between the collisional excitation rate and the Einstein coefficient, is the energy difference between the two levels. Obviously, in the limit of large eq. 3 approaches the Boltzmann distribution.
Given the post-shock temperatures found (eq. 1), it is only necessary to consider the two vibrational levels . The relative number of molecules in these two levels depends on the total molecular hydrogen density, . For a given redshift, the value of (F98) is:
| (4) |
where is the molecular fraction in the shell, and is the IGM hydrogen density. We allow for a density enhancement in the shell with respect to equal to ; this is produced both by the shock compression and the possible occurrence of the explosion inside an overdense region of the universe (e.g. a cosmological filament). Because of the first effect, and as the expanding blastwave becomes rapidly radiative, is given by the square of the shock Mach number, , with respect to the ambient IGM. Following F98, it is easy to show that the density enhancement is given by:
| (5) |
For simplicity, we have neglected the additional density increase produced by an explosion in a overdense region; thus, the results presented above should be interpreted as a conservative lower limit to the detectability of the sources under investigation. Finally, we assume a branching ratio (0.25) for ortho (para) transitions which is valid under LTE conditions; however, non-equilibrium conditions might lead to slightly lower values of the ortho-to-para ratio (Chrysostomou et al. 1993; Rodríguez-Fernández et al. 2000).
Table 1: Relevant H2 Transition Lines
| Transition | [m] | T [K] | A(3) [s-1] |
|---|---|---|---|
| 0-0S(0) | 28.0 | 512 | 2.94 |
| 0-0S(1) | 17.0 | 1015 | 4.76 |
| 0-0S(3) | 9.7 | 2503 | 9.84 |
| 0-0S(5) | 6.9 | 4586 | 5.88 |
| 1-0S(1) | 2.12 | 6953 | 3.47 |
(1)Emission wavelength
(2)Excitation temperature (Combes & Pfenninger 1998;
Timmermann et al. 1996)
(3)De-excitation Einsten coefficient (Turner, Kirby-Docken
& Dalgarno 1977)
With the emissivity given by eq. 2, the observed flux (erg s-1 cm-2) is:
| (6) |
where is the observed frequency, the luminosity and is the cosmological luminosity distance. For a flat universe (), is given by
| (7) |
| (8) |
where km s-1 Mpc-1 is the current Hubble constant. The corresponding luminosity is:
| (9) |
where is the physical volume occupied by the H2 forming shell. The values of and are obtained from the formulae in F98; the only difference consists in the assumption of a single burst of star formation, as opposed to the quiescent star formation prescription of F98. By assuming a star formation efficiency of 10%, and one SN every 100 of stars formed, it is easy to show that the total energy of the explosion is equal to erg. Then, from F98 it follows:
| (10) |
| (11) |
where we have assumed that all the swept IGM mass is in the cool shell of total mass , together with the galaxy interstellar medium. This result is somewhat dependent on the assumption made to derive the energy of the explosion, while it is not strongly dependent on the cosmology.
3 Number Counts
The number of objects whose observed flux is larger than the threshold value is:
| (12) | |||||
where is the comoving number density of halos with masses between and (Press & Schechter 1974) and is the comoving volume element per unit redshift:
| (13) |
where and are given in eqs. 7 and 8, respectively. The limits and depend on the observational wavelength band; is the luminosity corresponding to the maximum mass value, , experiencing blowaway at redshift (Ciardi et al. 2000); . Here is the minimum halo mass in which stars can form at a given redshift, which is related to the minimum virial temperature of K below which atomic hydrogen cooling of the gas is suppressed and fragmentation into stars is inhibited (Haiman, Rees & Loeb 1997; Ciardi et al. 2000); is the mass of the halo producing the luminosity corresponding to the observed flux . Finally, the luminosity, , is taken as the maximum one reached by the object (usually corresponding to temperatures equal to the excitation ones) that experiences a blowaway at redshift , providing that it is emitted at a redshift . These calculations give lower limits, as they do not include objects blowing away at , but having a peak luminosity at .
4 Results
The above model allows us to determine the observational properties of the MIR emission from the first objects. In particular, we present results concerning the expected flux in the various lines considered (see Table 1) and the corresponding number counts. These are then compared with the sensitivities of various planned instruments.
4.1 Expected MIR Fluxes
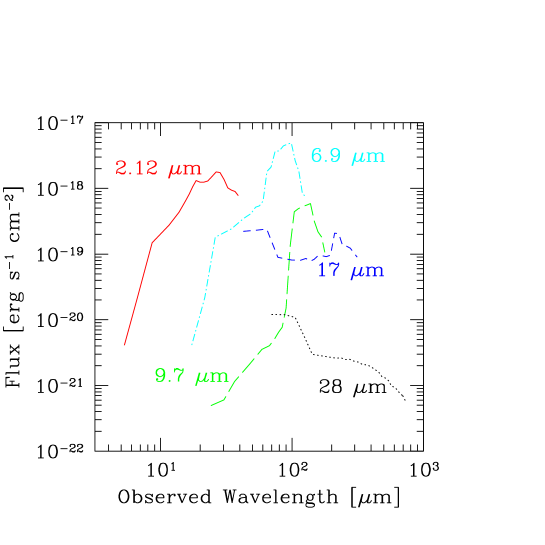
Fig. 1 shows the expected flux as a function of the observed wavelength, , in the five different lines 2.12 m, 6.9 m, 9.7 m, 17 m and 28 m. As an example, we plot the fluxes calculated for halos of mass , corresponding to the mean one among those suffering blowaway, as given by the Press-Schechter formalism, at the explosion redshift. The curves refer to emission occurring when the shocked gas temperature has decreased down to values close to the corresponding line excitation temperature. Thus, the actual emission redshift is somewhat lower than the explosion redshift.
From Fig. 1 we see that the typical observed fluxes are in the range erg s-1 cm-2, depending on the wavelength band (and therefore emission redshift). For the 2.12 m, 6.9 m and 9.7 m emission lines the flux is increasing with wavelength, whereas the flux of the 17 m and 28 m excitation lines is decreasing towards higher . From a general point of view this can be understood as follows. As the IGM density increases with redshift, this causes a corresponding increase in the emissivity. In addition, the postshock gas tends to be warmer at high , hence inducing preferentially the excitation of the higher excitation temperature lines. These effects are dominant for the 2.12 m, 6.9 m and 9.7 m lines, while they are overwhelmed by a larger value of and a smaller shell emission volume for the redder ones, producing a decreasing intensity.
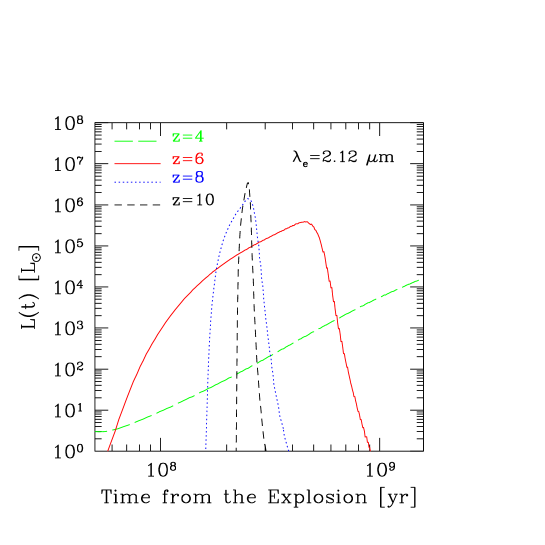
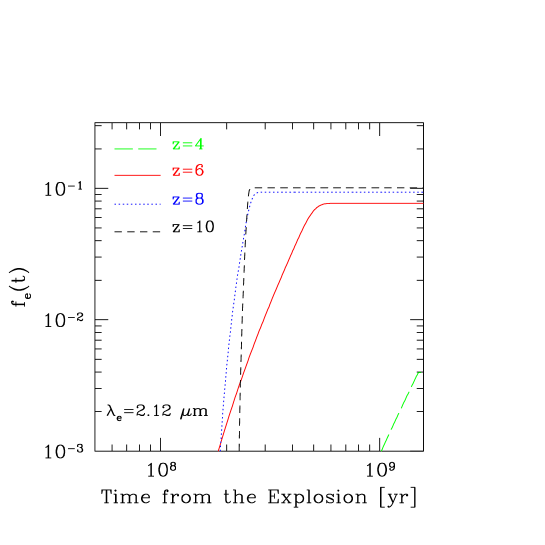
As detection chances are highest for the 2.12 m line, we have derived its luminosity evolution and the corresponding fraction of the SN energy radiated in this line by objects at different redshifts. As for Fig. 1, the emission is derived for an average halo mass. In Fig. 2a we show the luminosity evolution for selected redshifts in the range . As the explosion reshift is increased, the peak of the emission is shifted at earlier times and it becomes narrower. Both effects are due to the faster evolution of the temperature driven by the enhanced (i.e. ) Compton cooling rates. The more pronounced peak occurring at higher is due to the density increase; this trend is partially counterbalanced by the decreasing average halo masses with redshift. Fig. 2b shows the time dependence of the cumulative fraction of the SN mechanical energy emitted in the m line. This quantity increases over a time scale inversely related to the explosion redshift and reaches a plateau, determined by the position of the peak seen in Fig. 2a. At high redshift up to 10% of the SN mechanical energy is carried away by the considered roto-vibrational line; at lower redshifts this value rapidly decreases below 1%.
4.2 Number Counts and Detectability
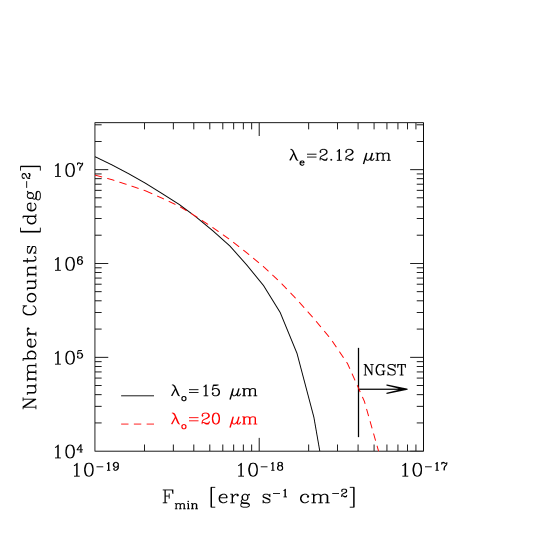
By using the expressions given in eq. 12 we calculate the expected number of objects per unit sky area as a function of the limiting flux, , of a given experiment. The corresponding curves are shown in Fig. 3 for the 2.12 m H2 line. The number counts have been estimated in two different MIR bands in the sensitivity range of planned imaging detectors on board of the Next Generation Space Telescope222http://augusta.stsci.edu (NGST). For our study, we consider the imaging mode of NGST, in the two bands centered at and 20 m. In the m band, the largest fluxes are at the erg s-1 cm-2 level, where about objects/deg2 should be seen; the surface density of sources increases rapidly as decreases. In the m band objects are fainter and a rapid drop is seen in the number counts above erg s-1 cm-2.
In the above bands, NGST will reach a sensitivity of erg s-1 cm-2 (shown in the Figure) for a detection in one hour. At the above sensitivity level, and with its field of view of 4’4’, NGST should be able to detect about 200 sources in the m band in one hour integration at the level. These objects are all located in the redshift range , a very intriguing time during cosmic evolution, perhaps bracketing the reionization epoch. Assuming a diffraction limited telescope (angular resolution ) at this wavelength, field crowding should not be a problem, the number of sources being well below the confusion limit.
Longer exposure times might also allow detections in the 15 m band. Sensitivities comparable to the NGST ones are also expected for the SPICA HII/L2 future mission333http://www.ir.isas.ac.jp.. Other MIR planned facilities, such as SIRTF or FIRST will only reach sensitivities erg s-1 cm-2, depending on observational bands.
In conclusion, NGST appears to constitute the best tool to reveal the emission from the first objects; while other above mentioned instruments will not reach the required sensitivities.
5 Conclusions
We have investigated the possibility to detect the first objects in the universe through the MIR line emission associated with the stellar feedback (i.e. blowaway of the gas) induced by their supernovae. A noticeable fraction of the explosion energy (up to 10% in the 2.2m line alone) is eventually converted and carried away by molecular hydrogen roto-vibrational lines. By using a detailed treatment of the non-equilibrium formation and emission of H2 molecules behind these cosmological blastwaves we have calculated the observed fluxes and number counts of primordial objects and compared them with the expected sensitivities of future instruments. At the limiting flux of NGST, we do predict that about 200 primordial objects can be detected 20 m in barely one hour of observation time.
This detection would allow to directly image the first star formation in the universe and our results show that MIR observations, when compared with estimates of previous studies in other bands and/or exploiting different strategies, represent a superb tool for this study. In addition, the proposed excitation mechanism will also allow to test and calibrate the stellar feedback process in the dark ages and finally assess the degree at which the first galaxies (and the IGM) have been influenced by supernova energy deposition. This obviously holds the key for the understanding of the subsequent evolution and formation of larger galactic blocks in most cosmological models. MIR line emission allows the high redshift universe () to be much more easily explored than in the near IR bands, where the intergalactic absorption might be found to strongly affect the detectability of objects located close or beyond the reionization epoch: for example, the predicted dust opacity to sources located at redshift is as high as at the observed wavelength m, and could considerably affect observations of the distant universe in that band (Ferrara et al. 1999; Loeb & Haiman 1997). It is worth noting that our predictions constitute lower limits to the number of observable objects as we have not considered possible density enhancements descending from explosions occurring inside overdense regions, as the filaments of the cosmic web (and also because of some details of the calculations, see Sec. 3).
Molecular hydrogen lines might also be excited during the collapse of the so-called PopIII objects, which rely on this molecule to collapse and form stars. However, there are several reasons to suspect that the contribution of this process will be negligible with respect to the emission due to the stellar feedback. First, if a UV background is present, molecular hydrogen can be destroyed by photodissociation. Even if there is no UV background, dissociation of molecular hydrogen by internal UV radiation emitted from massive stars, formed in the high density regions of the objects, is very efficient and the evolution of the objects and star formation are strongly affected (Omukai & Nishi 1999). This regulation effect is efficient as long as the line emission of molecular hydrogen is the main cooling process, i.e. if and K (Nishi & Tashiro 2000). Second, the mass of these objects is very small and therefore the amount of gas in the required thermodynamic state for the emission is very limited. Interestingly, the relative little importance of PopIII objects in terms of their radiation power in ionizing photons with respect to objects of mass above has already been established by Ciardi et al. (2000). The latter objects emit a very large fraction of their binding energy in the hydrogen Ly line which is therefore a much better tracer of their formation (Haiman, Spaans & Quataert 2000).
Acknowledgments
We are indebted to the referee, R. Schneider, for insightful comments. It is also a pleasure to acknowledge several useful discussions with A. Loeb, R. Maiolino, R. Nishi, F. Palla, N. Scoville, Y. Shchekinov and T. Takeuchi. AF acknowledges support from Ecole Normale Superieure, Paris.
References
- [1] Benson, A., Nusser, A., Sugiyama, N. & Lacey, C. G. 2000, preprint (astro-ph/0002457)
- [2] Blain, A. W., Frayer, D. T., Bock, J. J. & Scoville, N. Z. 2000, MNRAS, 313, 559
- [3] Bruscoli, M., Ferrara, A., Fabbri, R. & Ciardi, B. 2000, MNRAS, 318, 1068
- [4] Chrysostomou, A., Brand, P. W. J. L., Burton, M. D. & Moorhouse, A. 1993, MNRAS, 265, 329
- [5] Ciardi, B., Ferrara, A., Governato, F. & Jenkins, A. 2000, MNRAS, 314, 611
- [6] Combes, F. & Pfenniger, D. 1997, A&A, 327, 453
- [7] Ferrara, A. 1998, ApJ, 499, 17L
- [8] Ferrara, A., Nath, B., Sethi, S. & Shchekinov, Yu. 1999, MNRAS, 303, 301
- [9] Frayer, D. T. & Brown, R. L. 1997, ApJS, 113, 221
- [10] Haiman, Z., Rees, M. J. & Loeb, A. 1997, ApJ, 476, 458
- [11] Haiman, Z., Spaans, M. & Quataert, E. 2000, ApJ, 537, L5
- [12] Gruzinov, A. & Hu, W. 1998, ApJ, 508, 435
- [13] Knox, L., Scoccimarro, R. & Dodelson, S. 1998, Phys. Rev. Lett., 81, 2004
- [14] Loeb, A. & Haiman, Z. 1997, ApJ, 490, 571
- [15] Marri, S. & Ferrara, A. 1998, ApJ, 509, 43
- [16] Marri, S., Ferrara, A. & Pozzetti, L. 2000, MNRAS, 317, 265
- [17] Nishi, R. & Tashiro, M. 2000, ApJ, 537, in press
- [18] Oh, S. P. 1999, ApJ, 527, 160
- [19] Omukai, K. & Nishi, R. 1999, ApJ, 518, 64
- [20] Press, W. H. & Schechter, P. 1974, ApJ, 187, 425
- [21] Rodríguez-Fernández, N. J. et al. 2000, A&A, 356, 695
- [22] Schneider, R., Ferrara, A., Ciardi, B., Ferrari, V. & Matarrese, S. 2000, MNRAS, 317, 385
- [23] Shchekinov, Y. A. & Éntél’, M. B. 1985, Sov. Astron., 29, 491
- [24] Silk, J. & Spaans, M. 1997, ApJL, 488, 79
- [25] Spitzer, L. Jr. 1978, Physical Processes in the Interstellar Medium (Wiley-Interscience: New York)
- [26] Timmermann, R. et al. 1996, A&A, 315, 281L
- [27] Turner, J., Kirby-Docken, K. & Dalgarno, A. 1977, ApJS, 35, 281